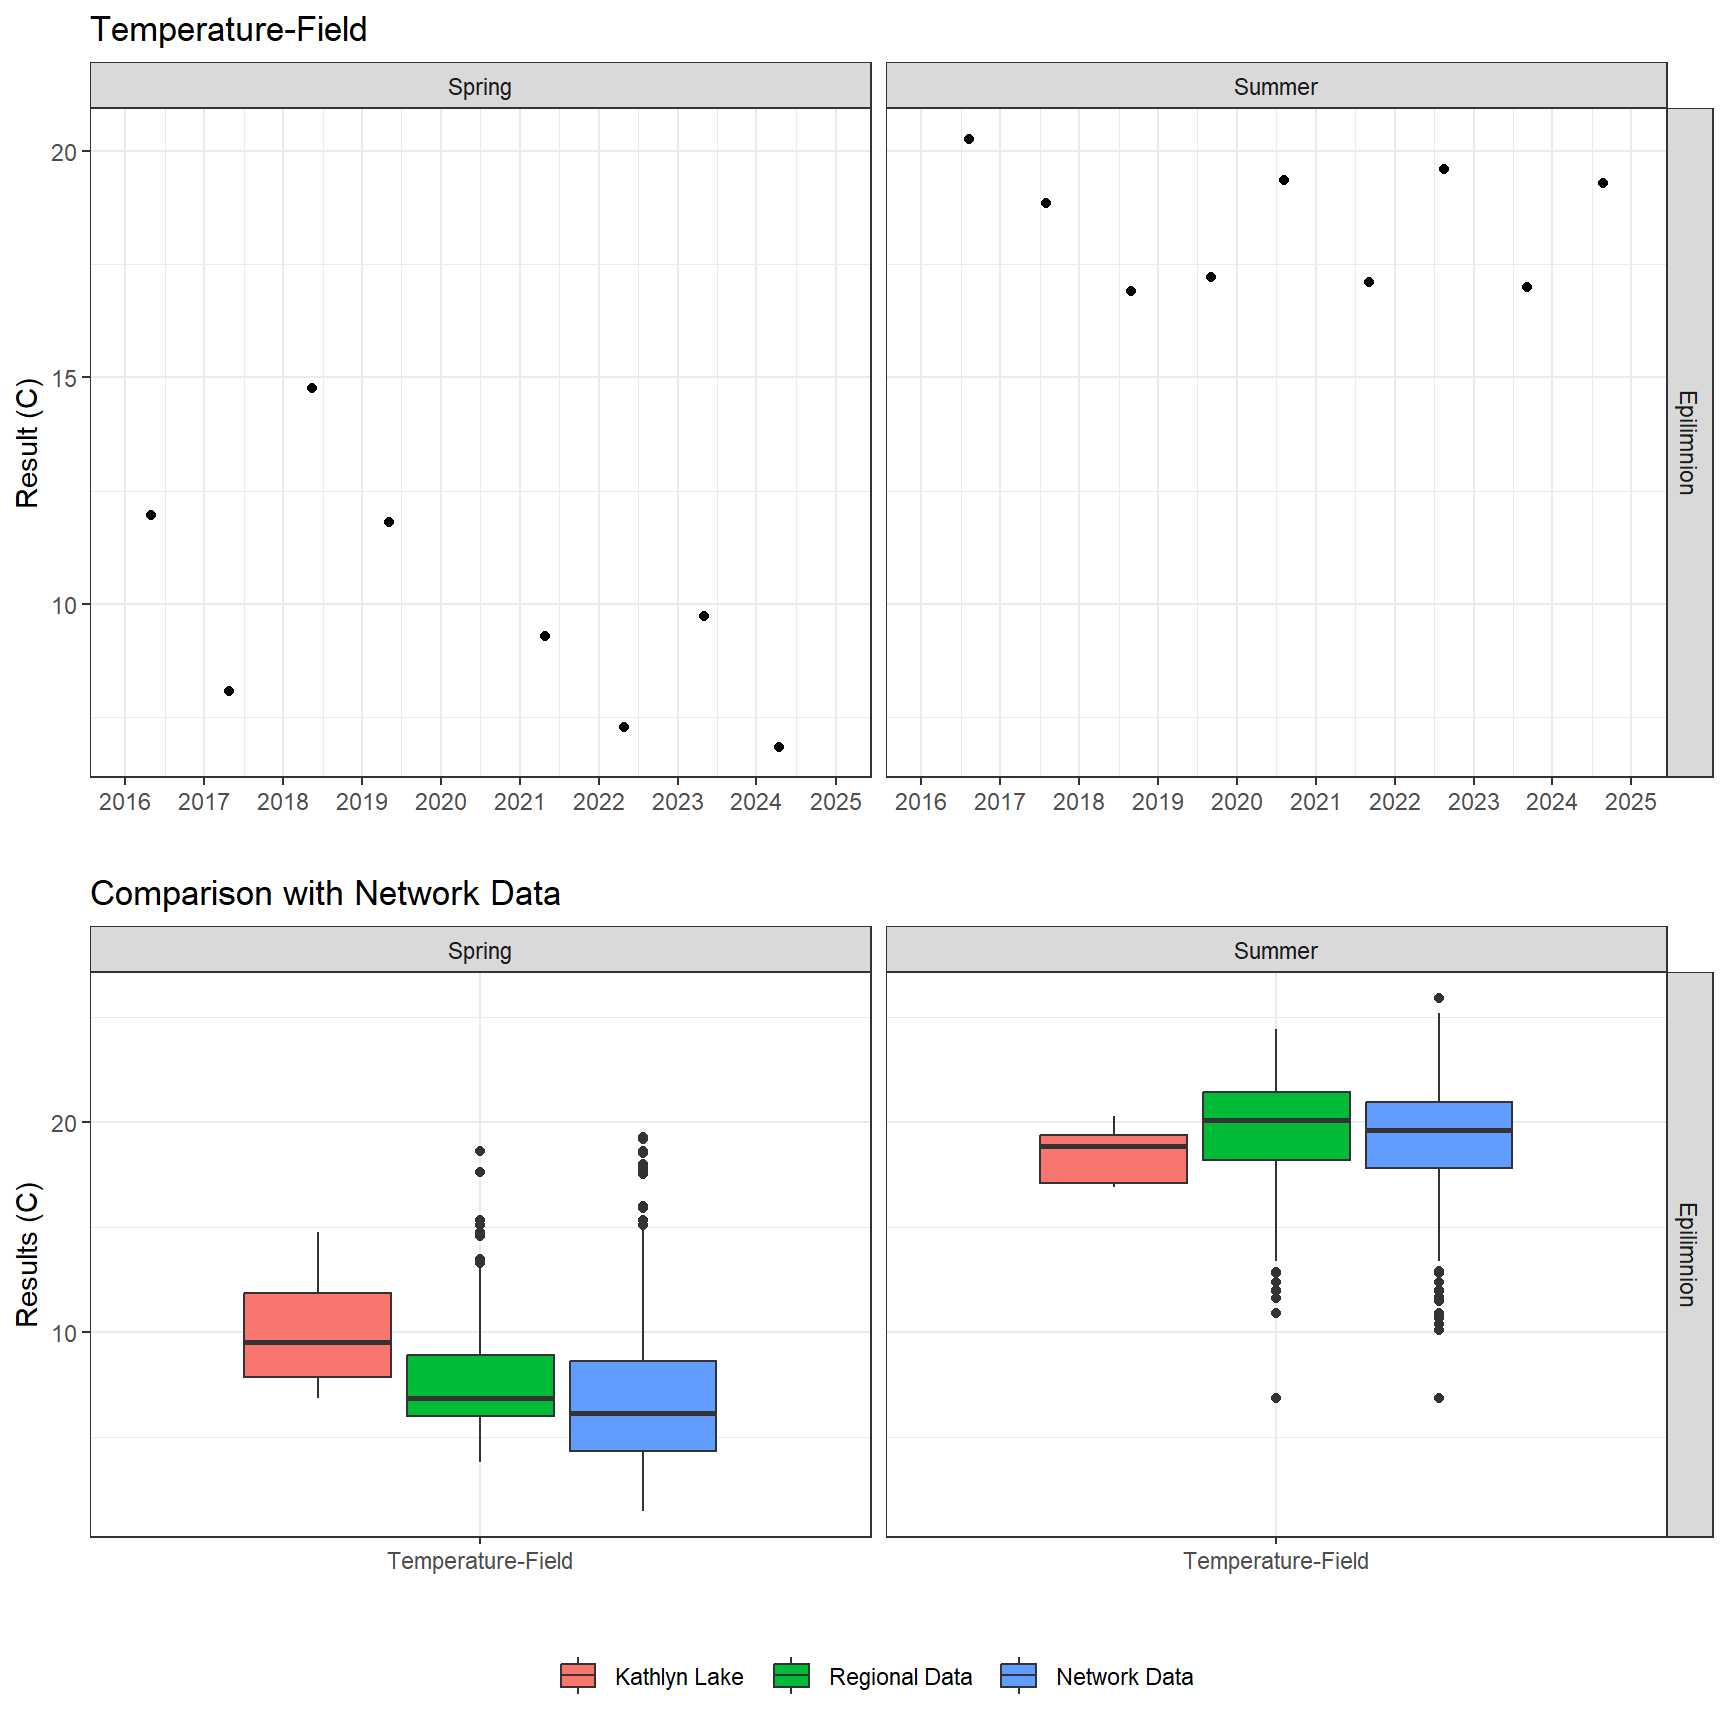
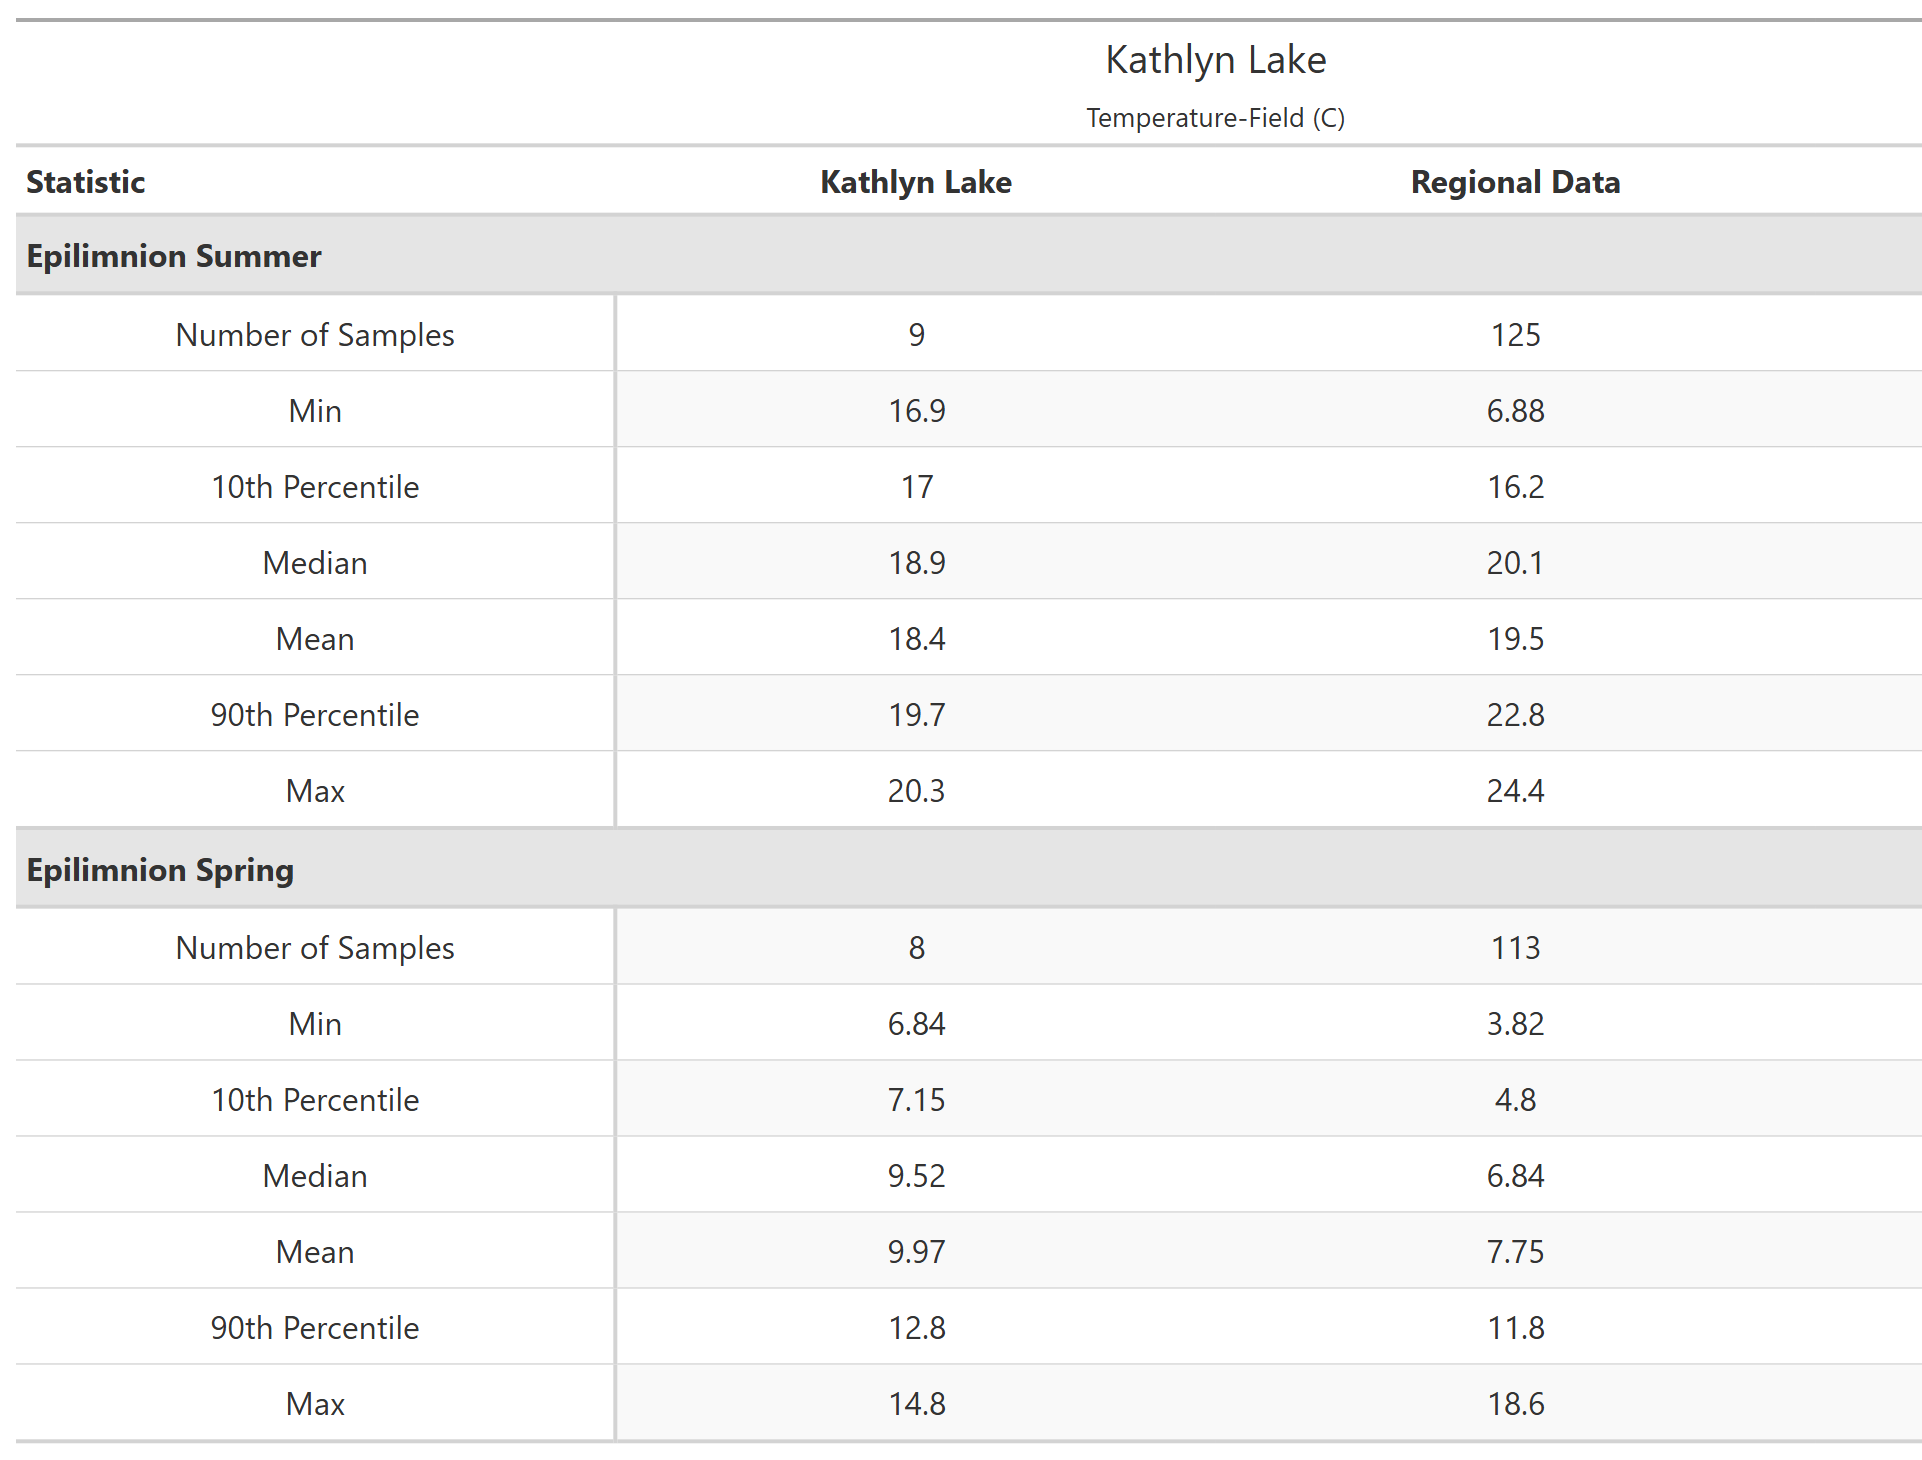
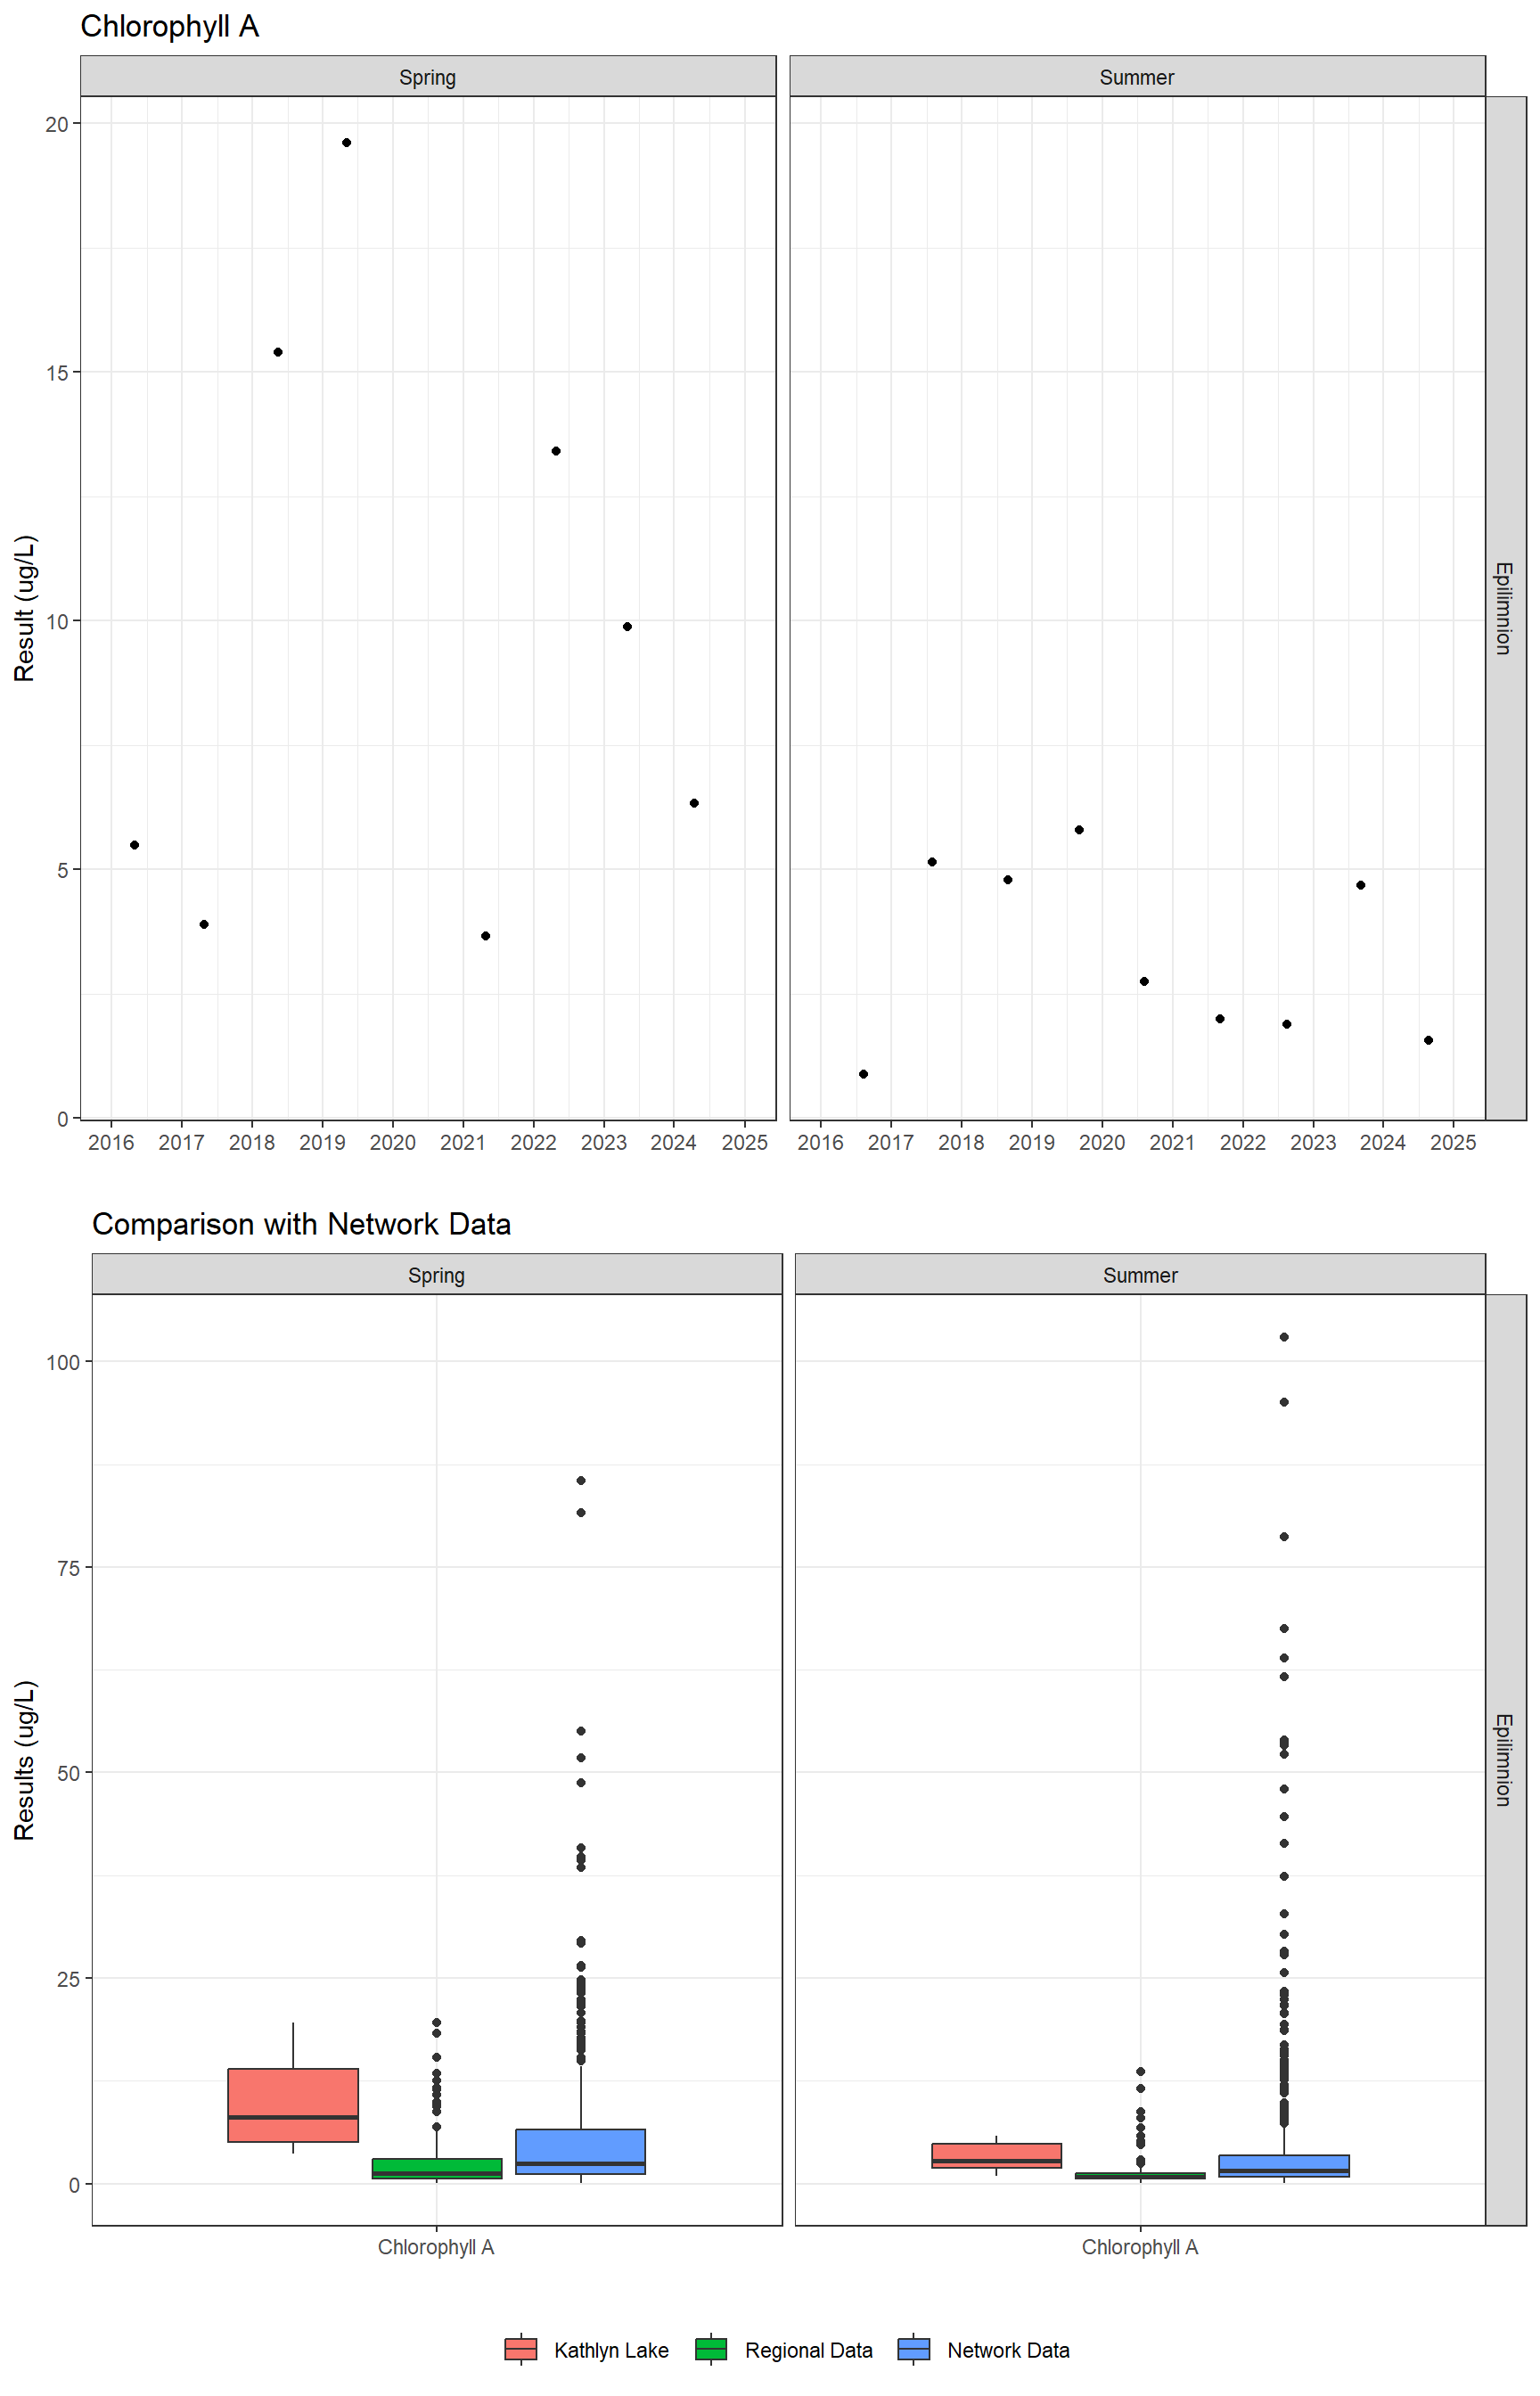
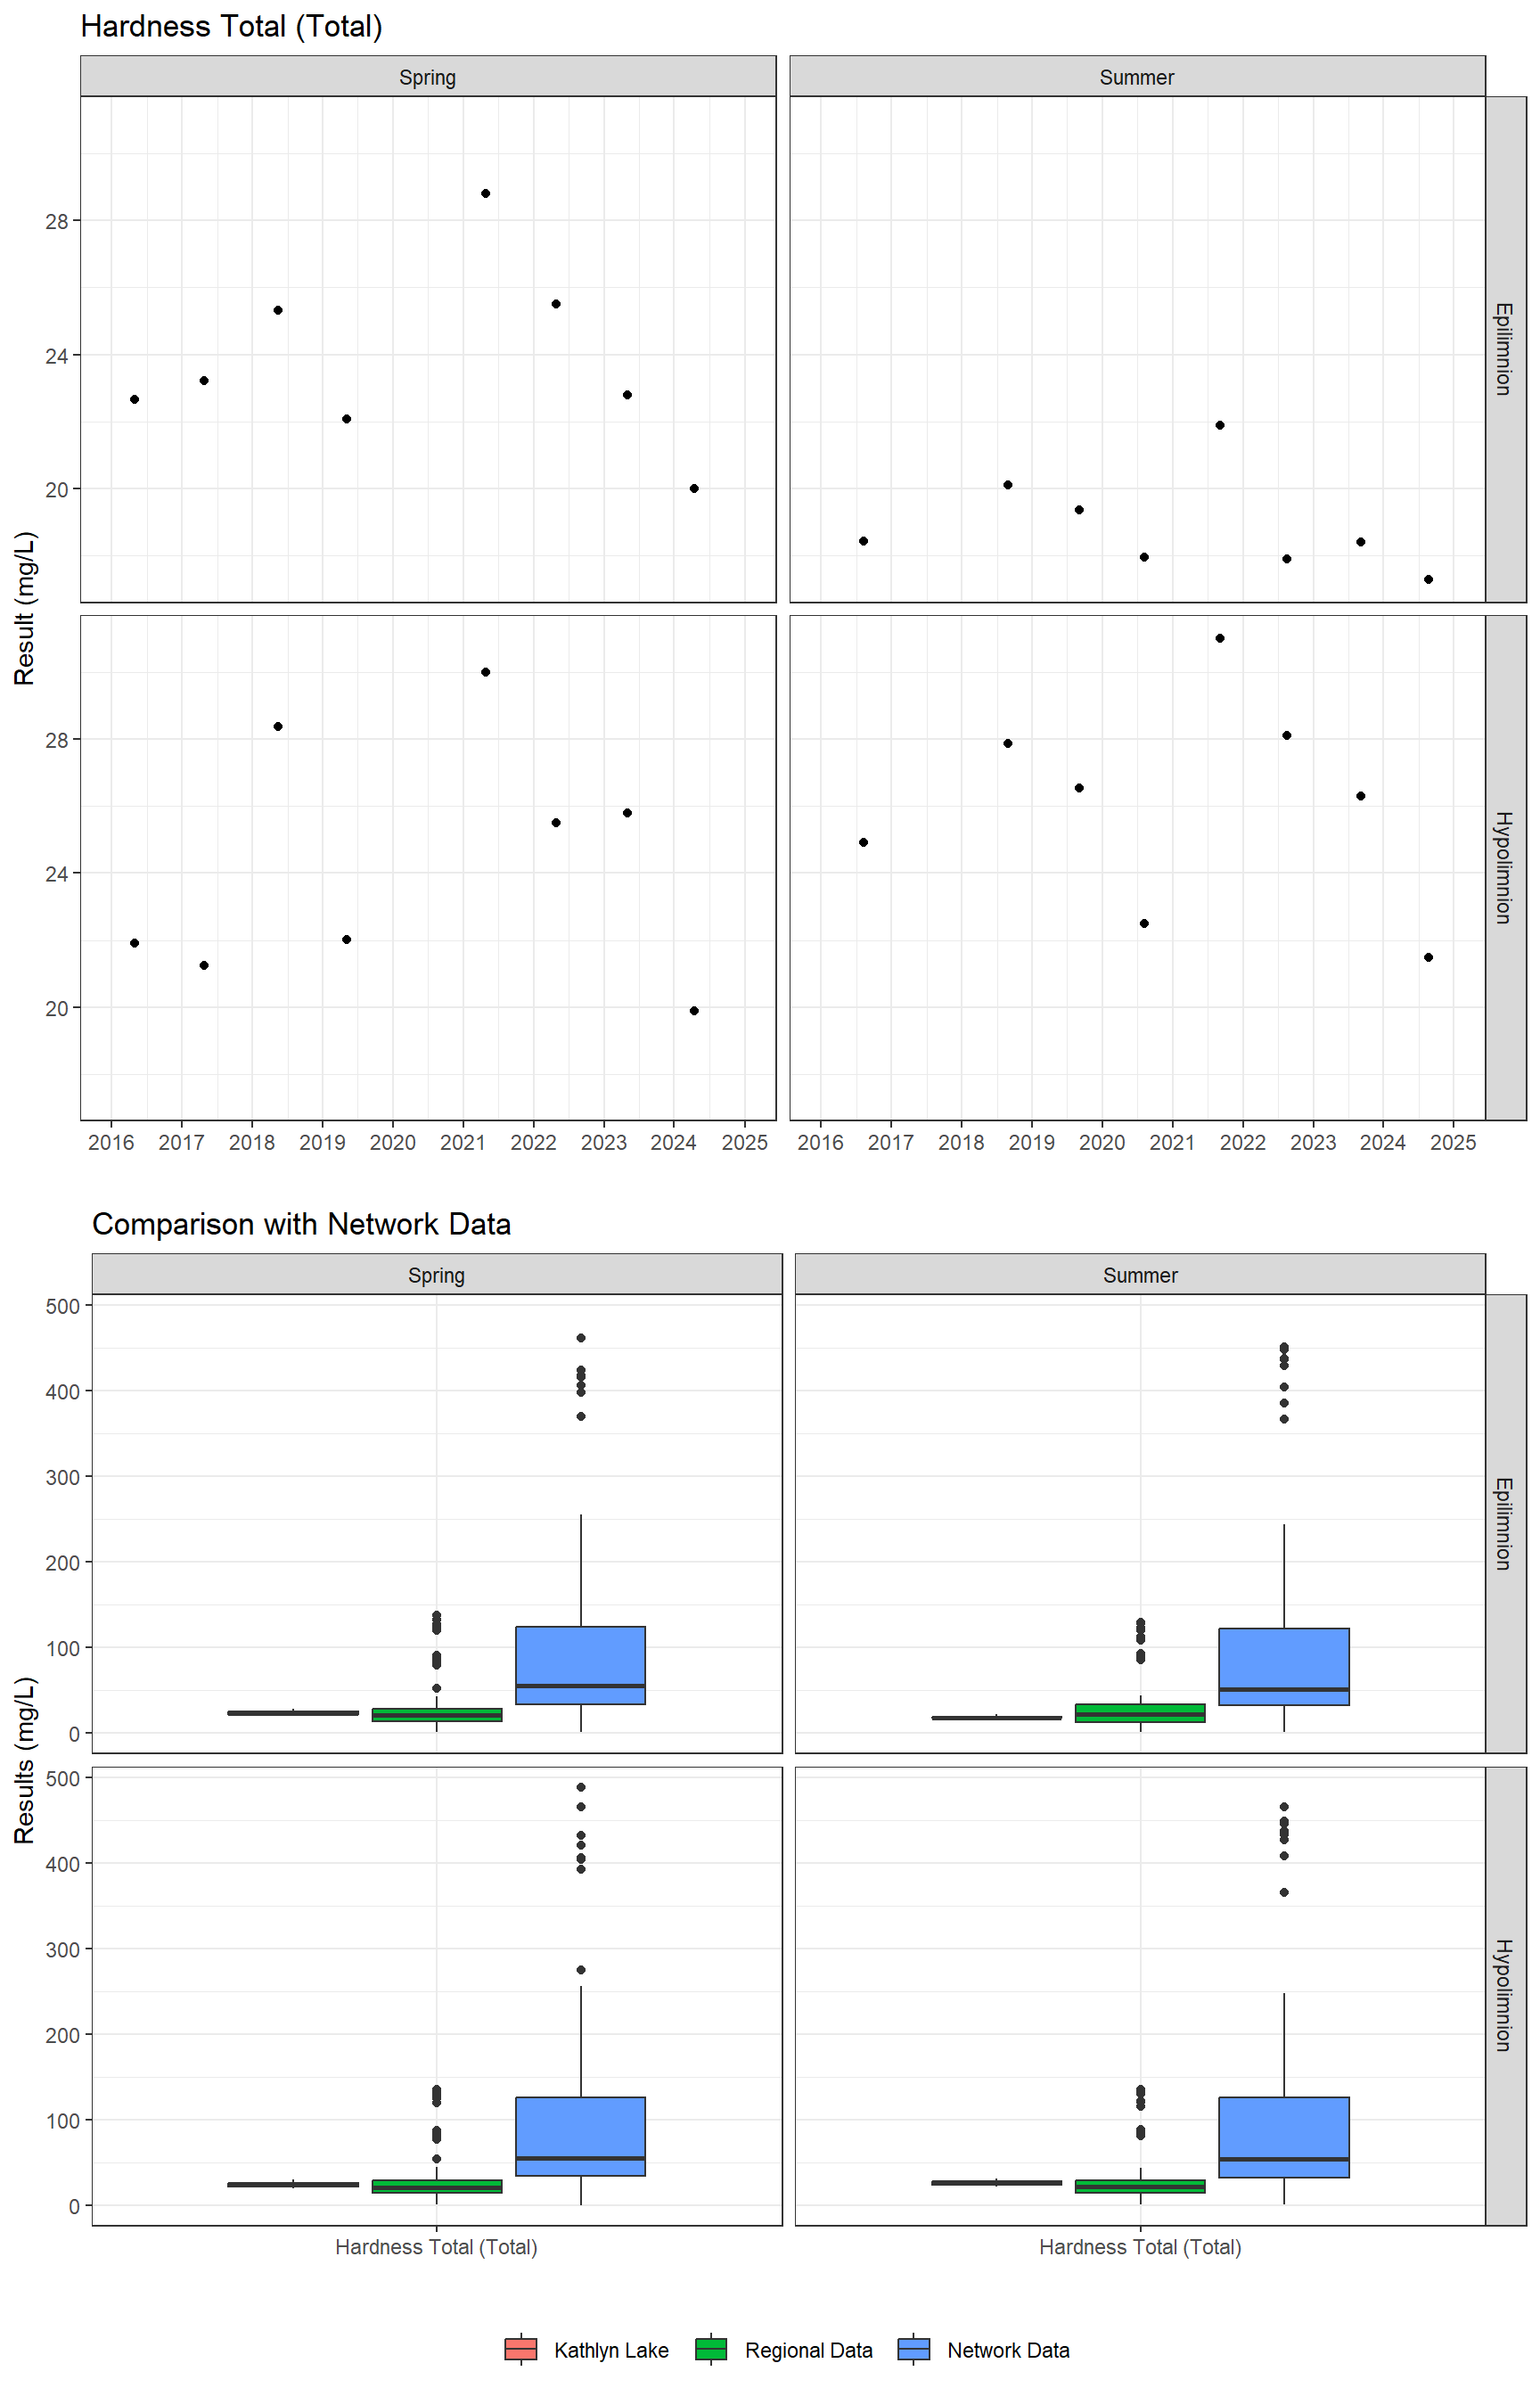
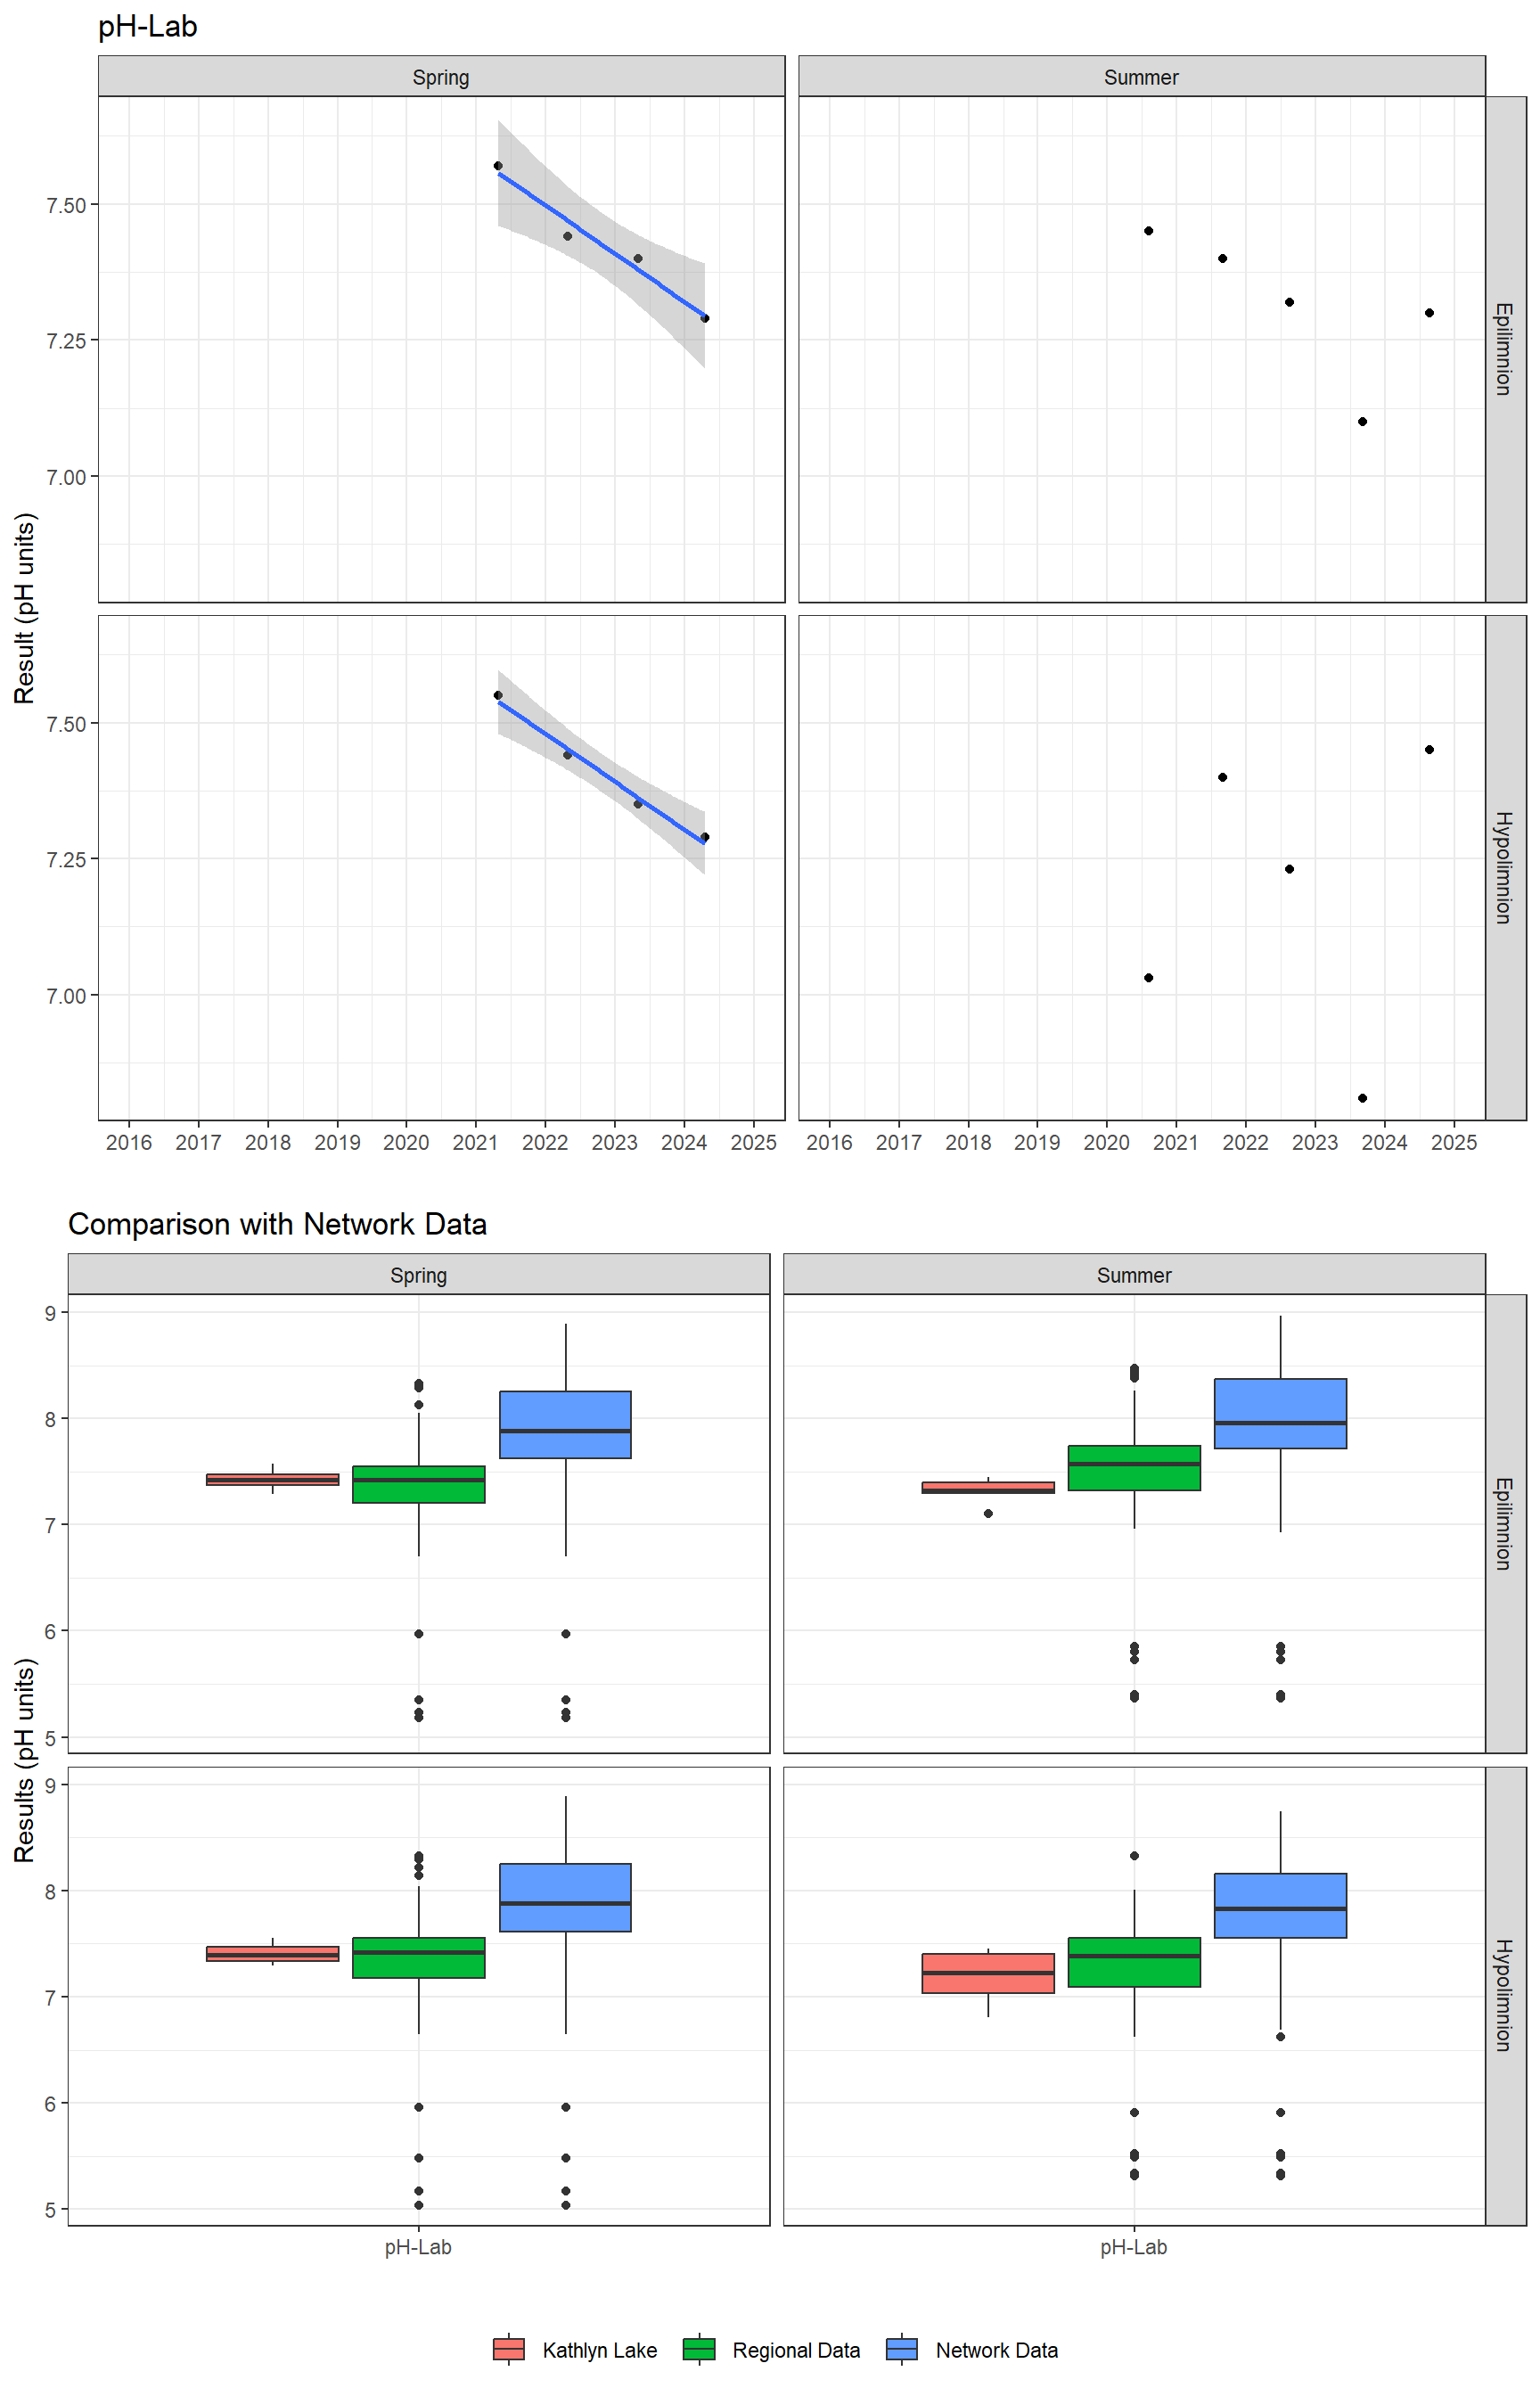
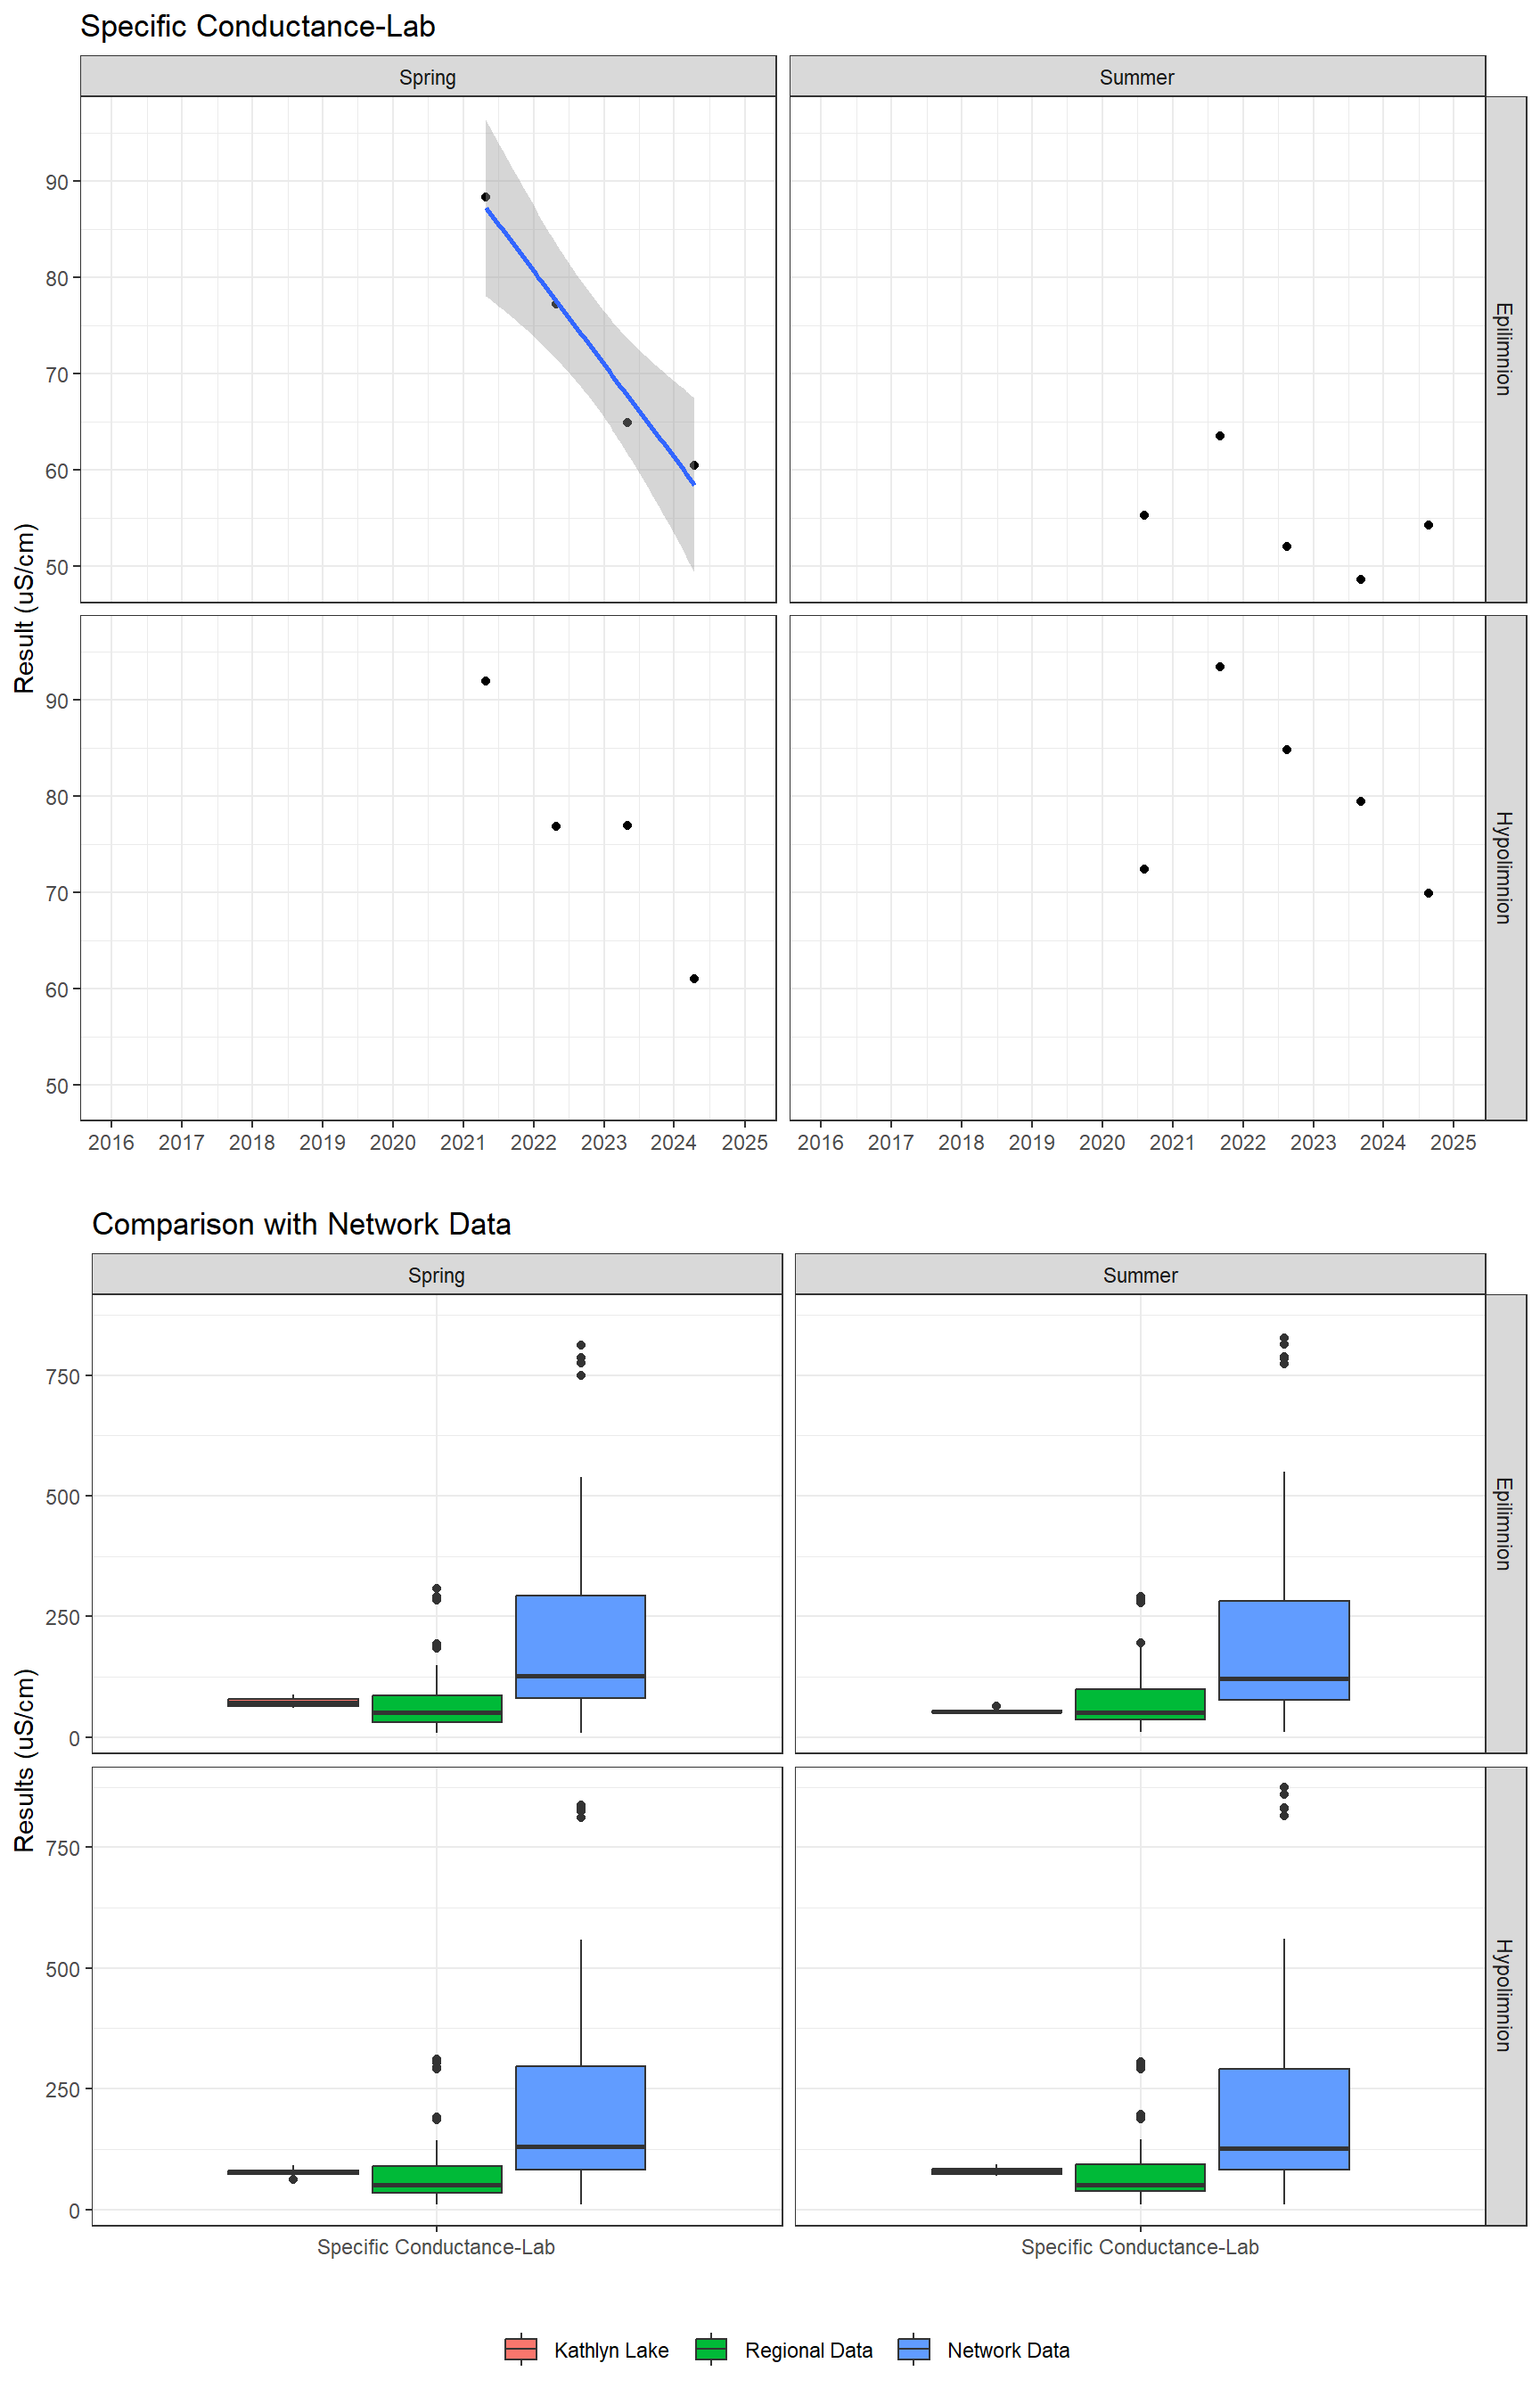
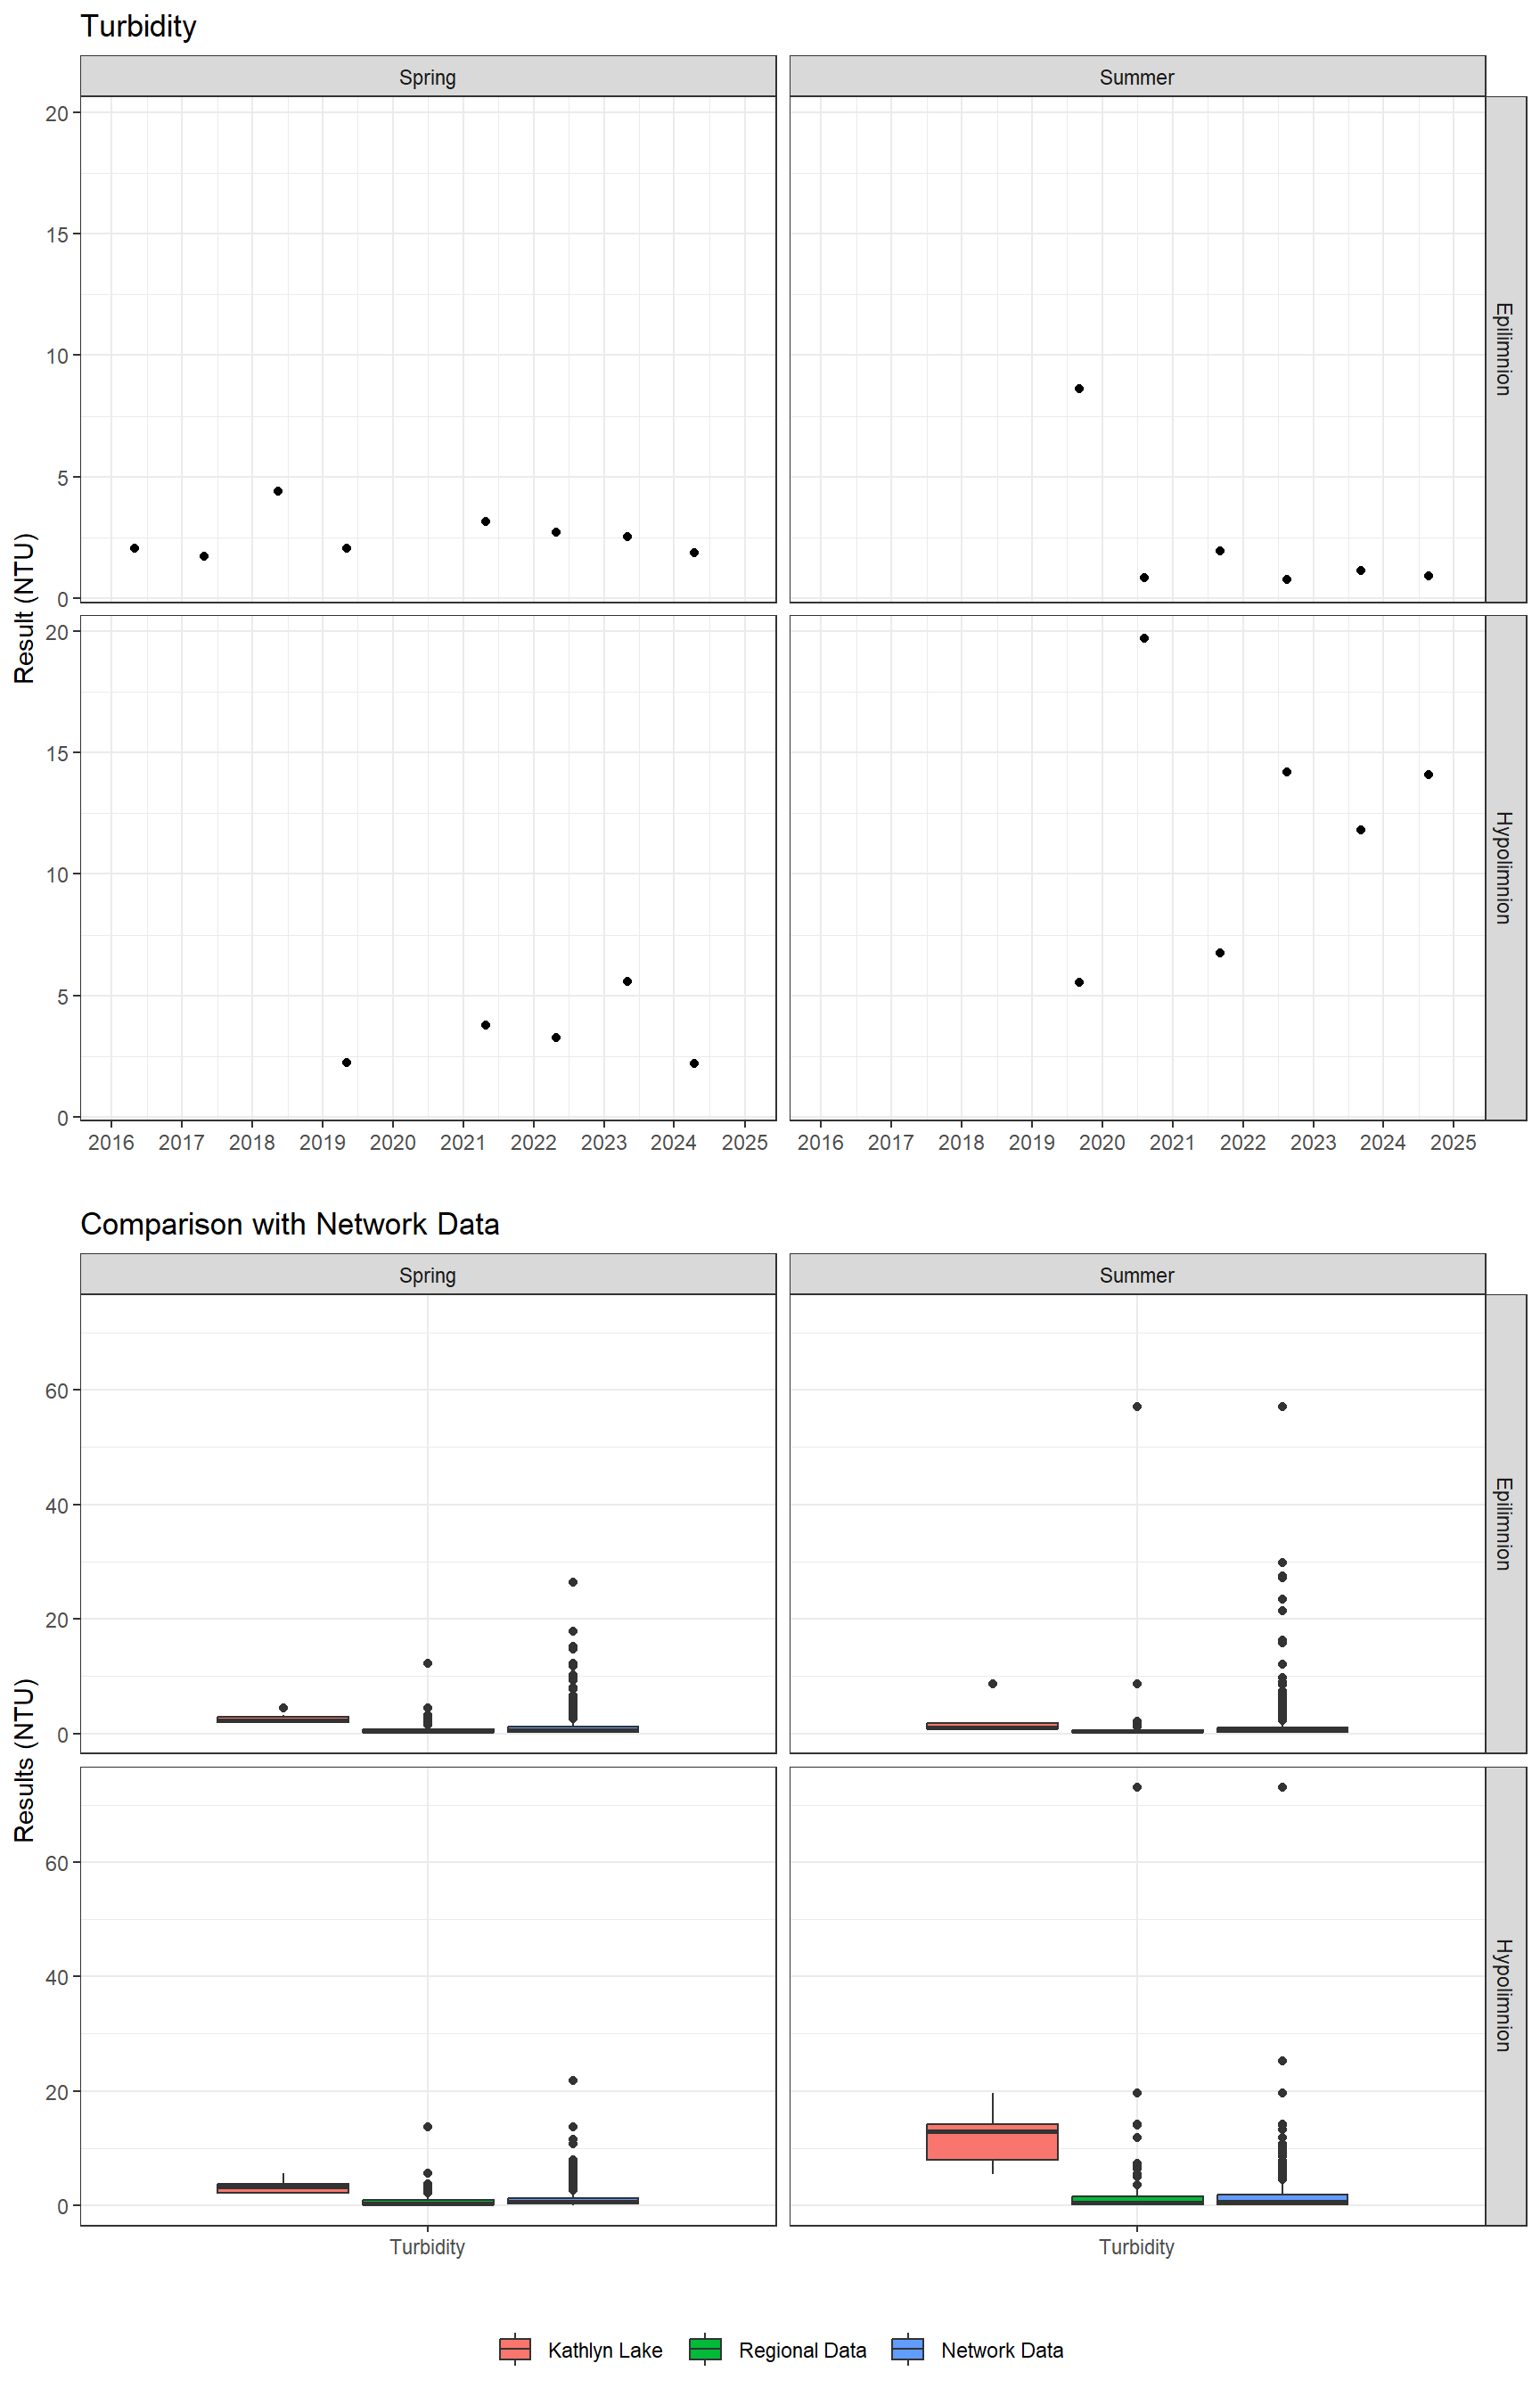
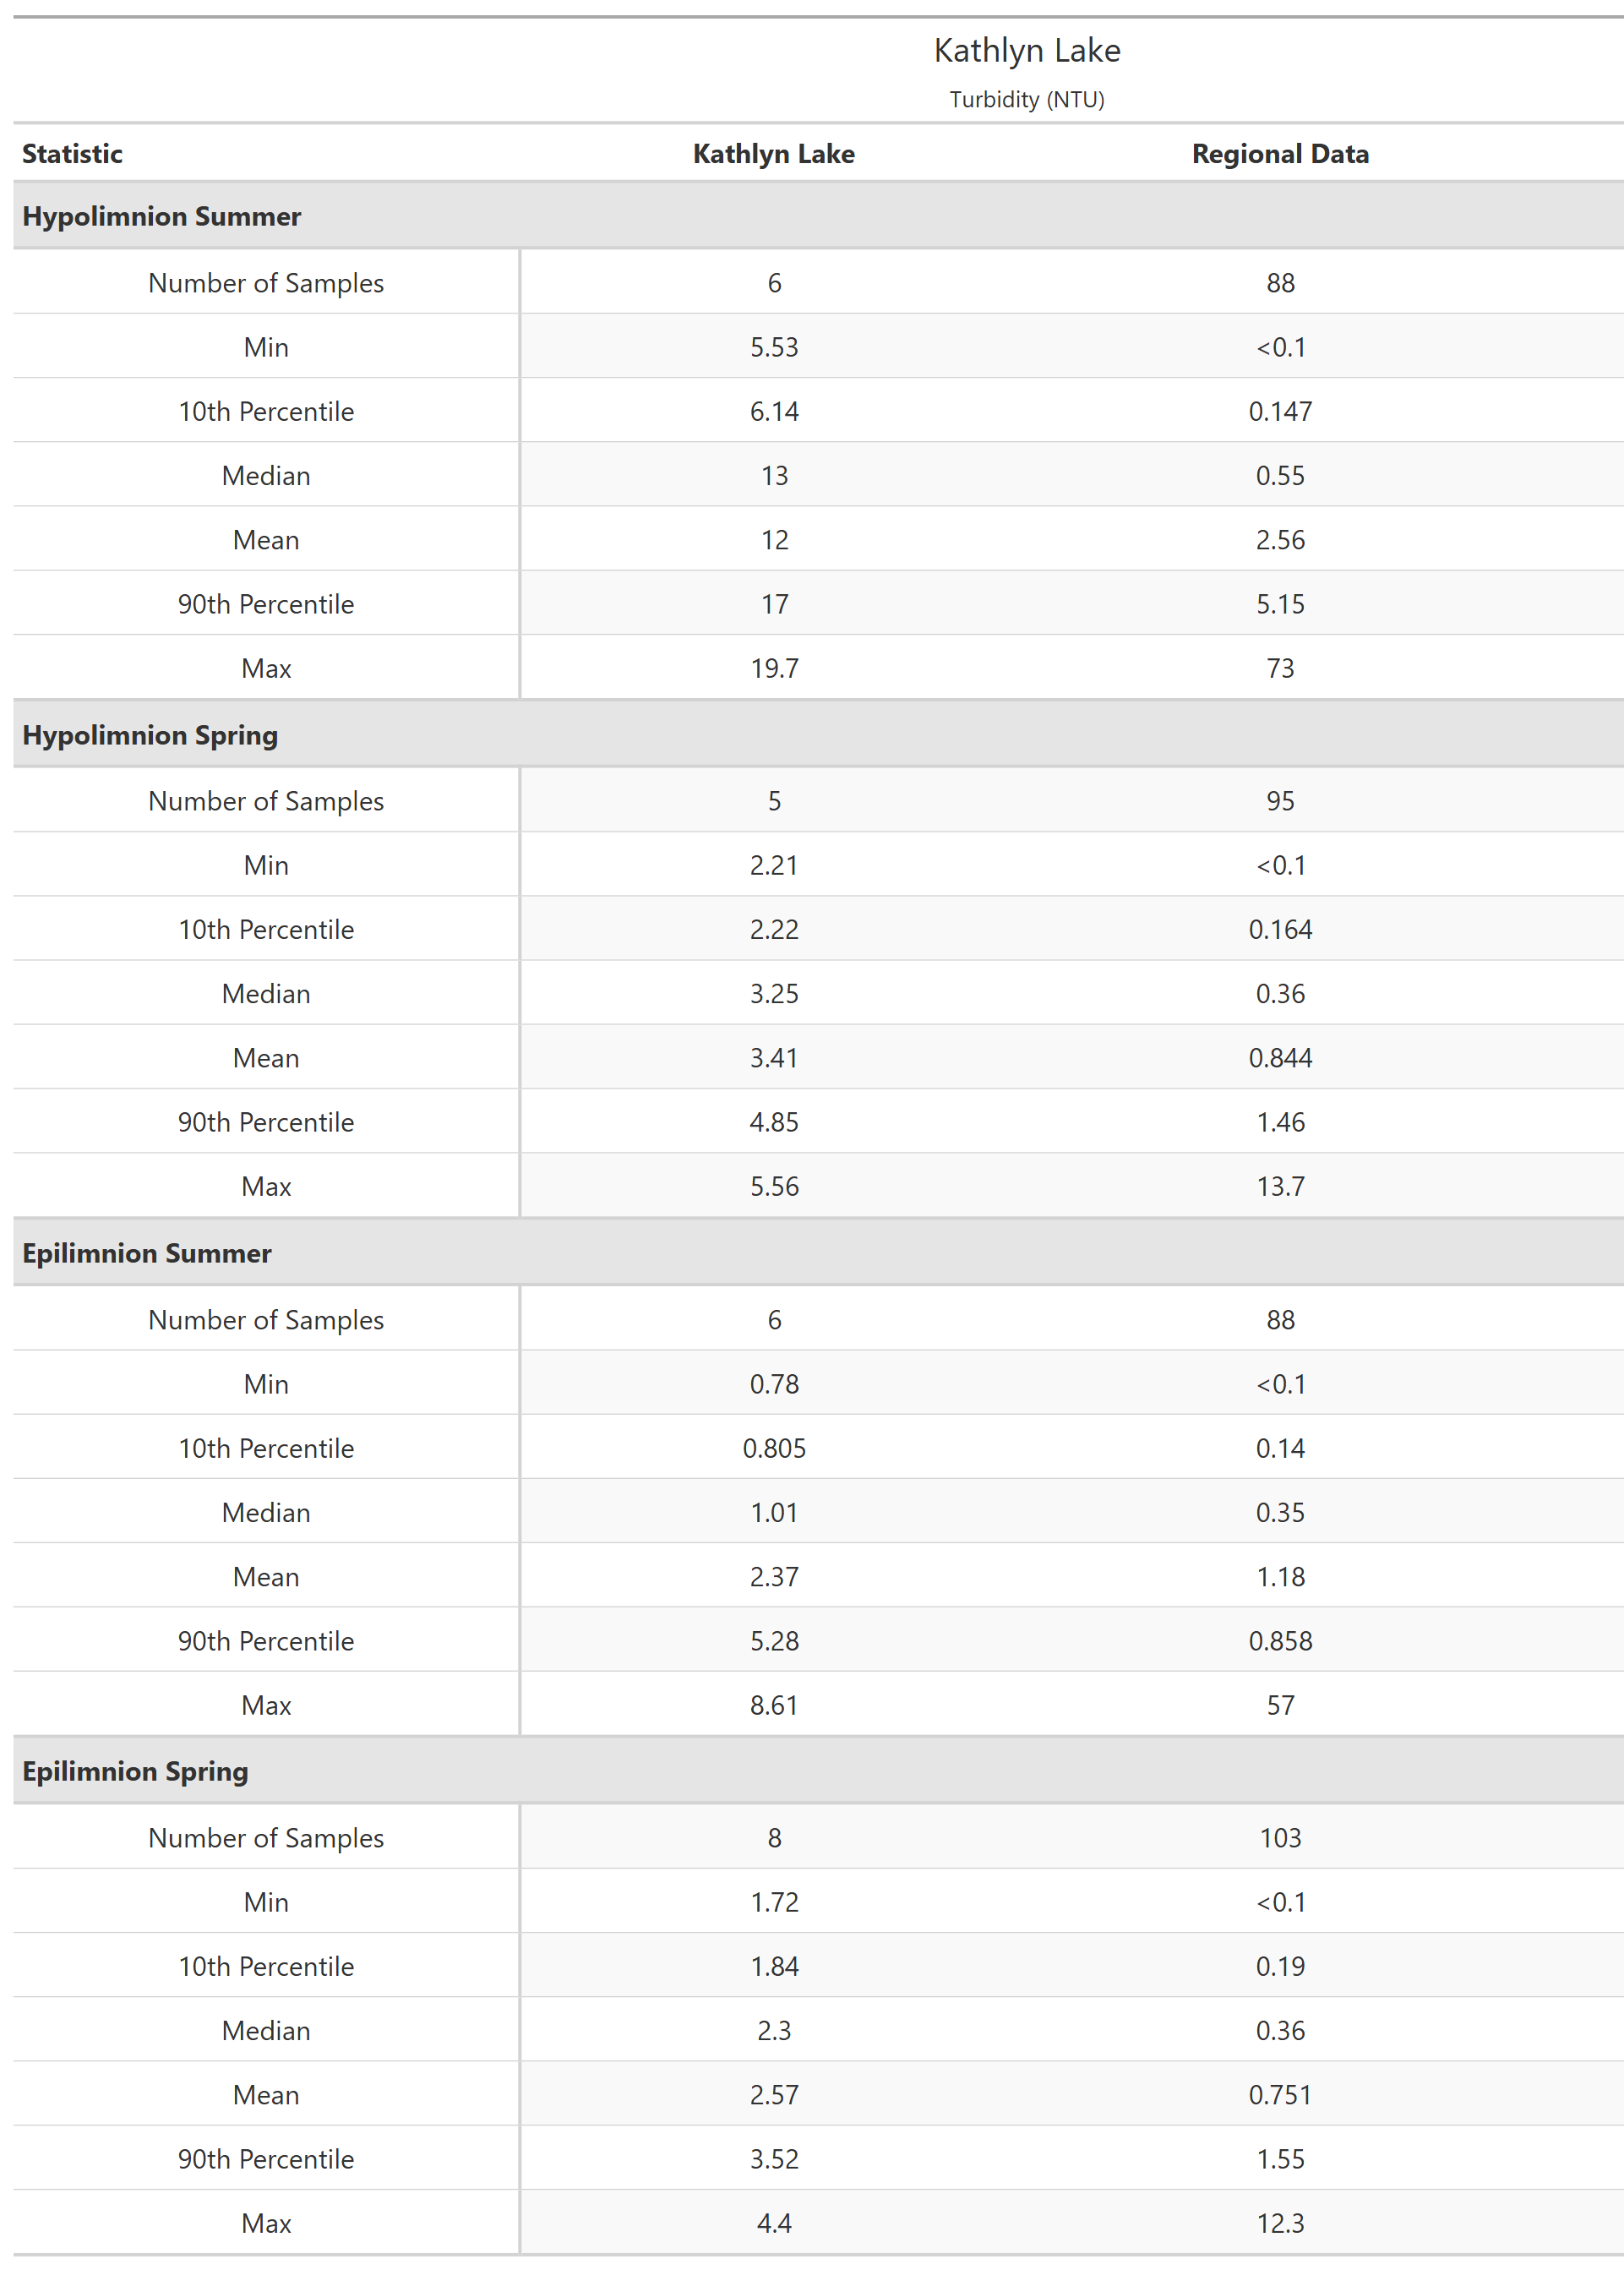
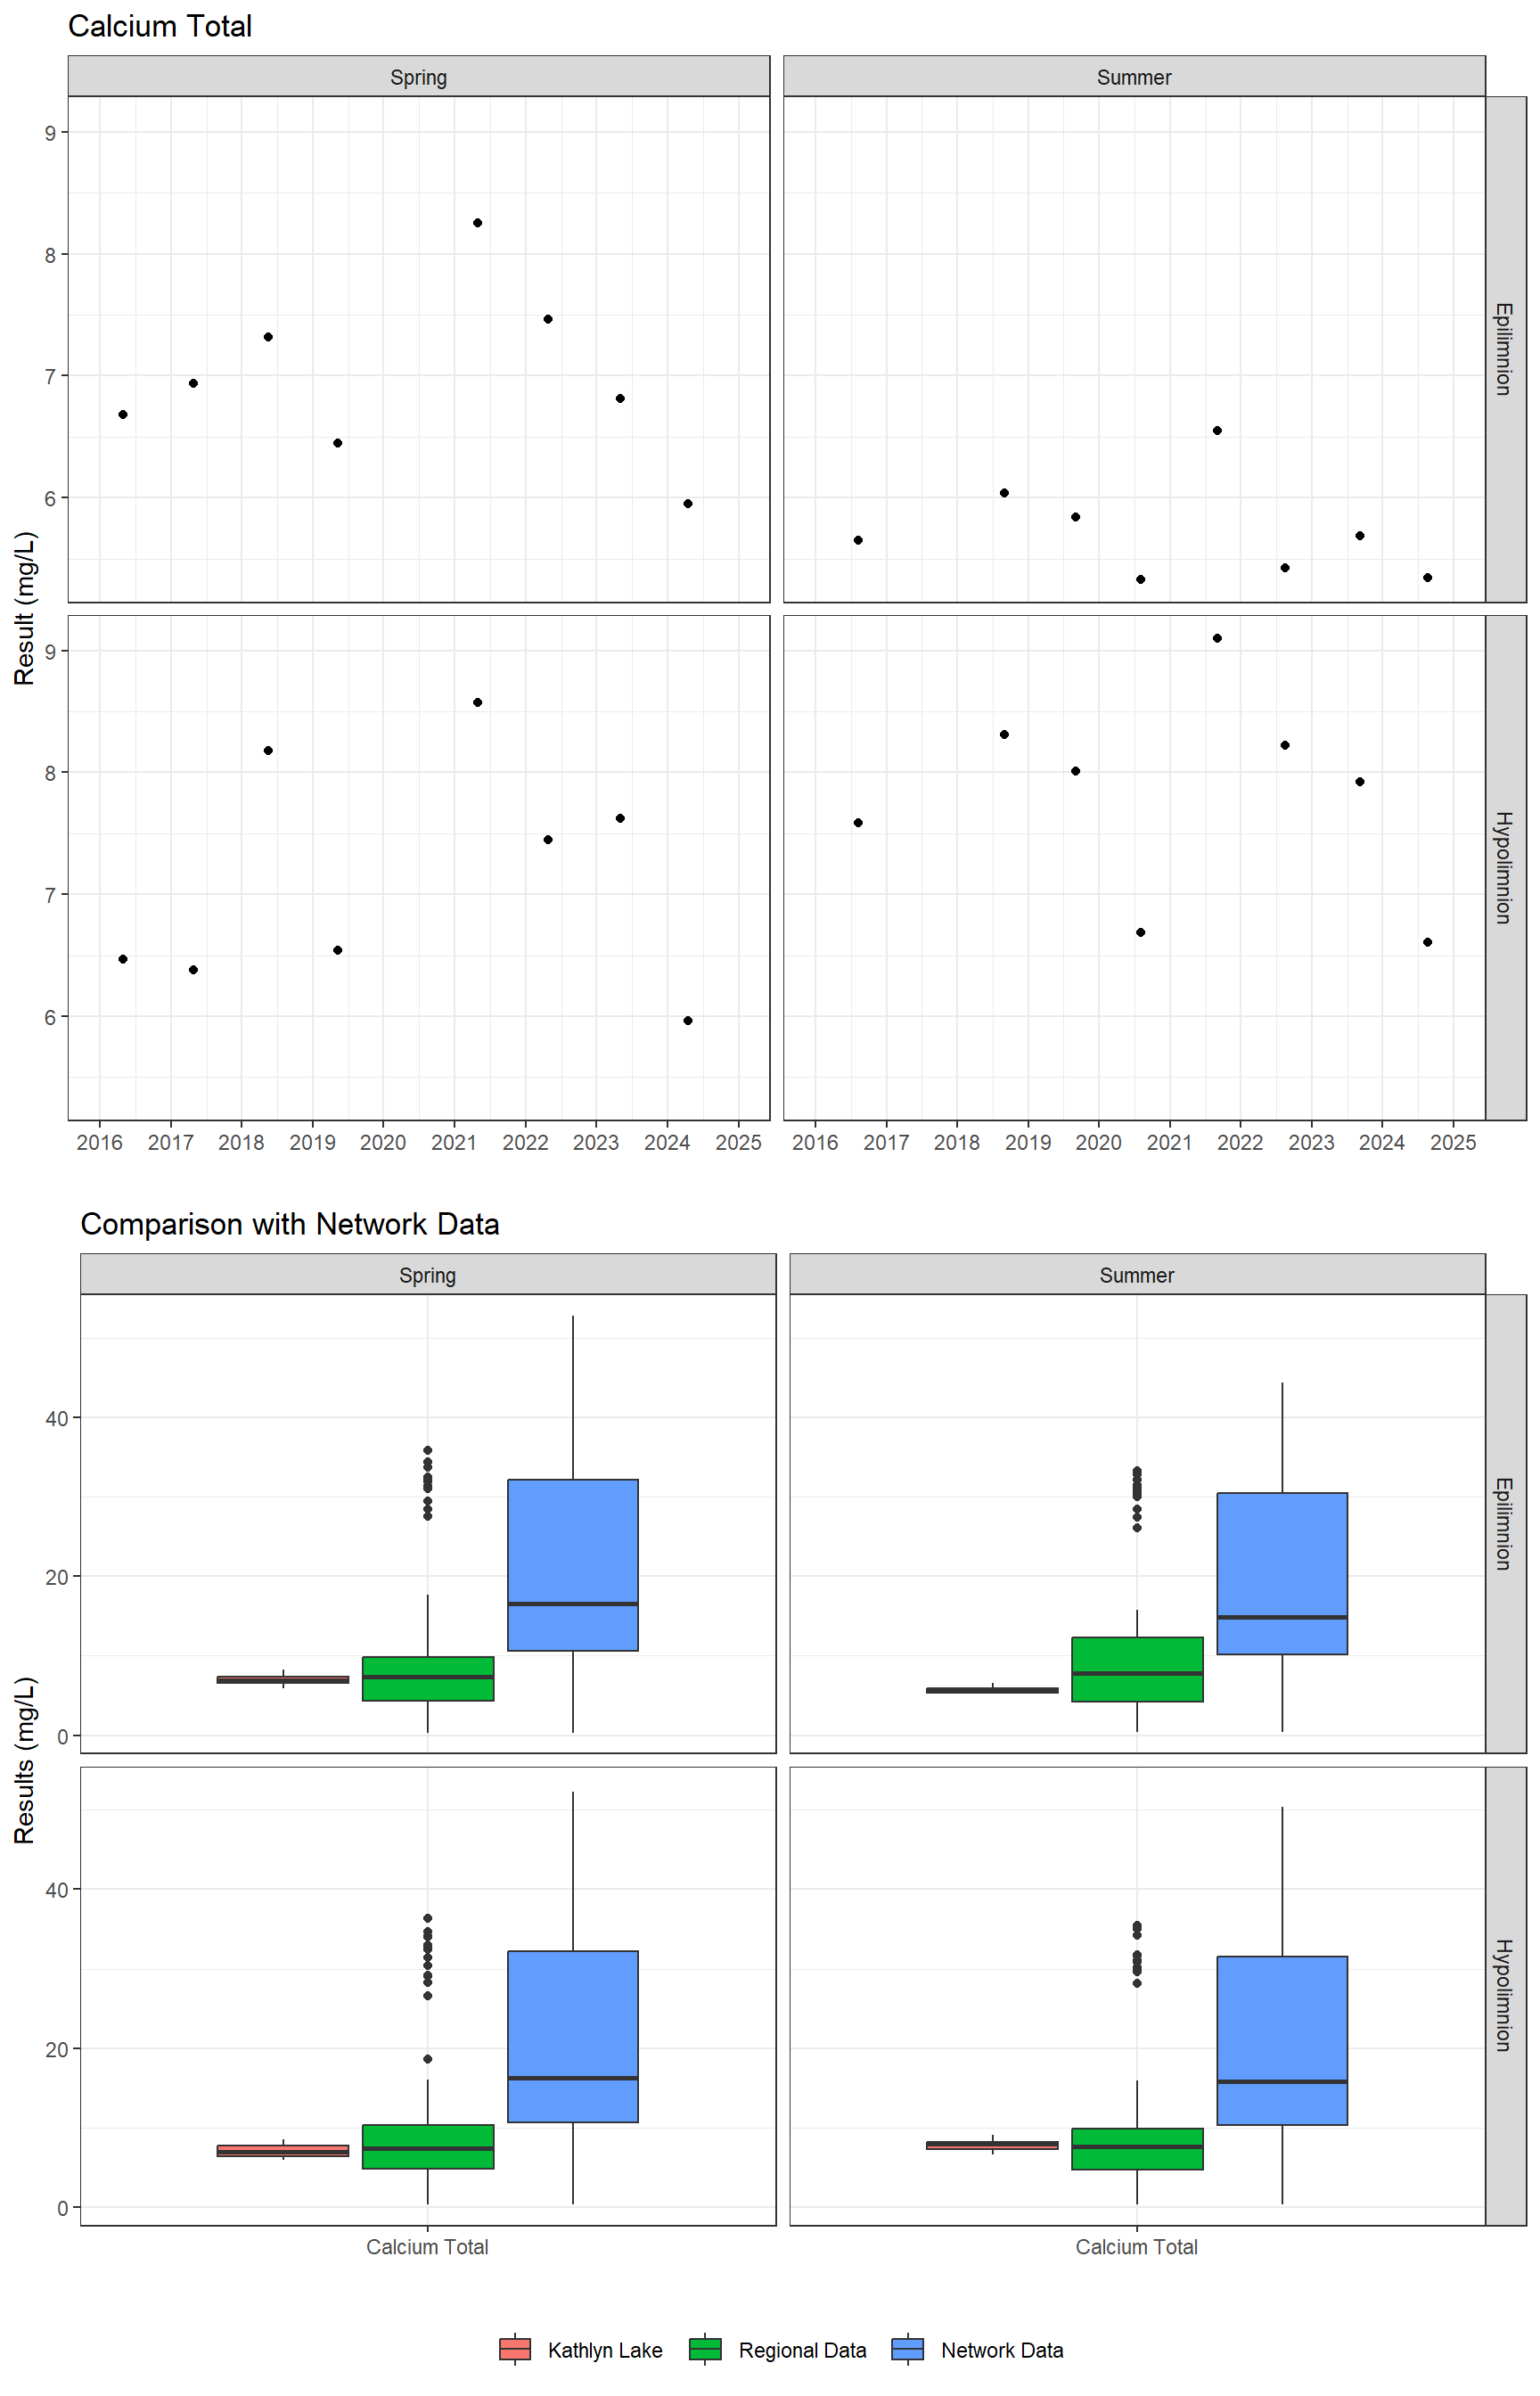
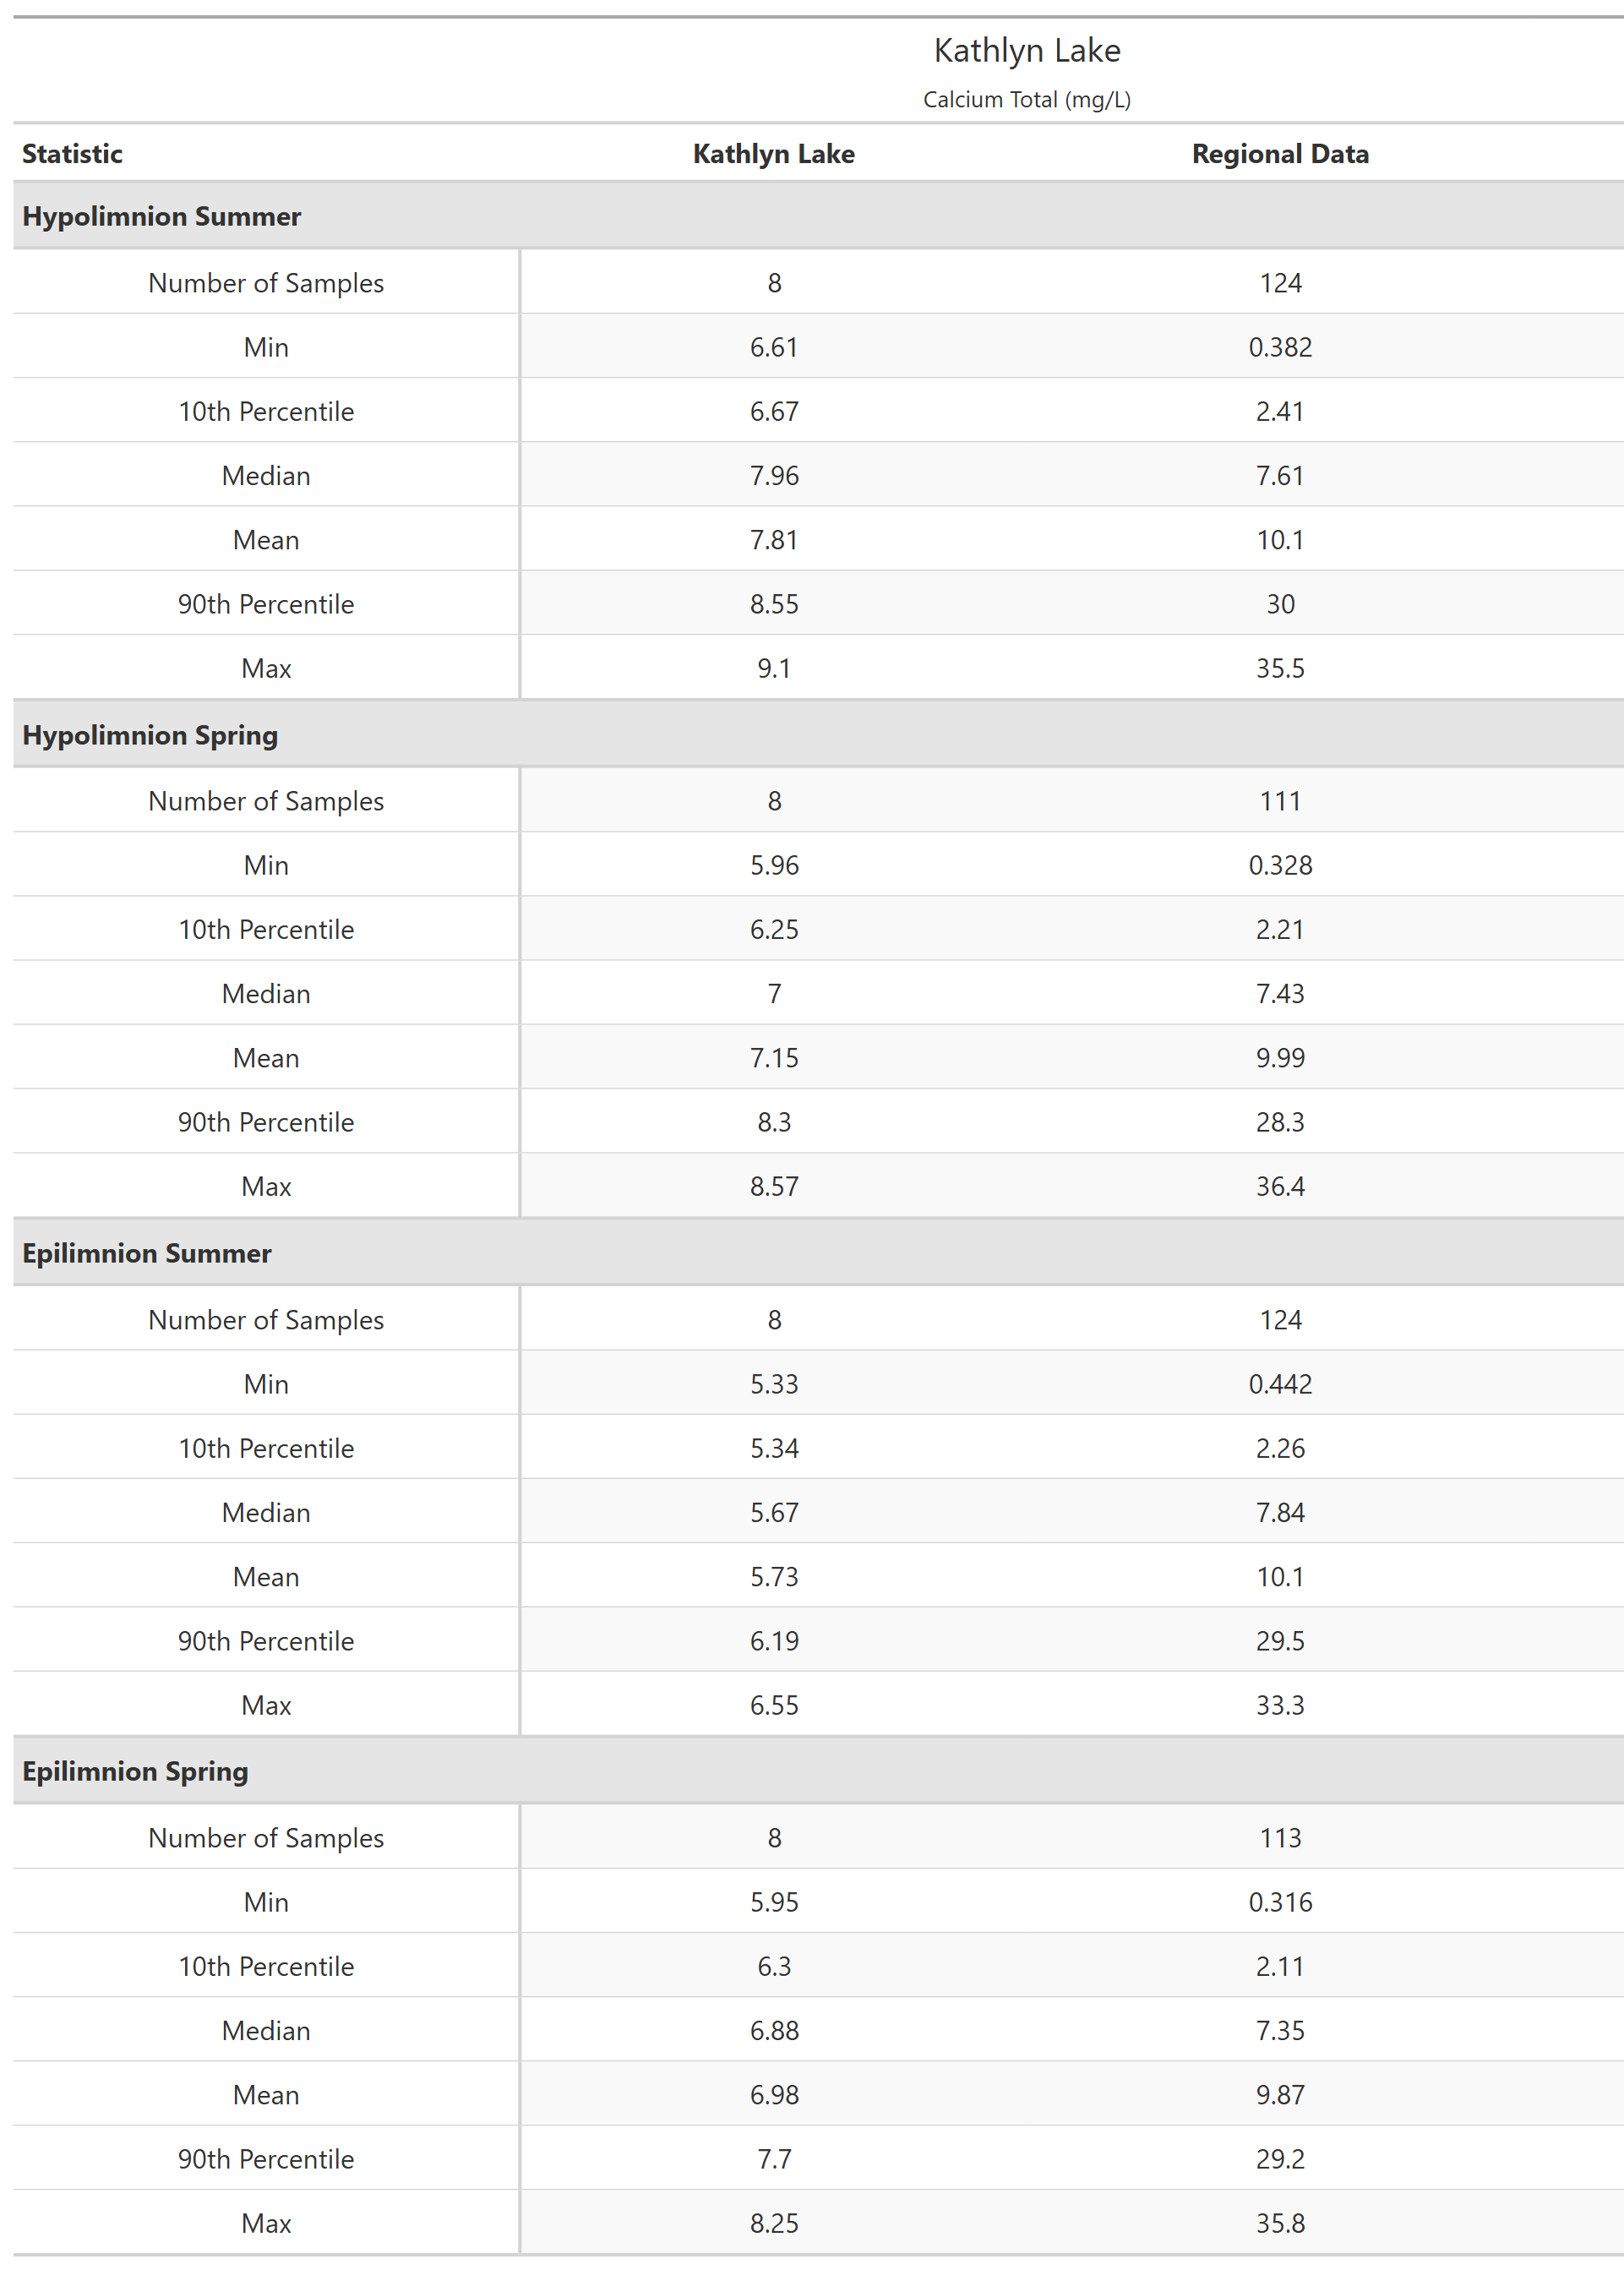
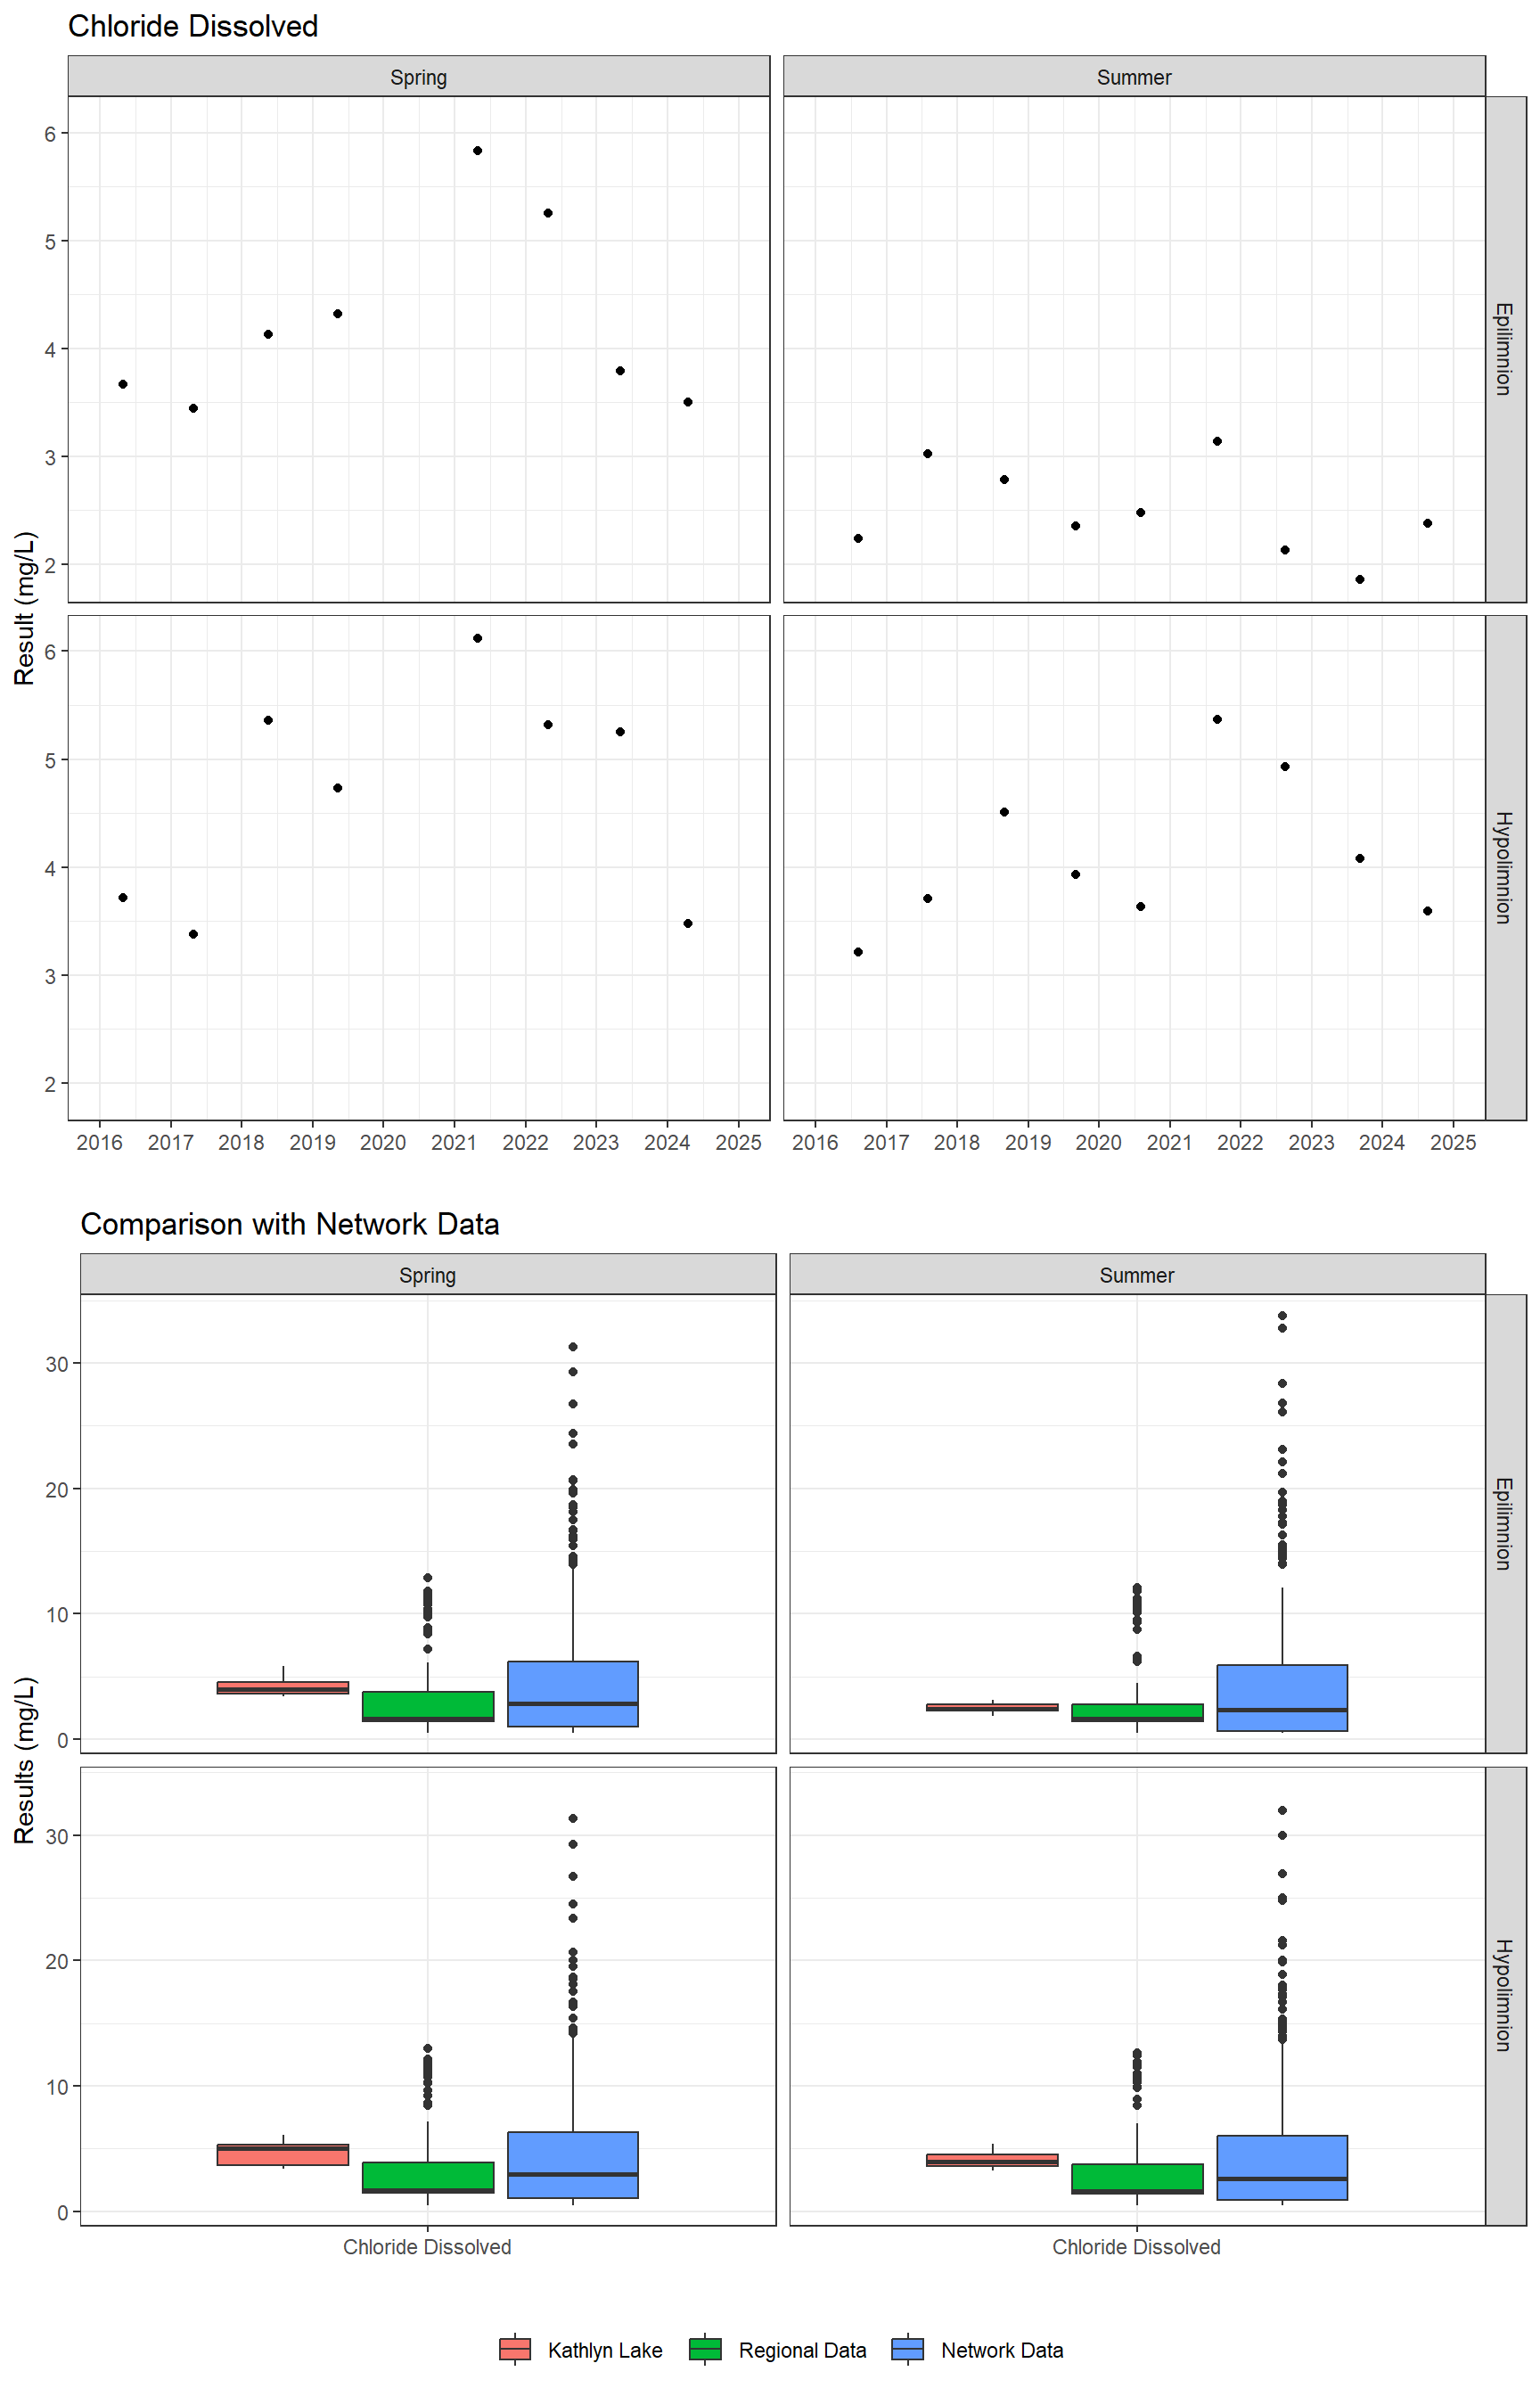
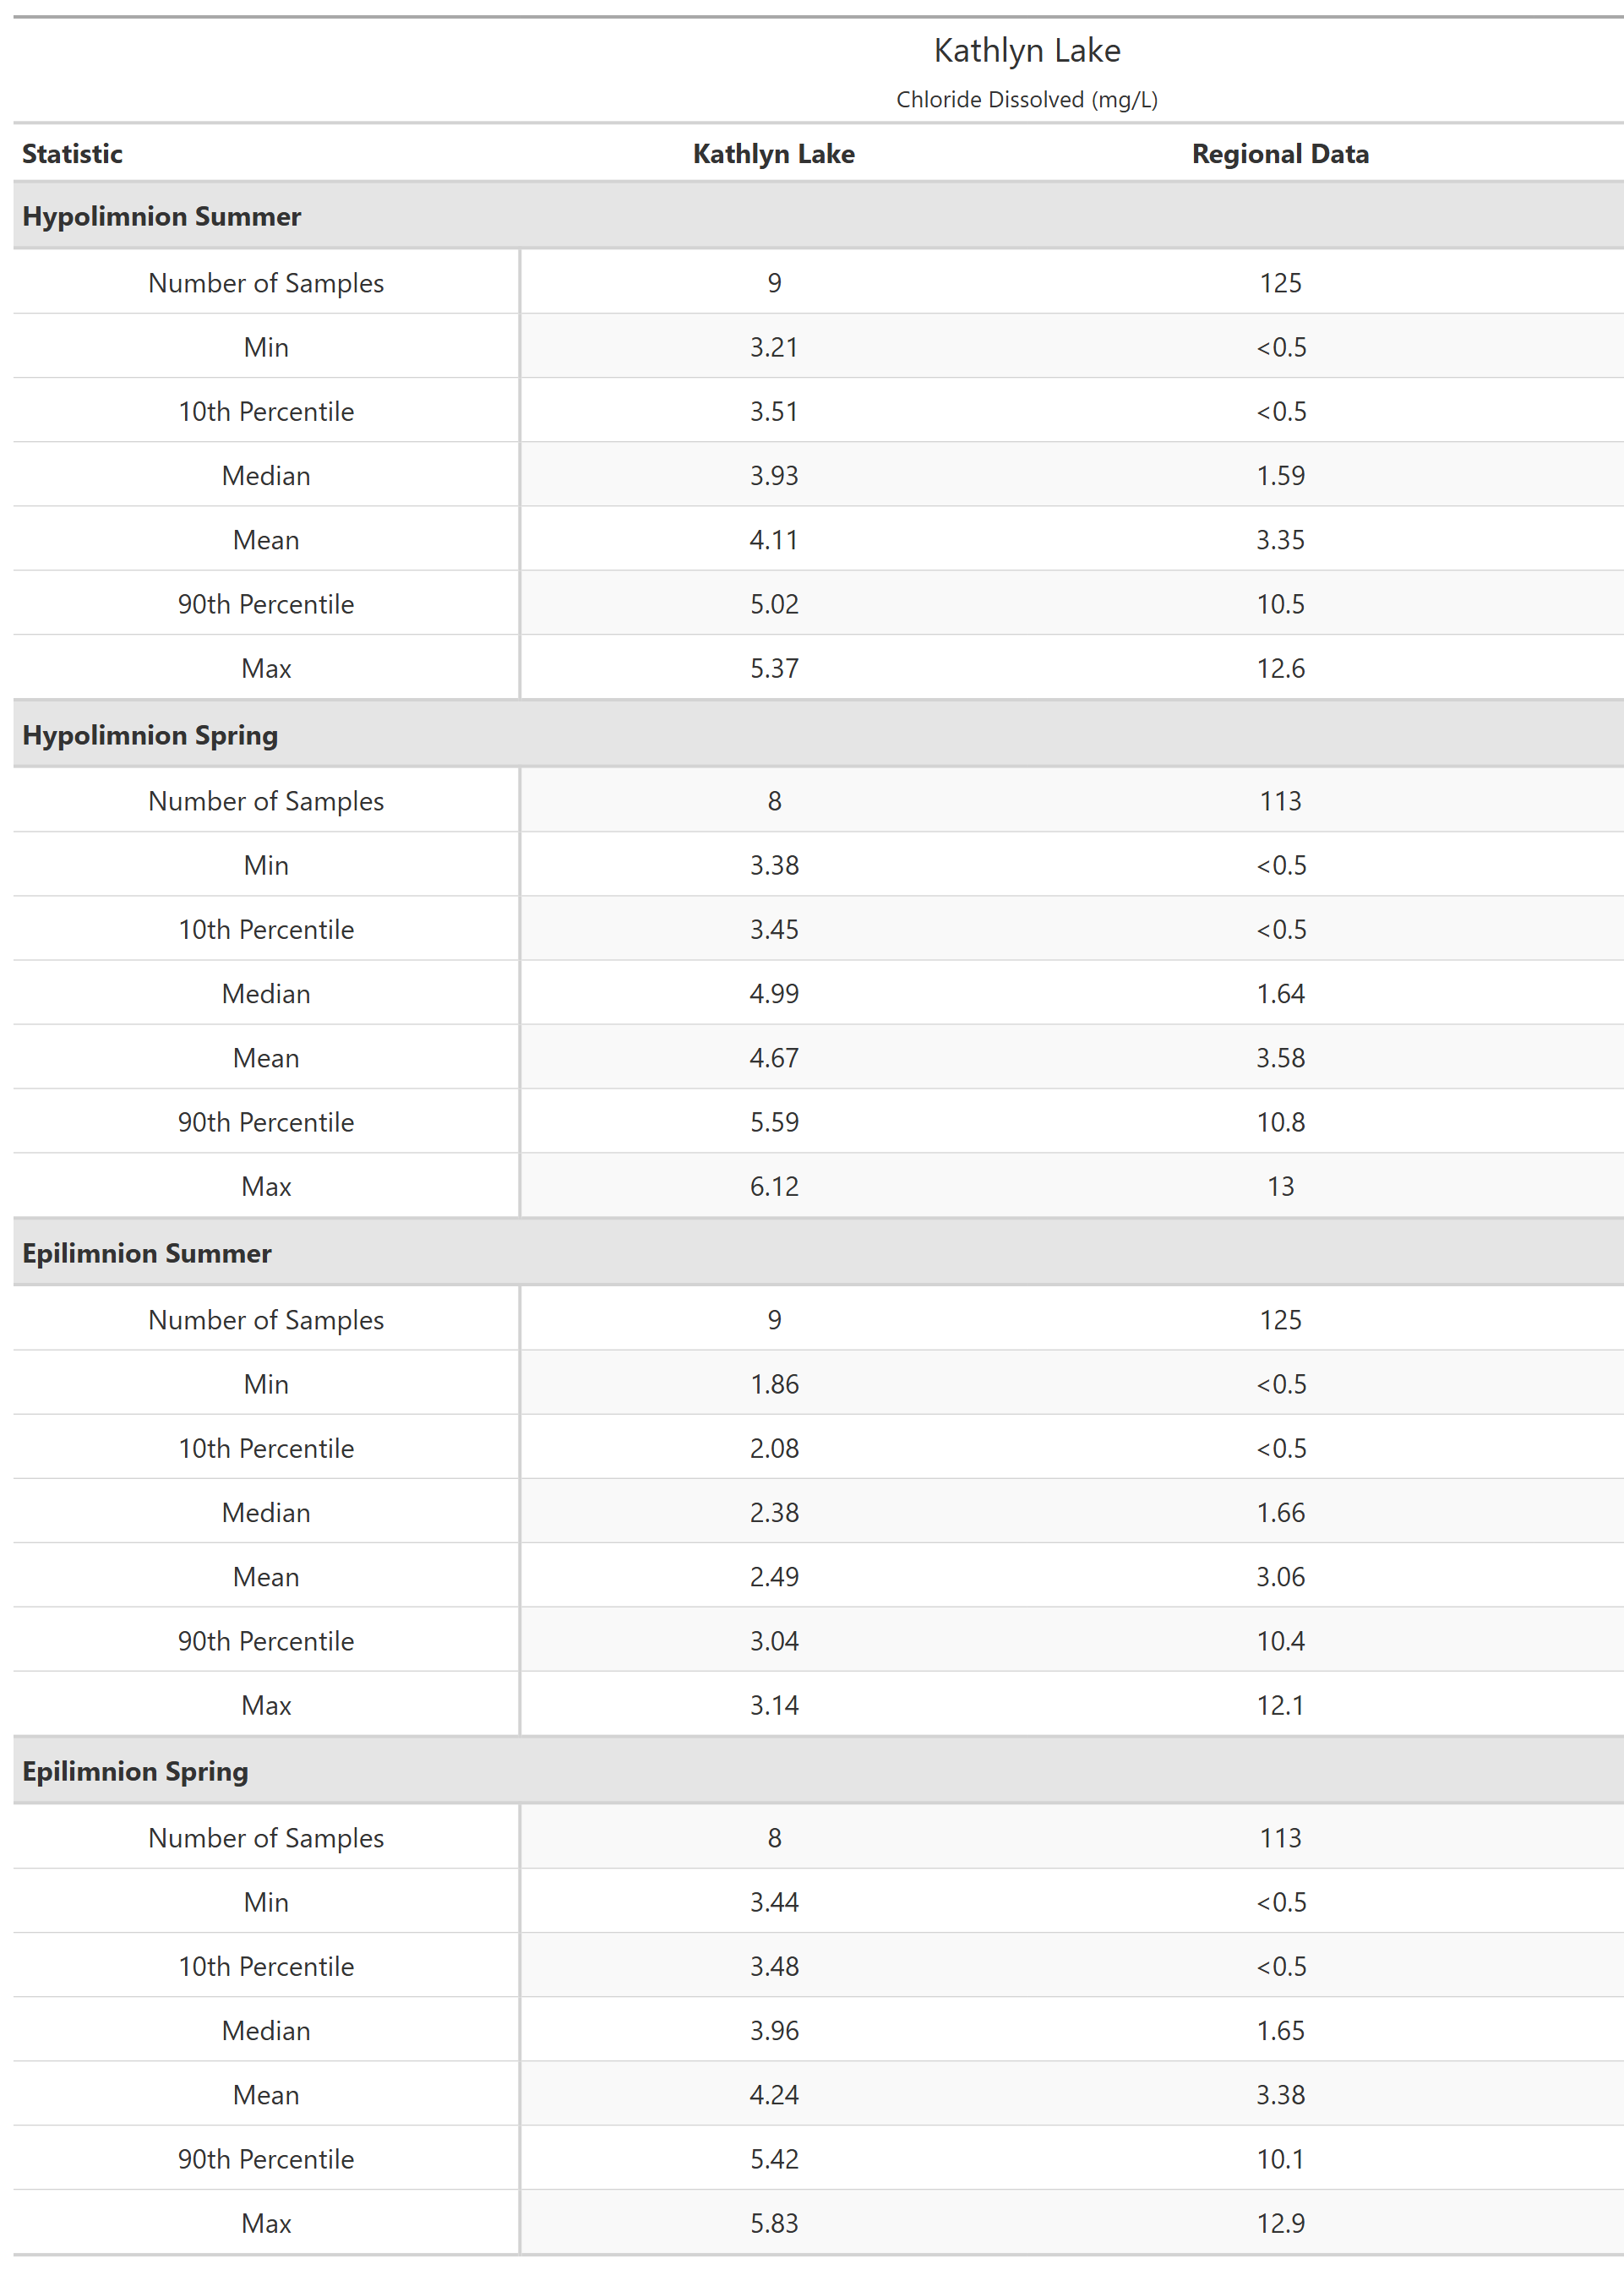
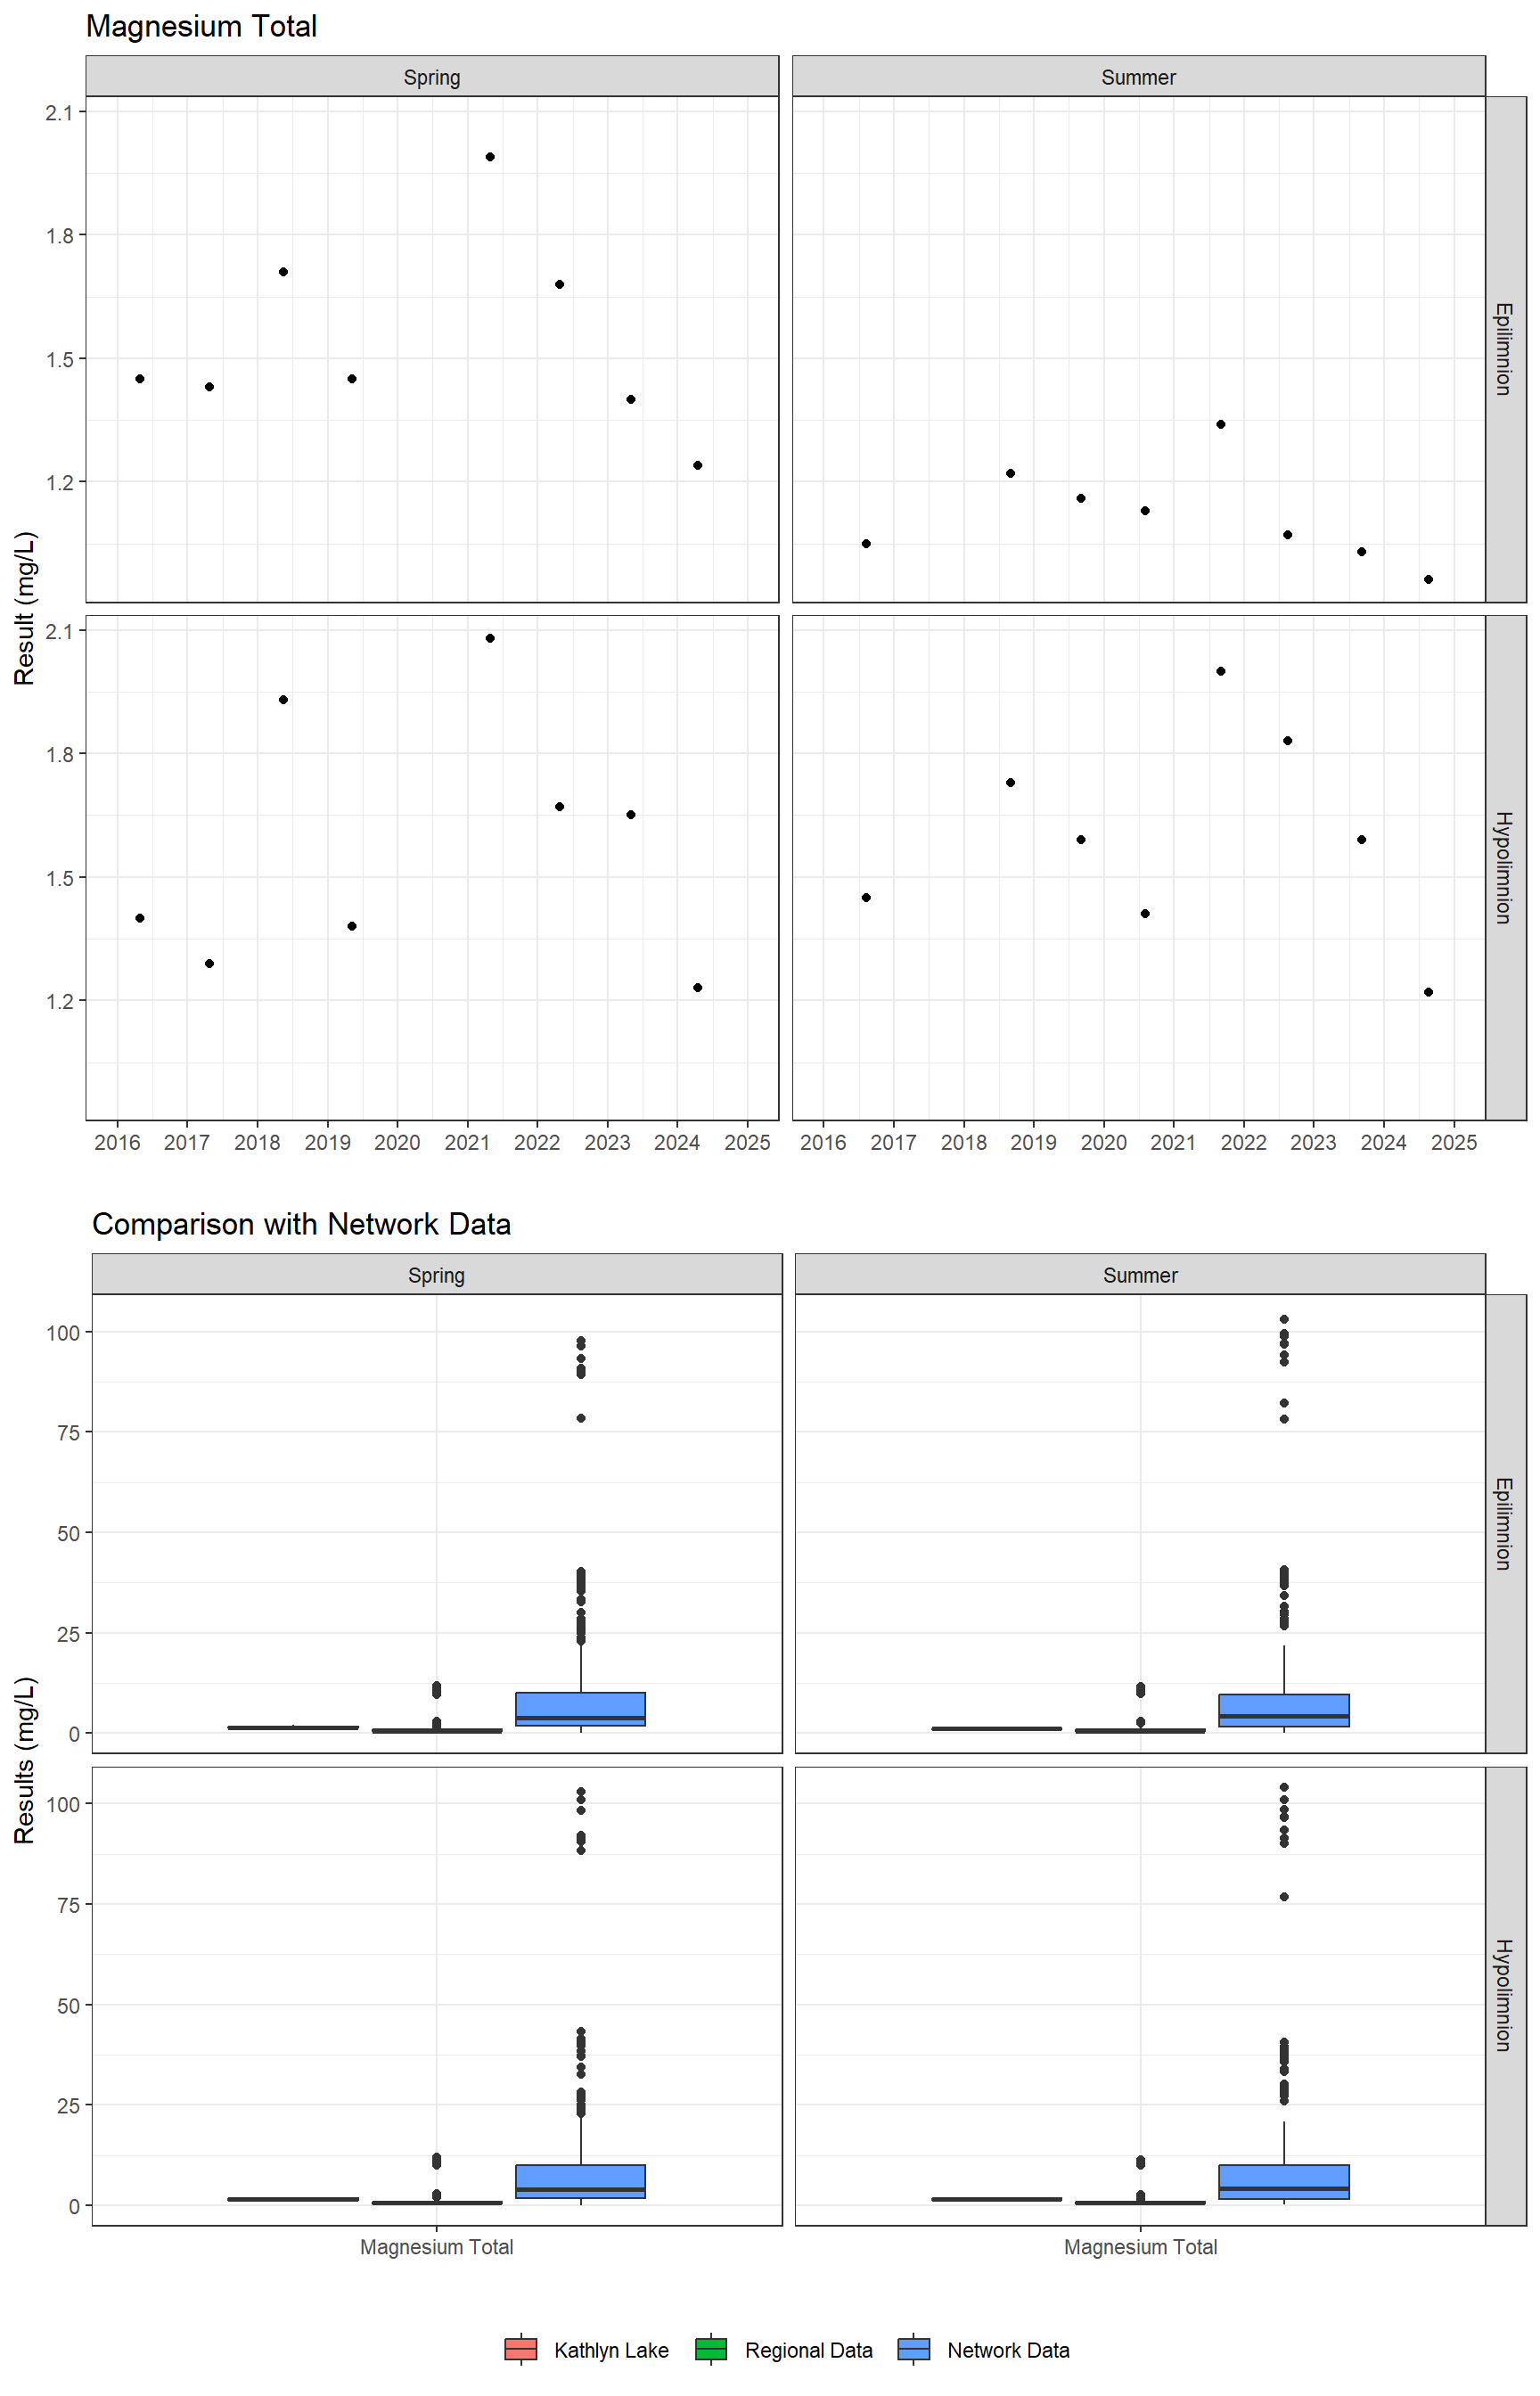
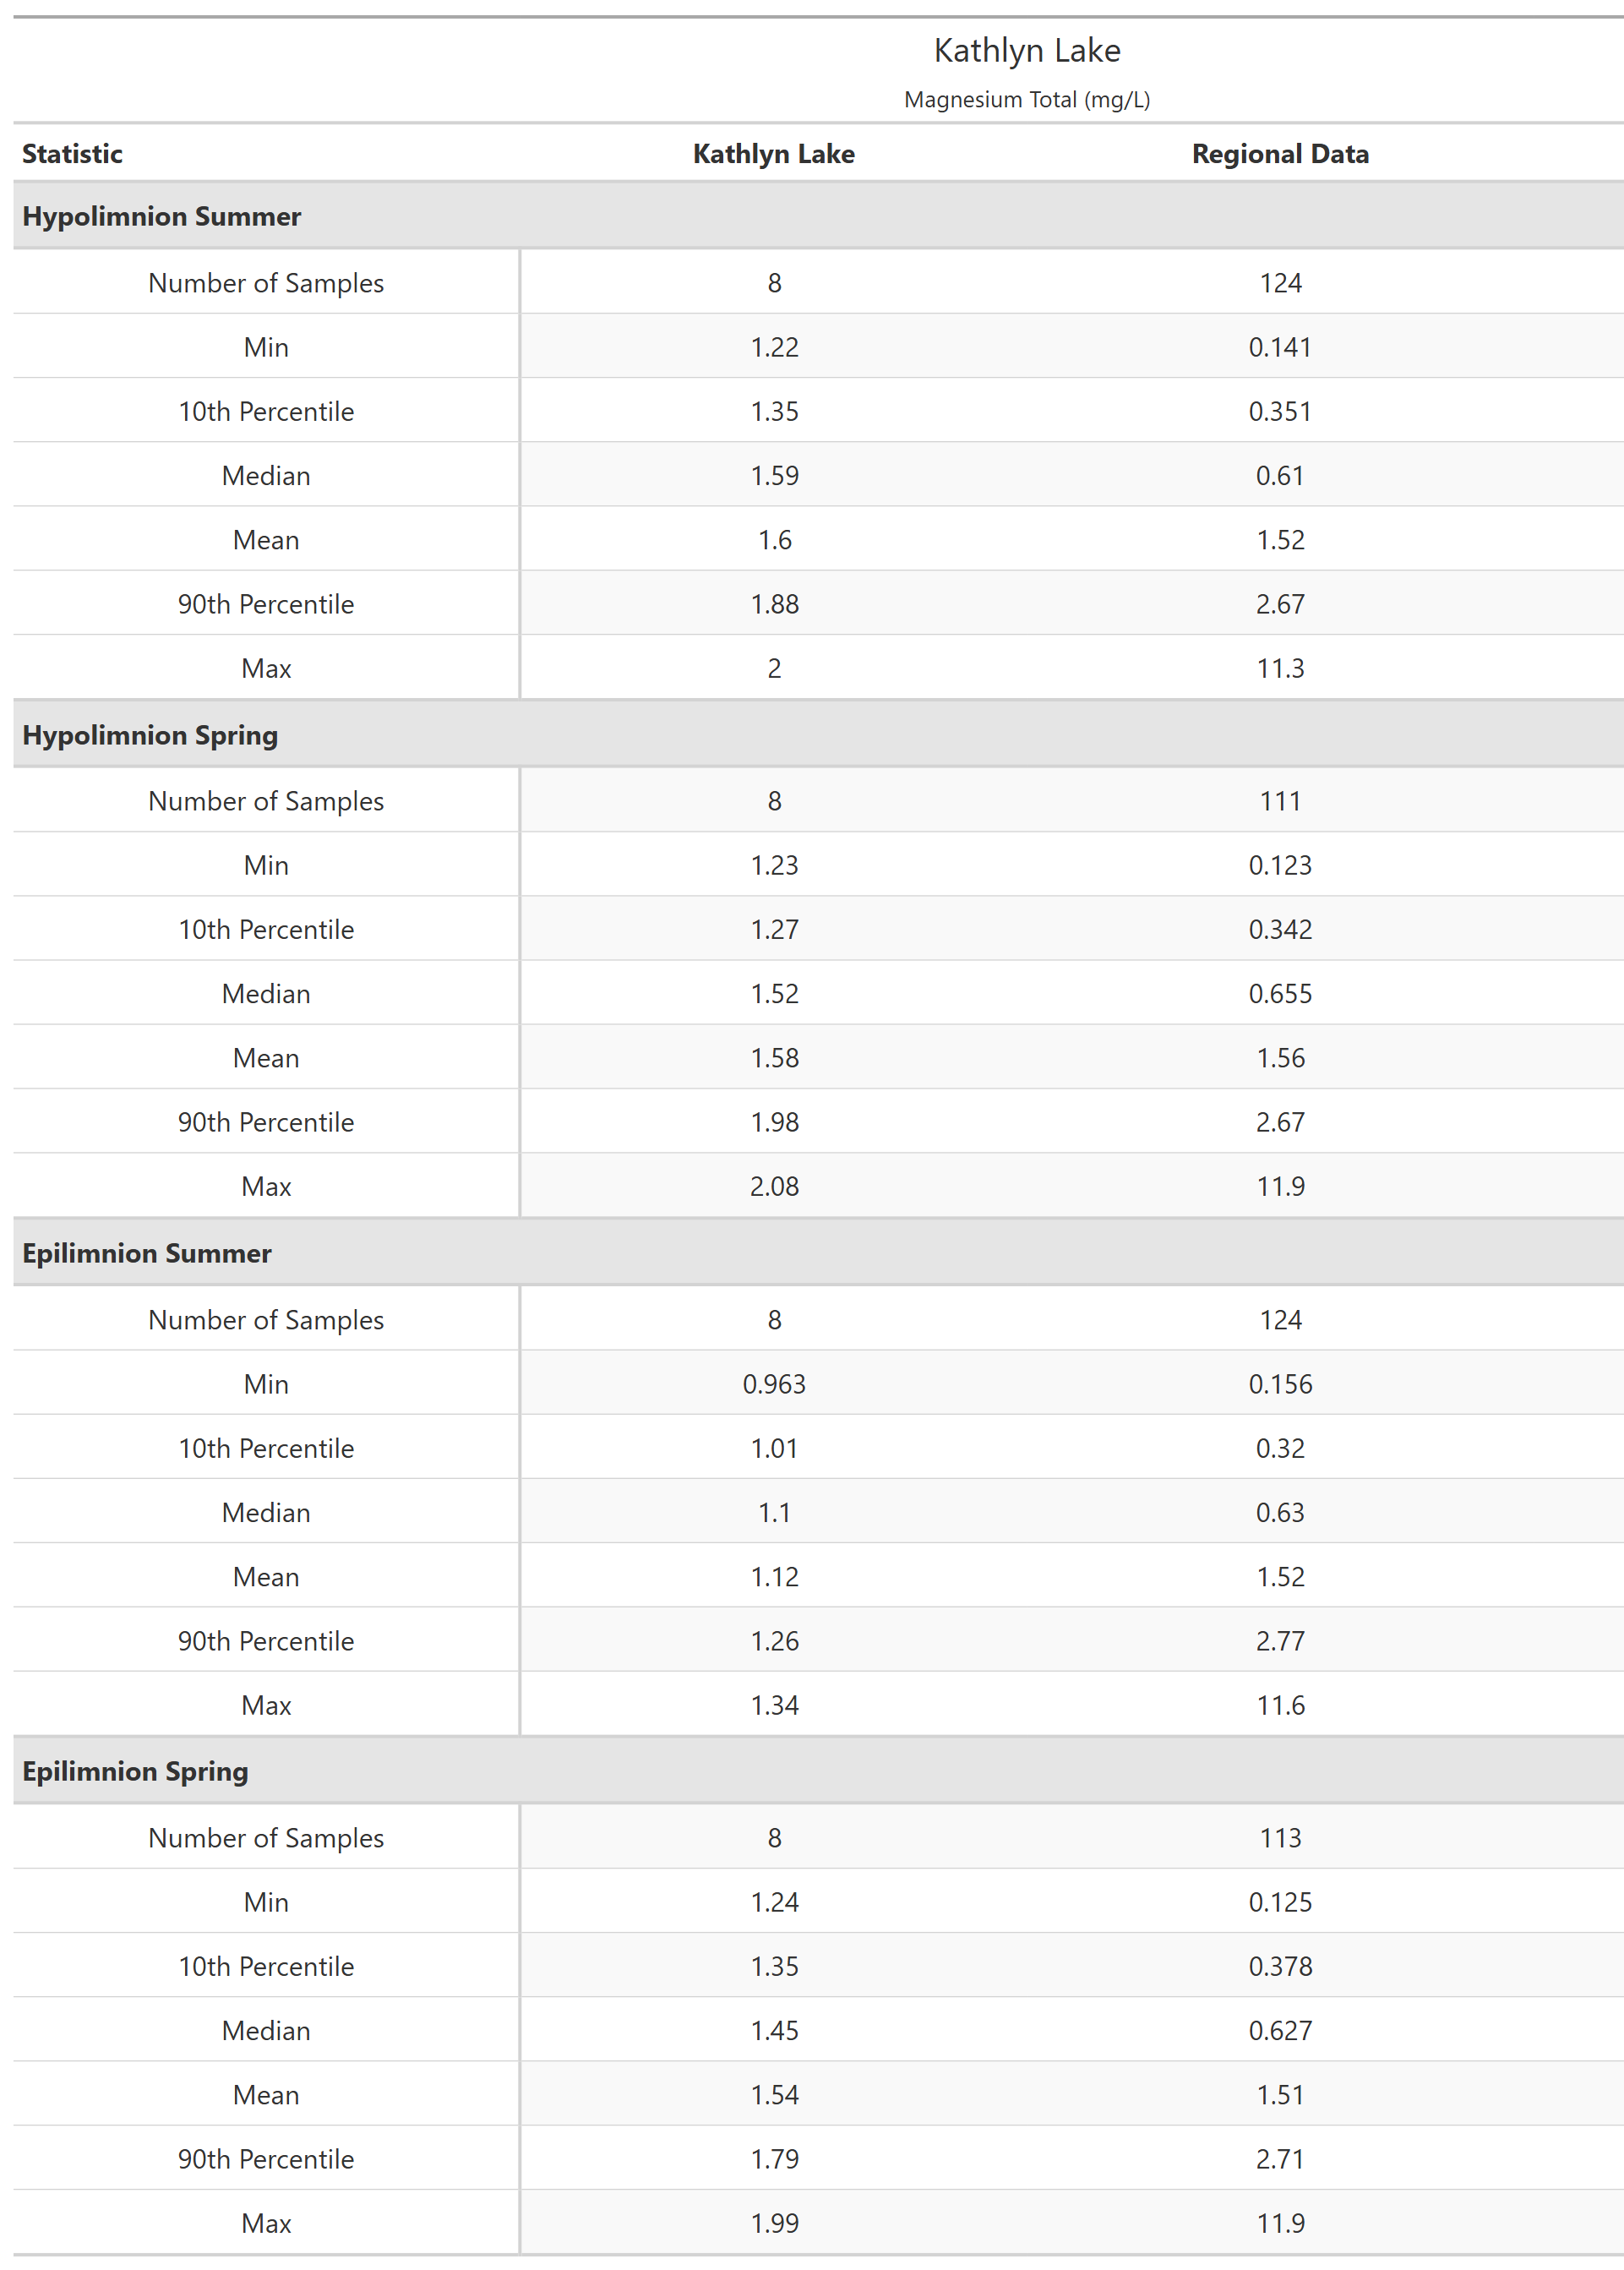
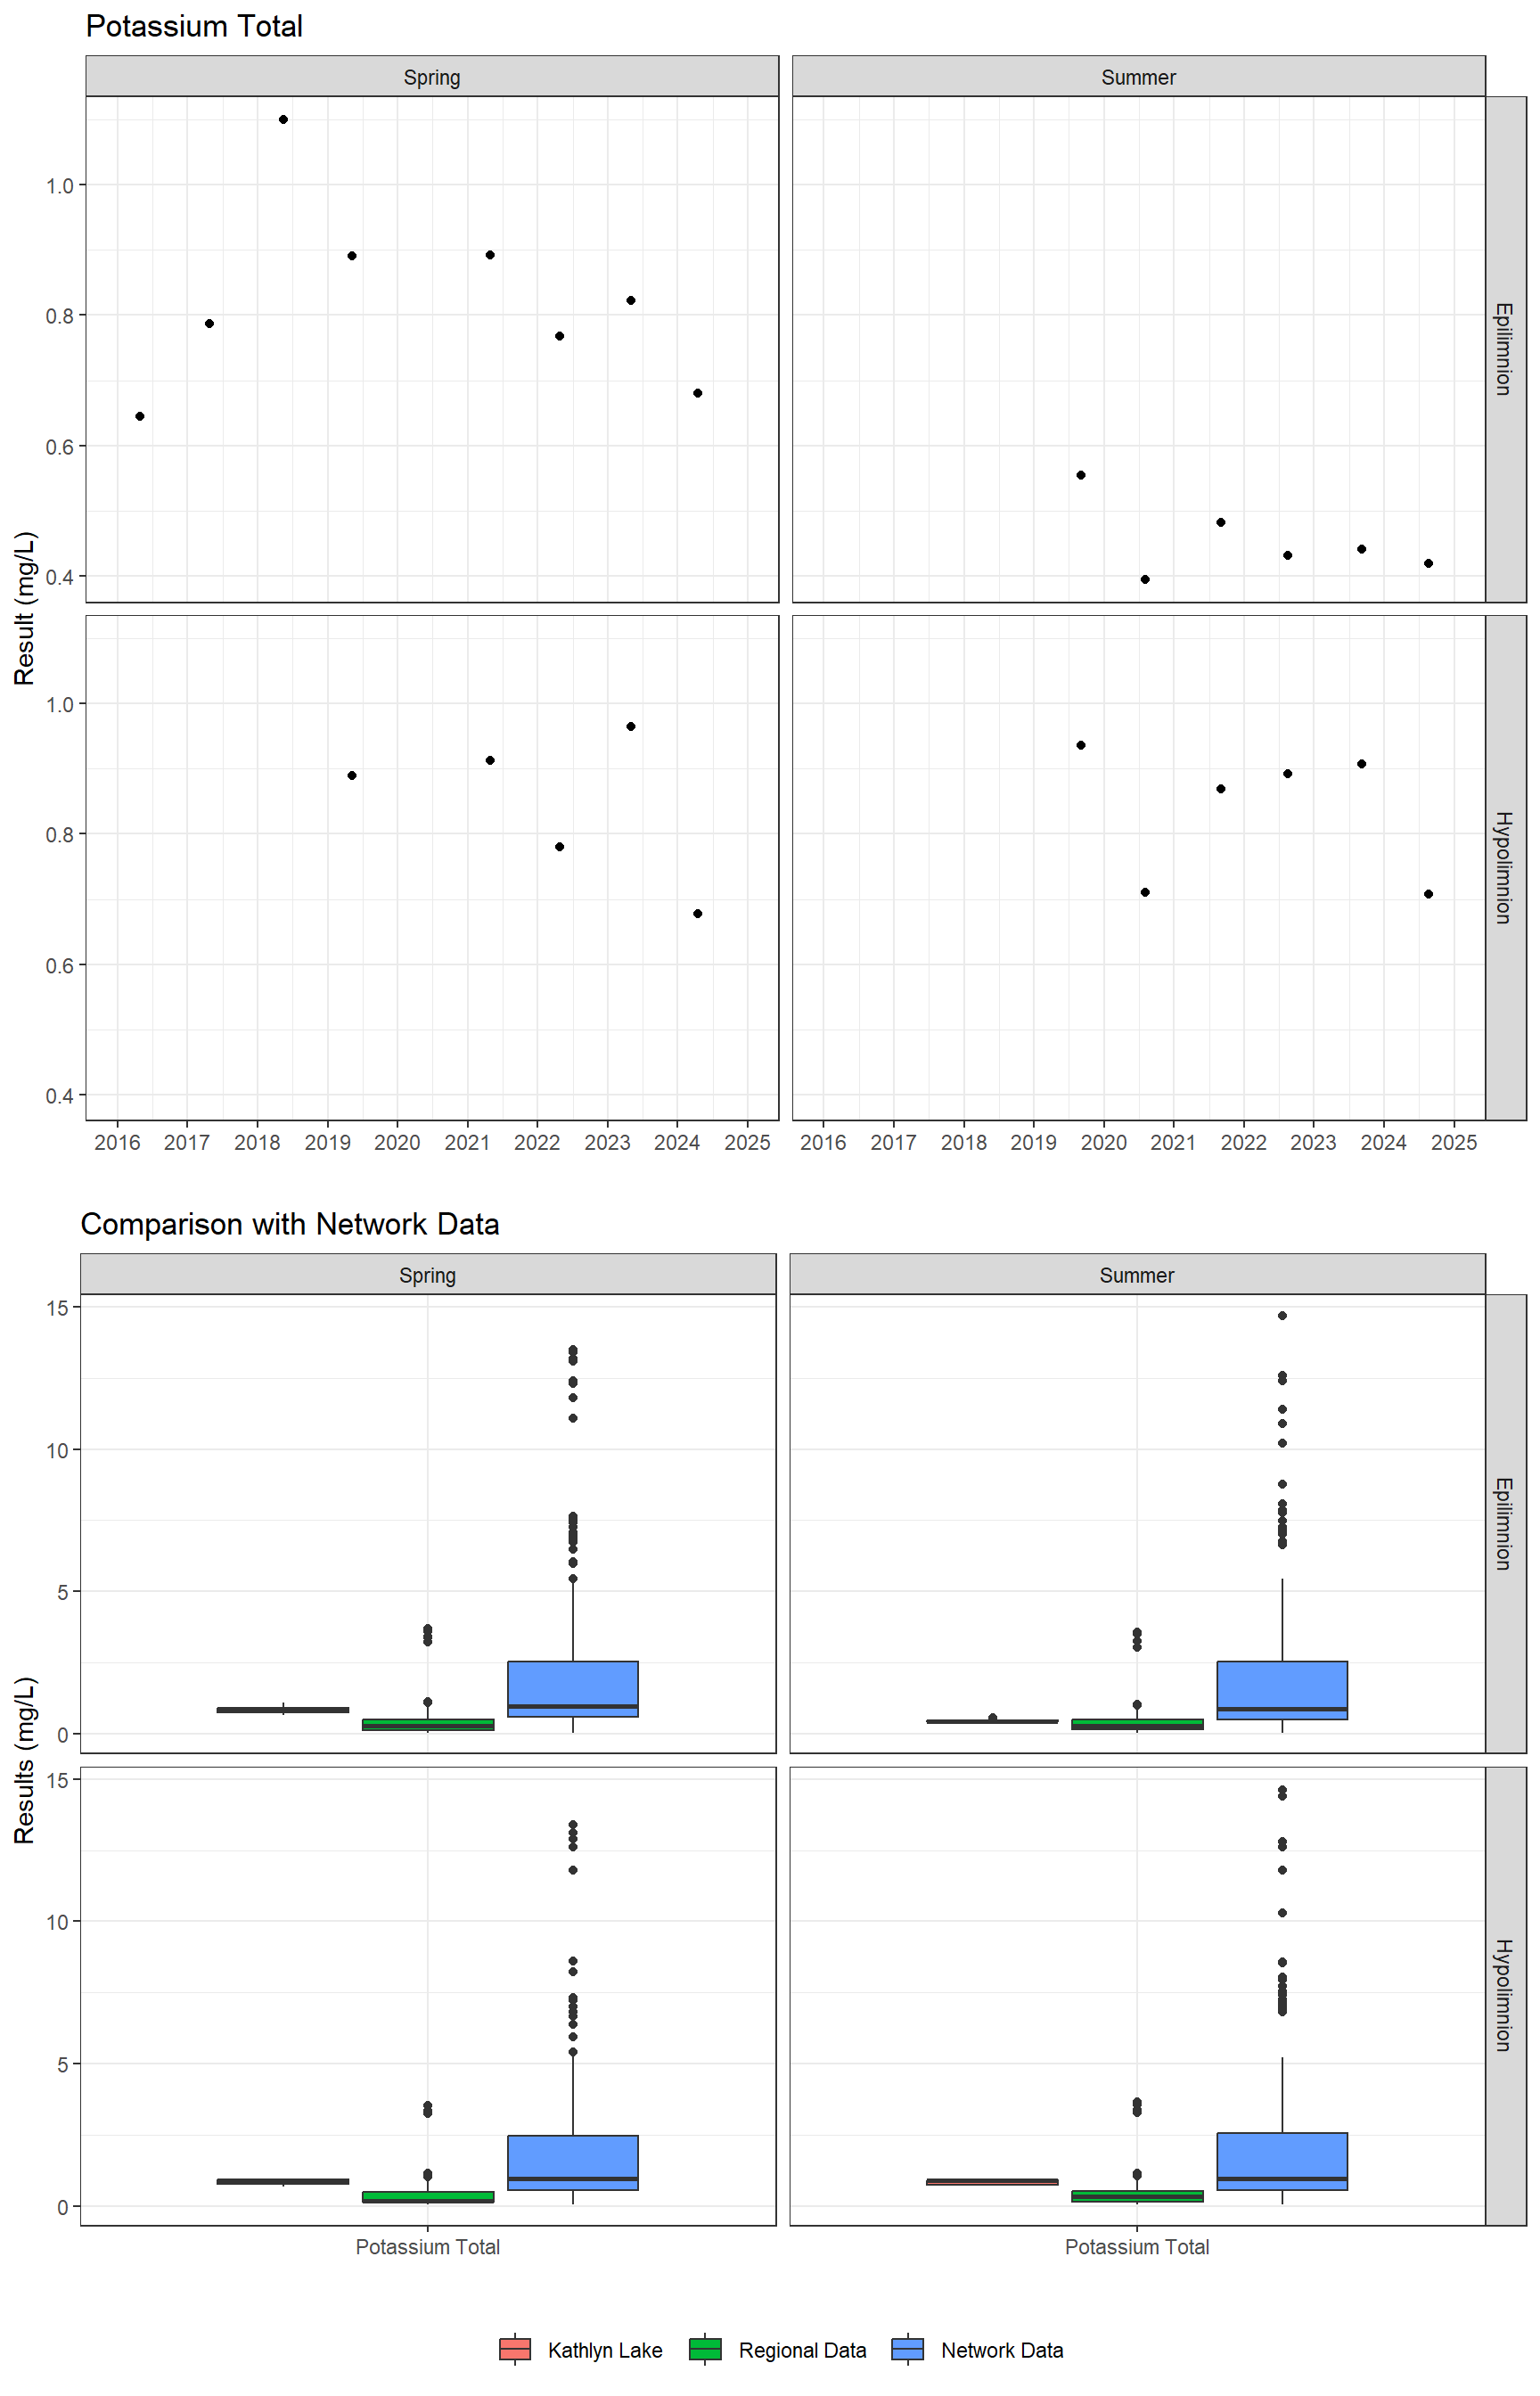
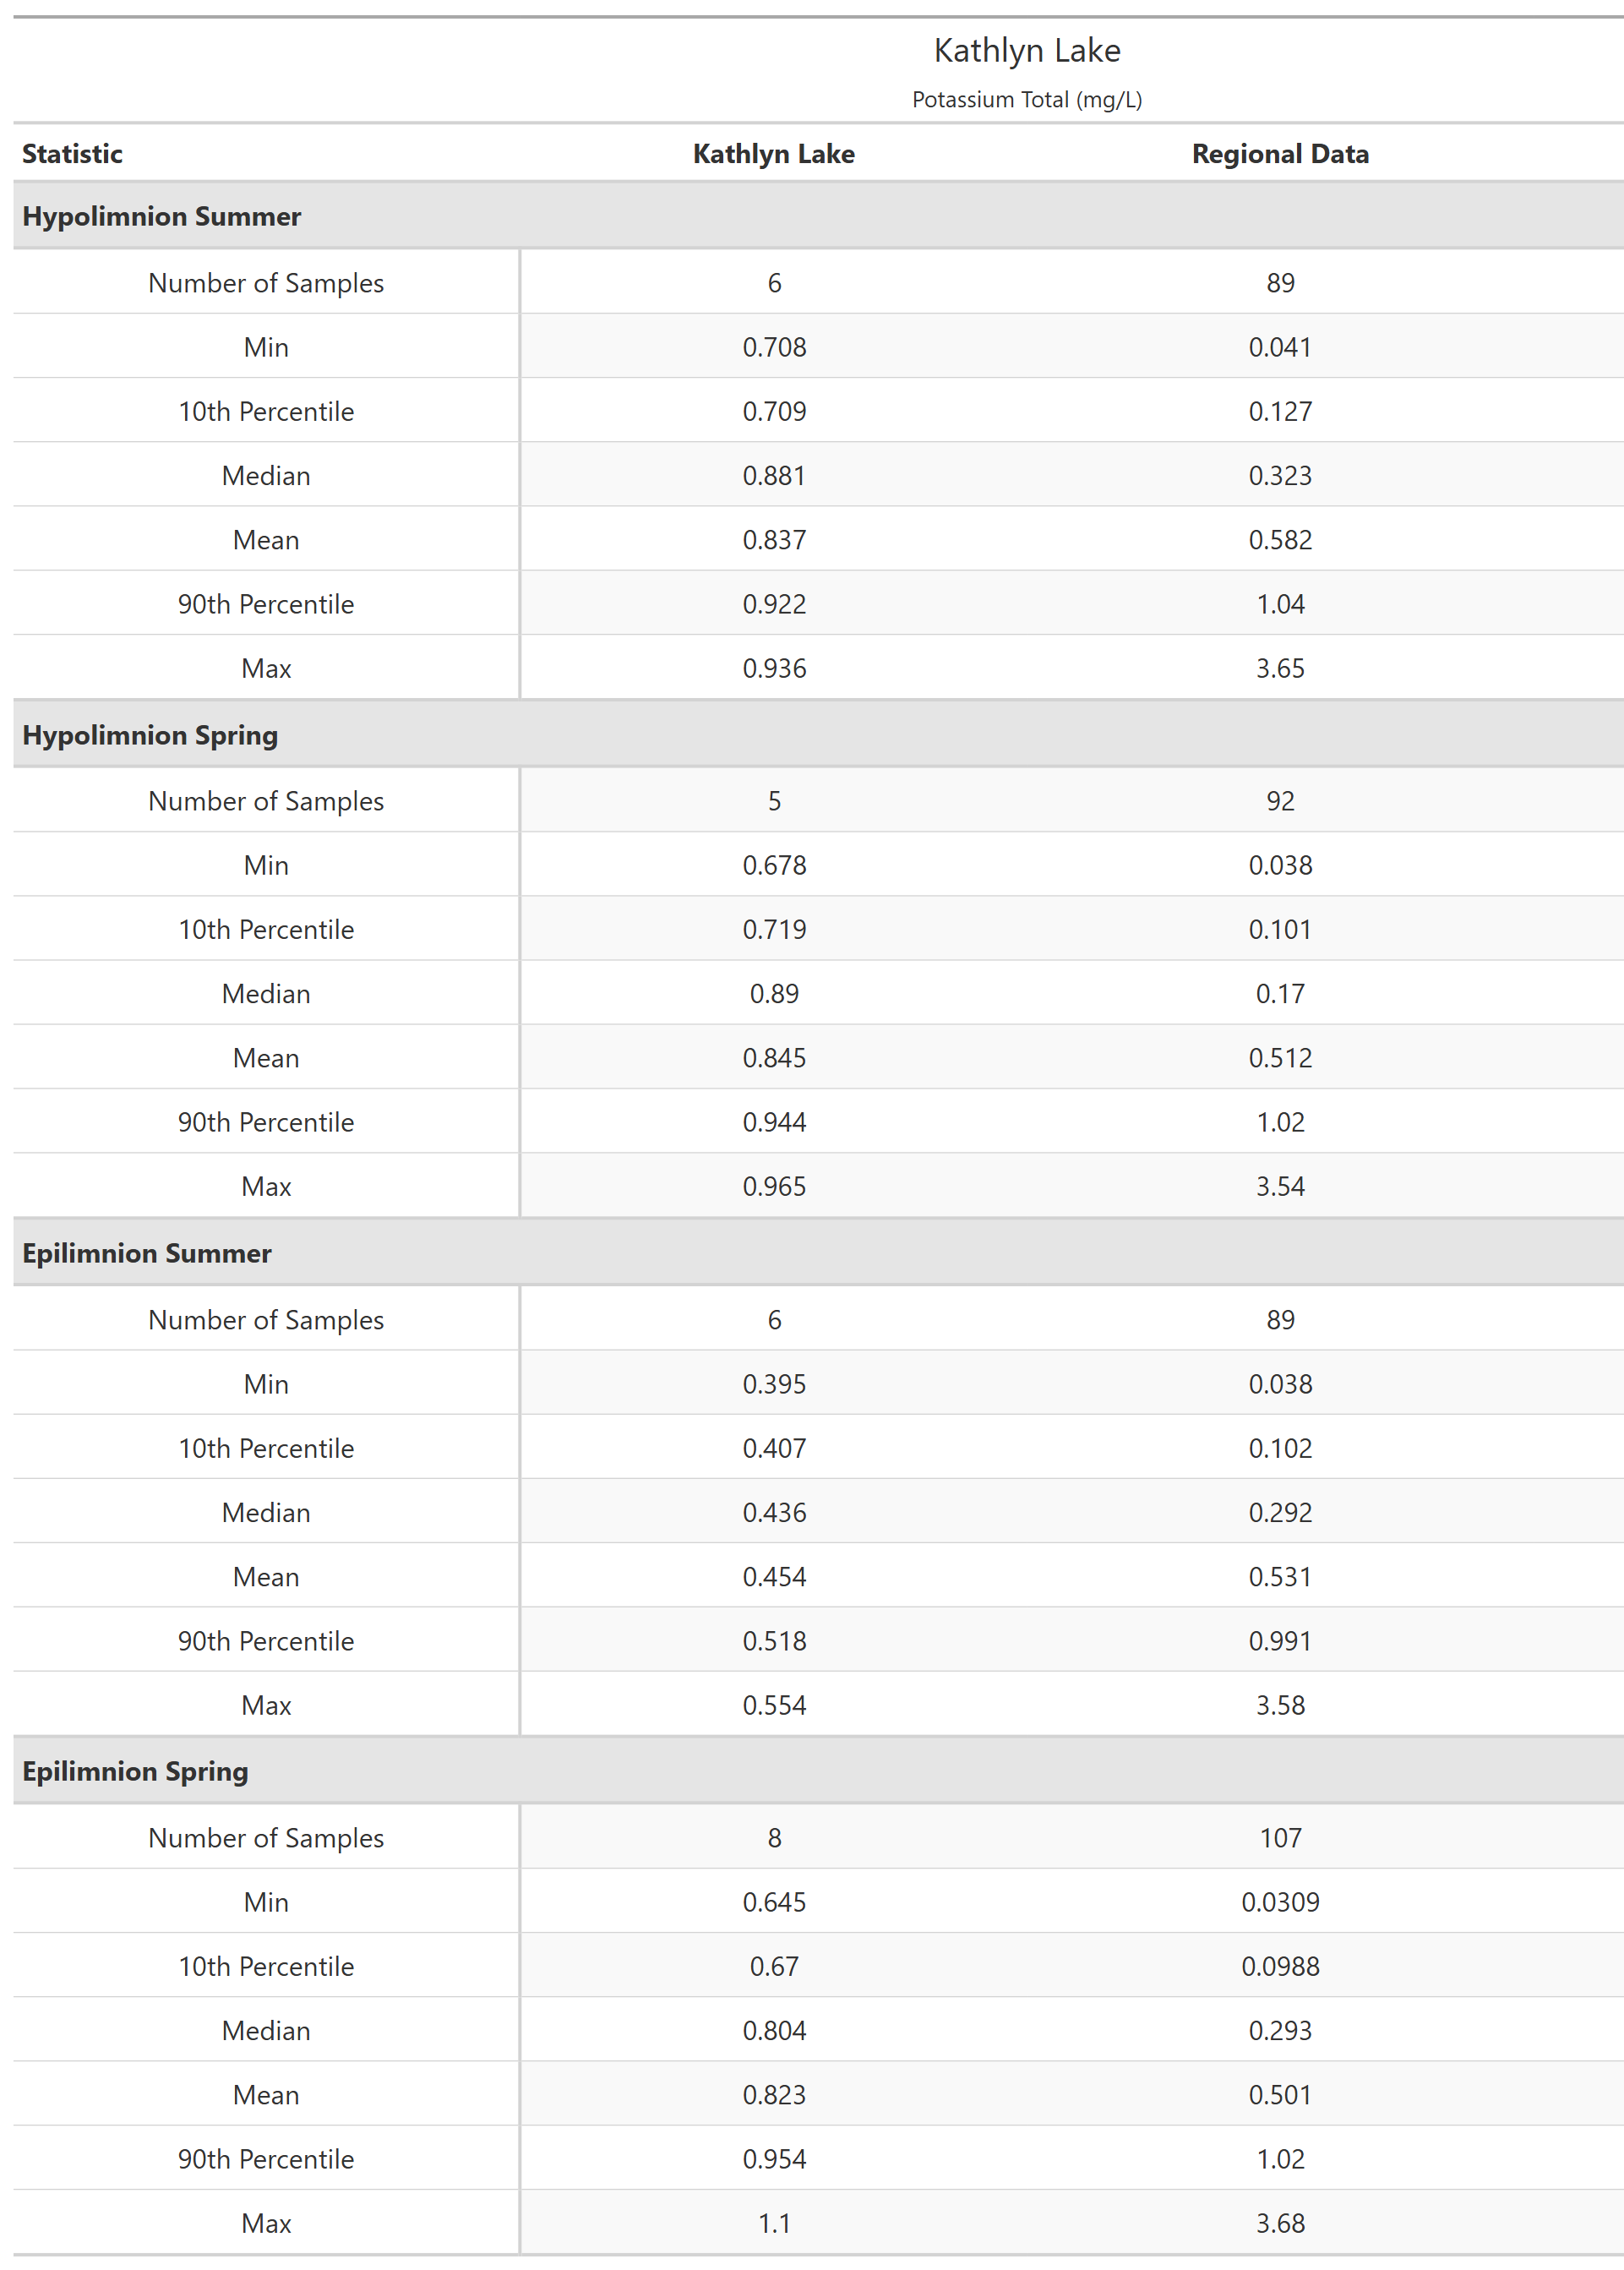
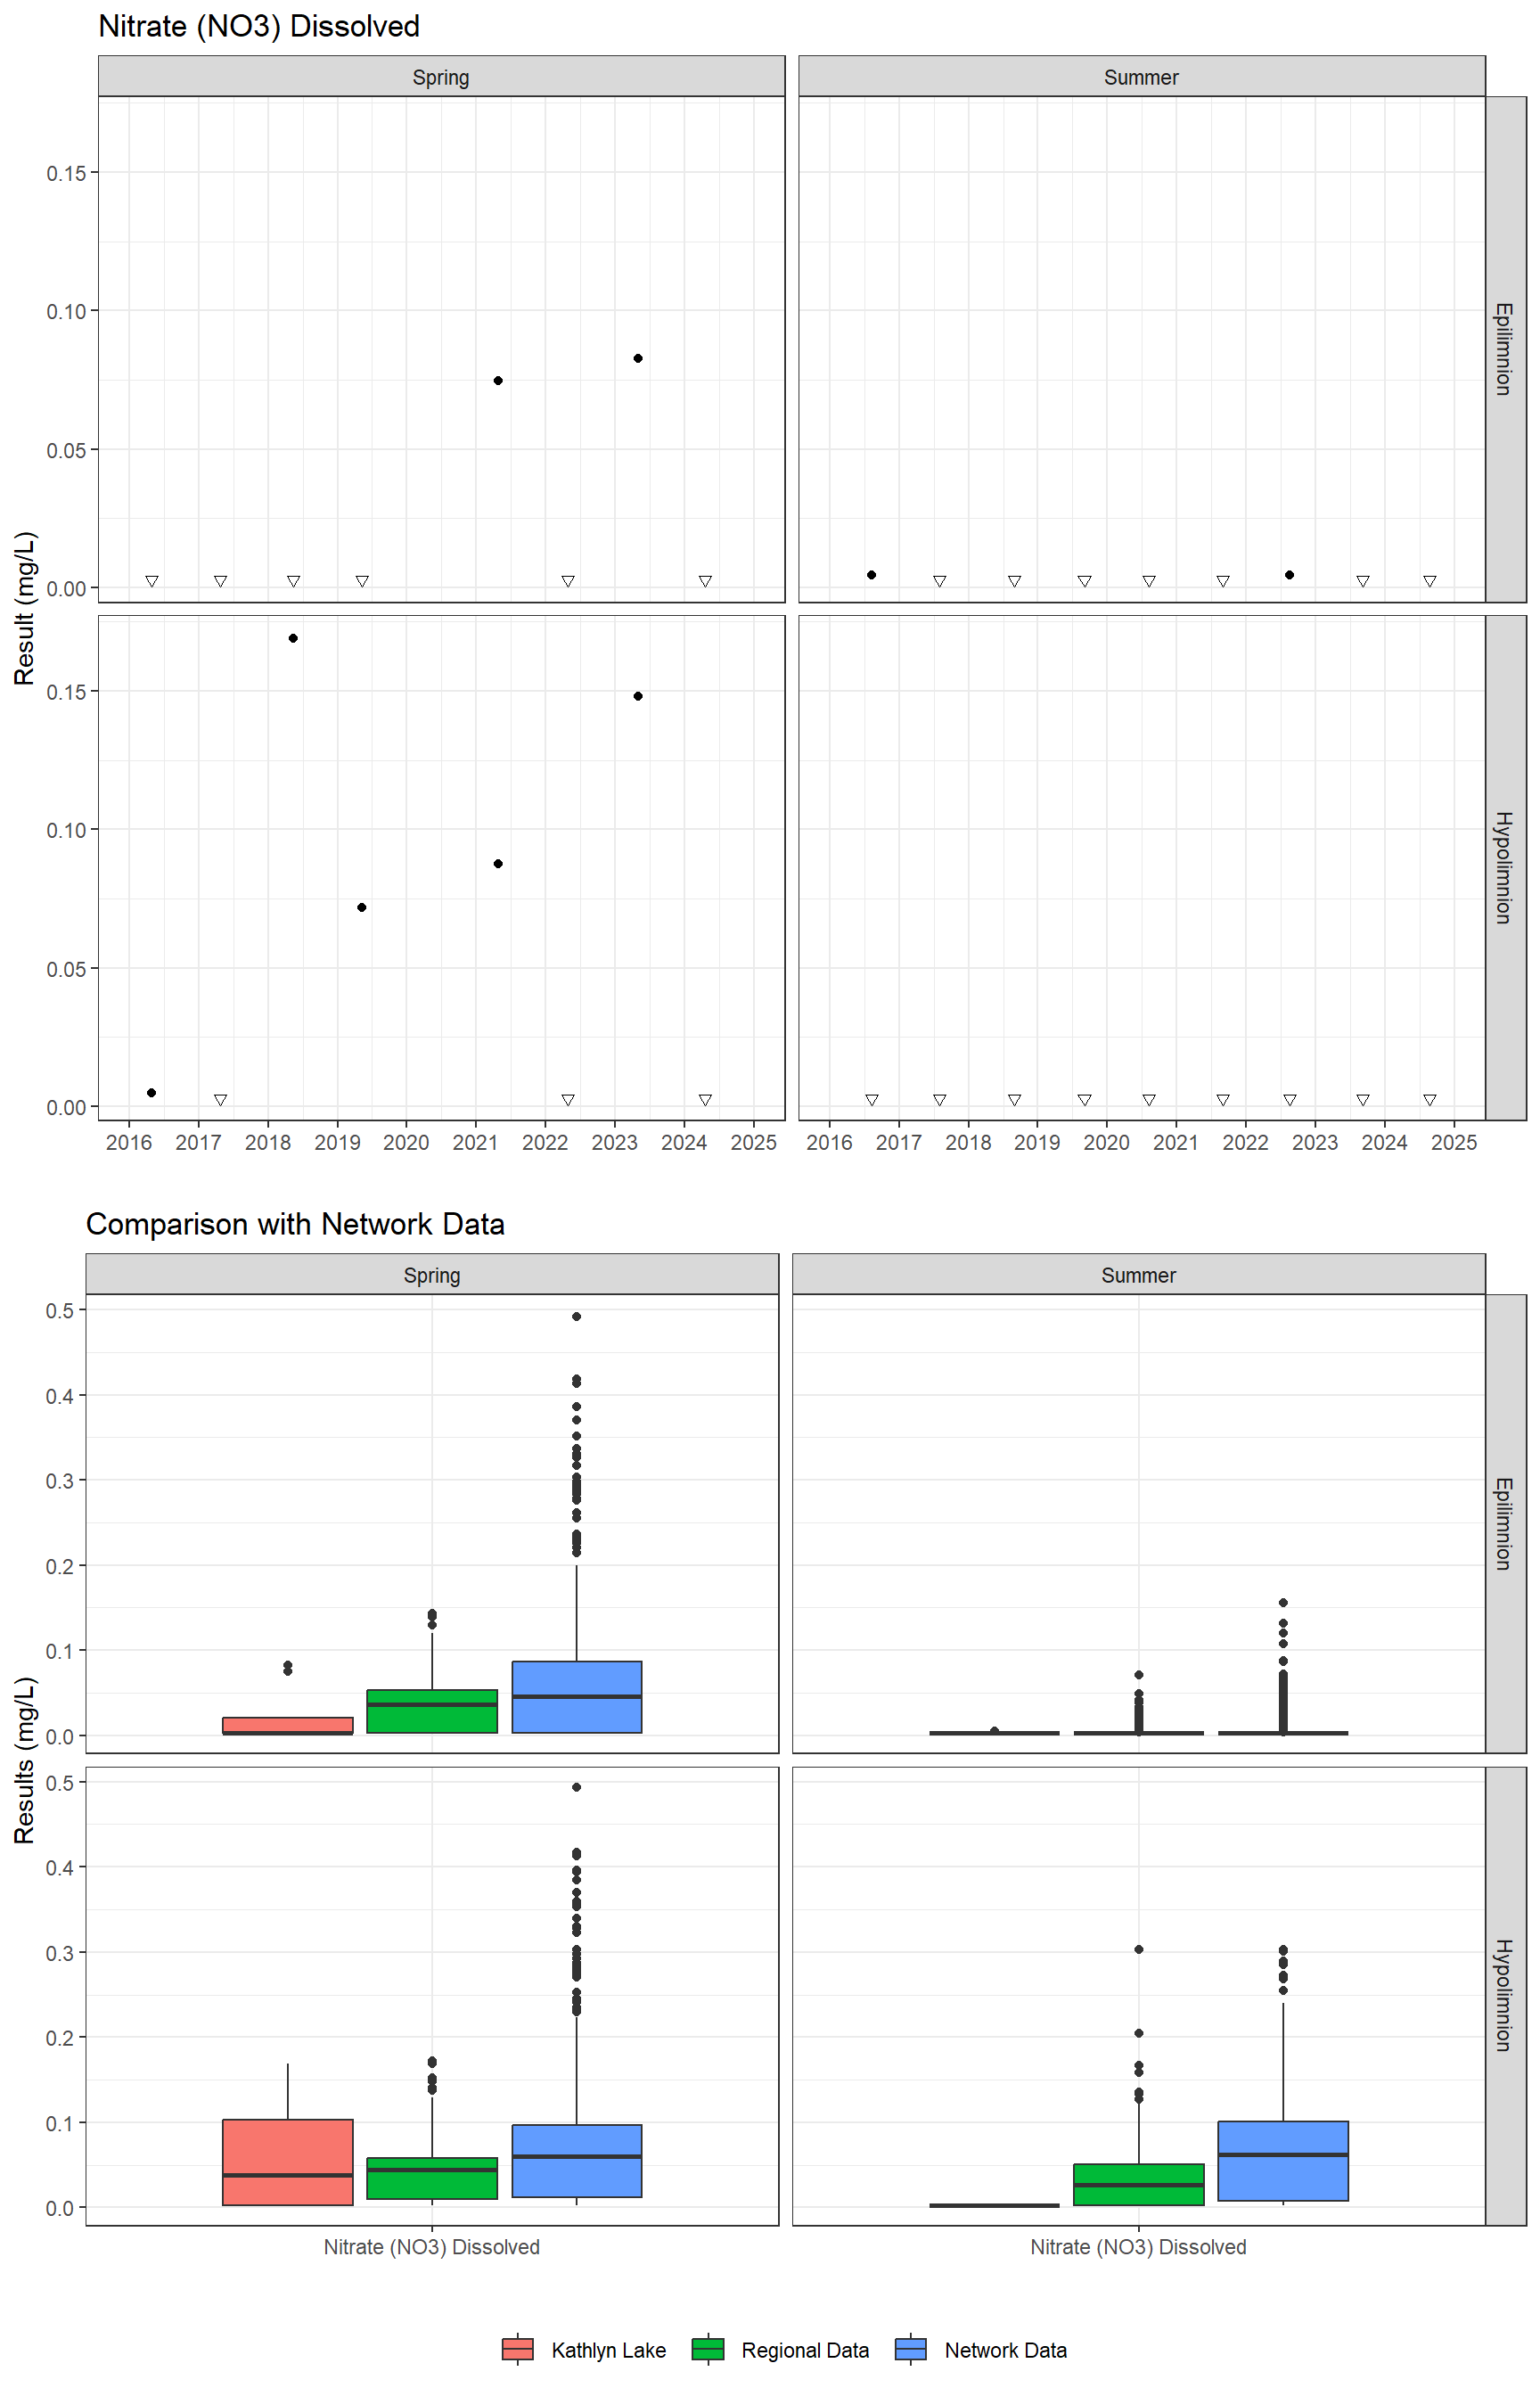
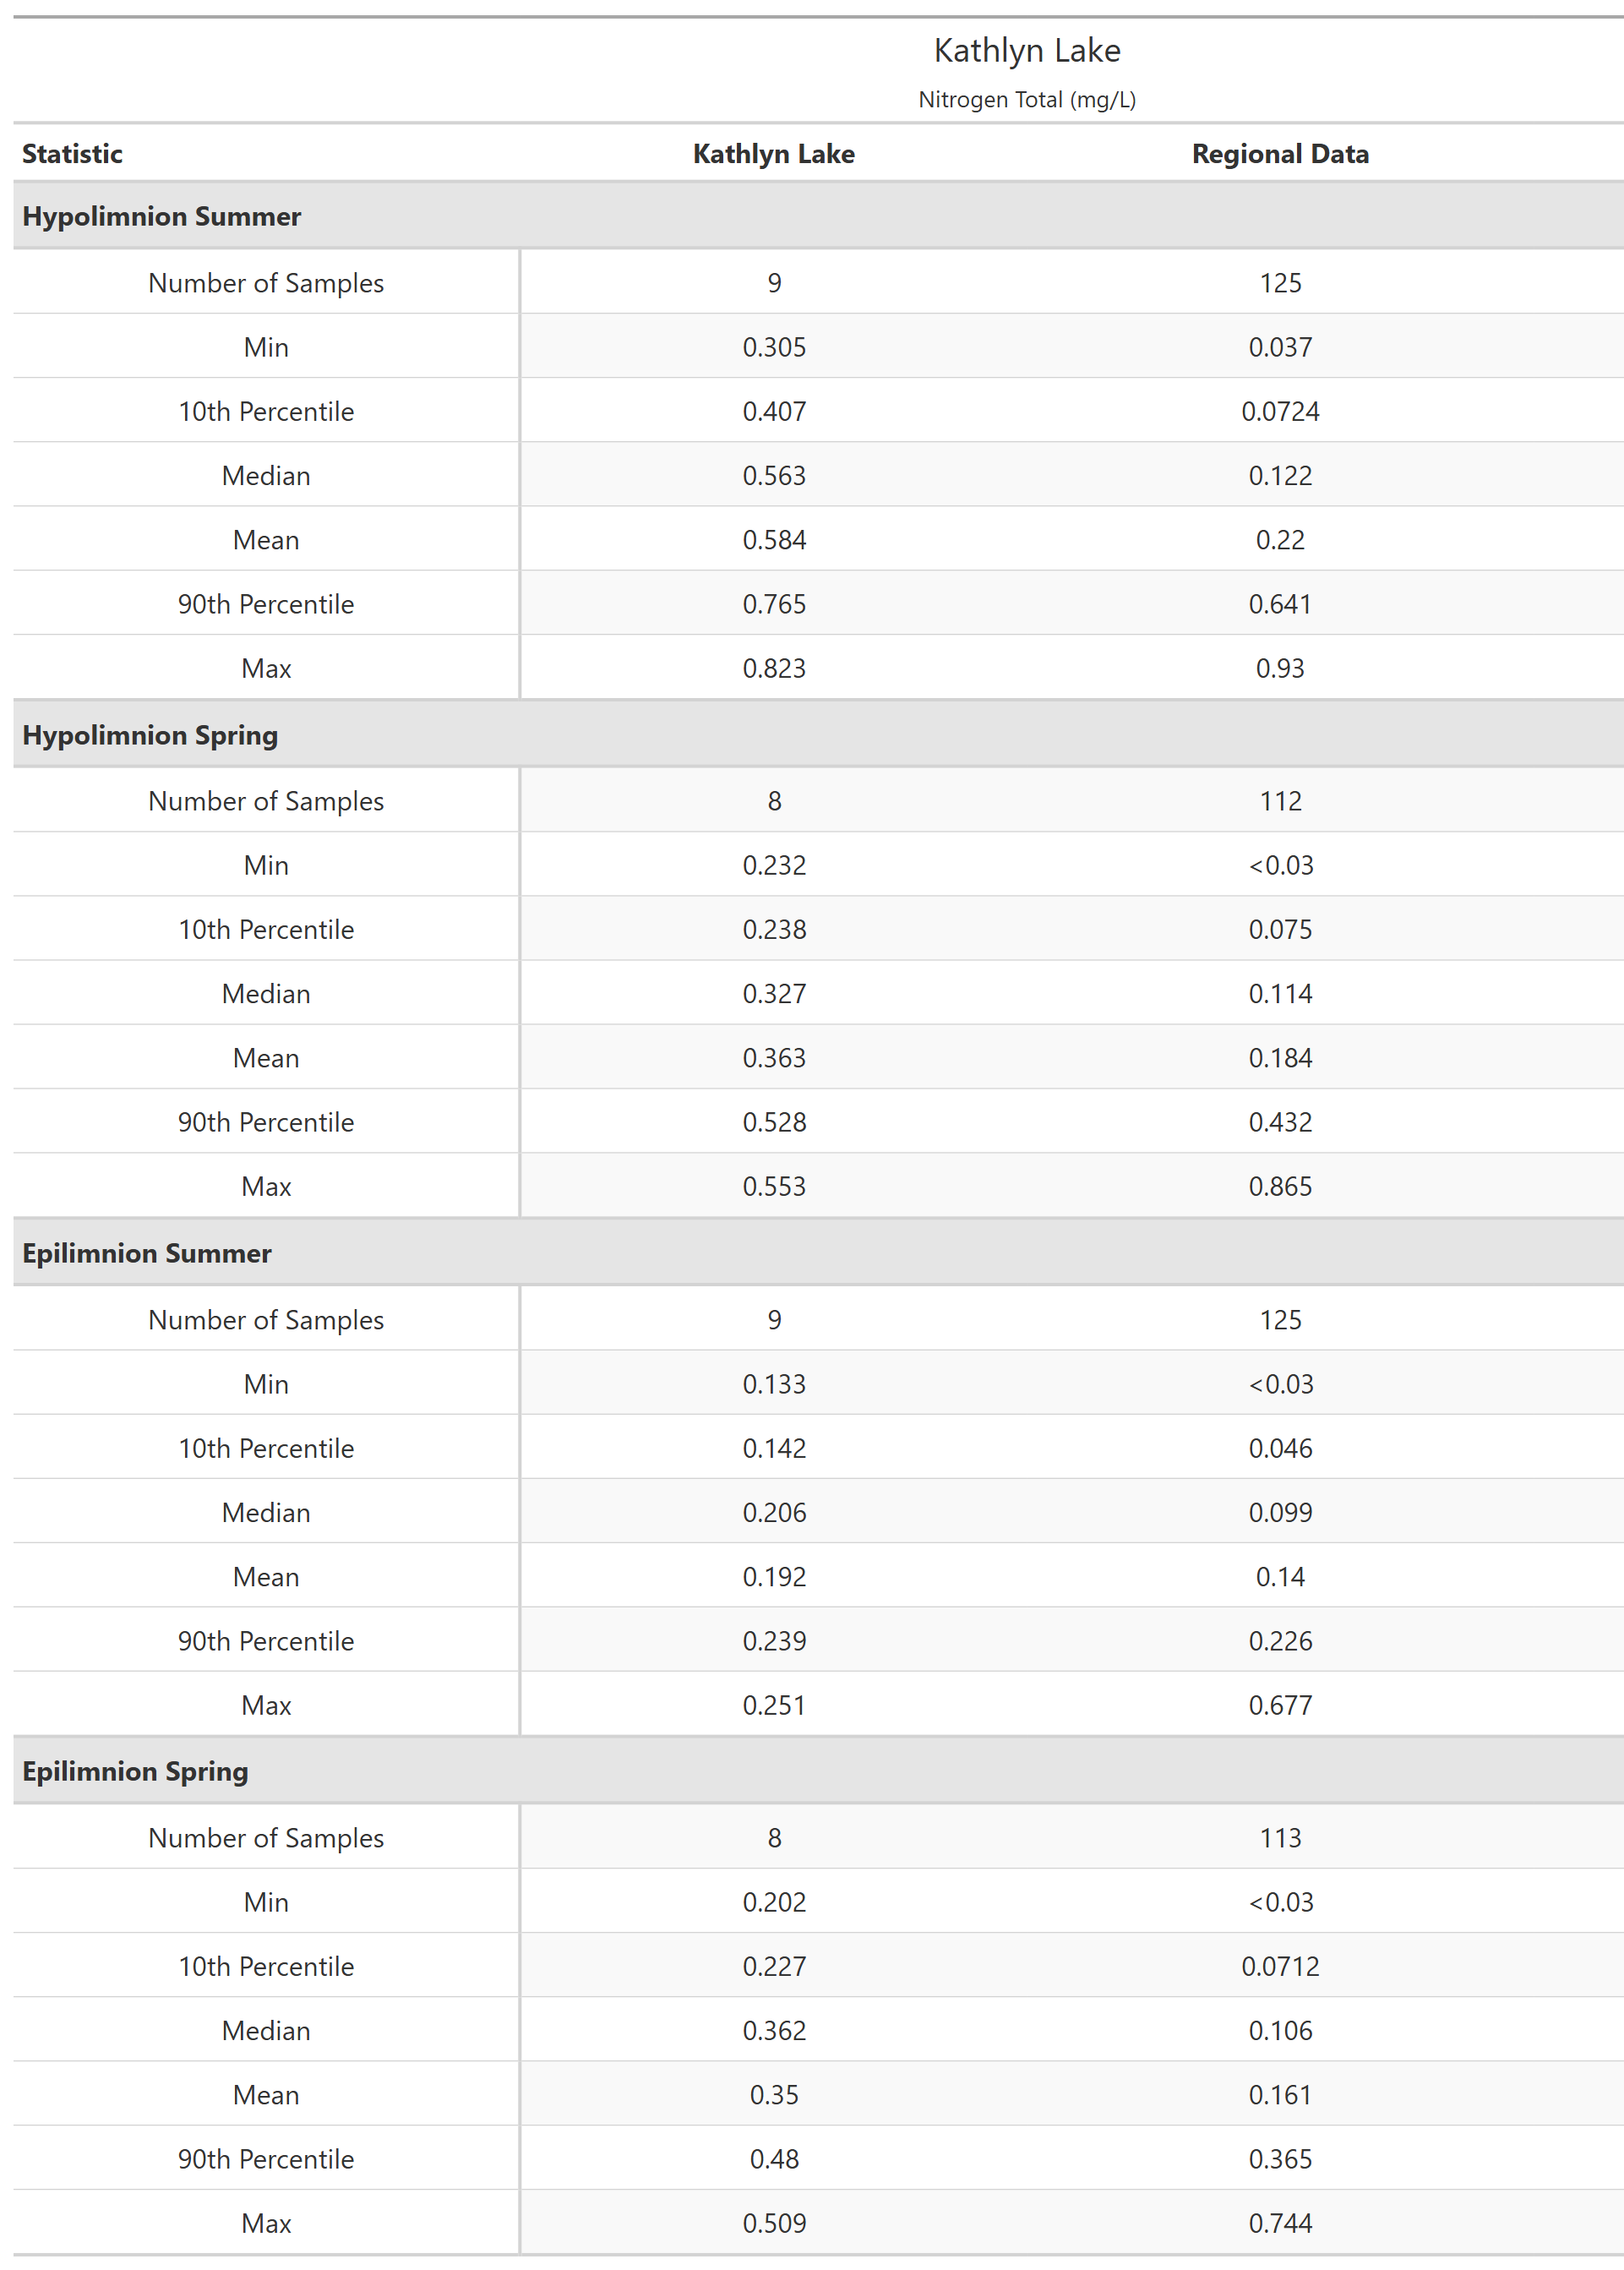
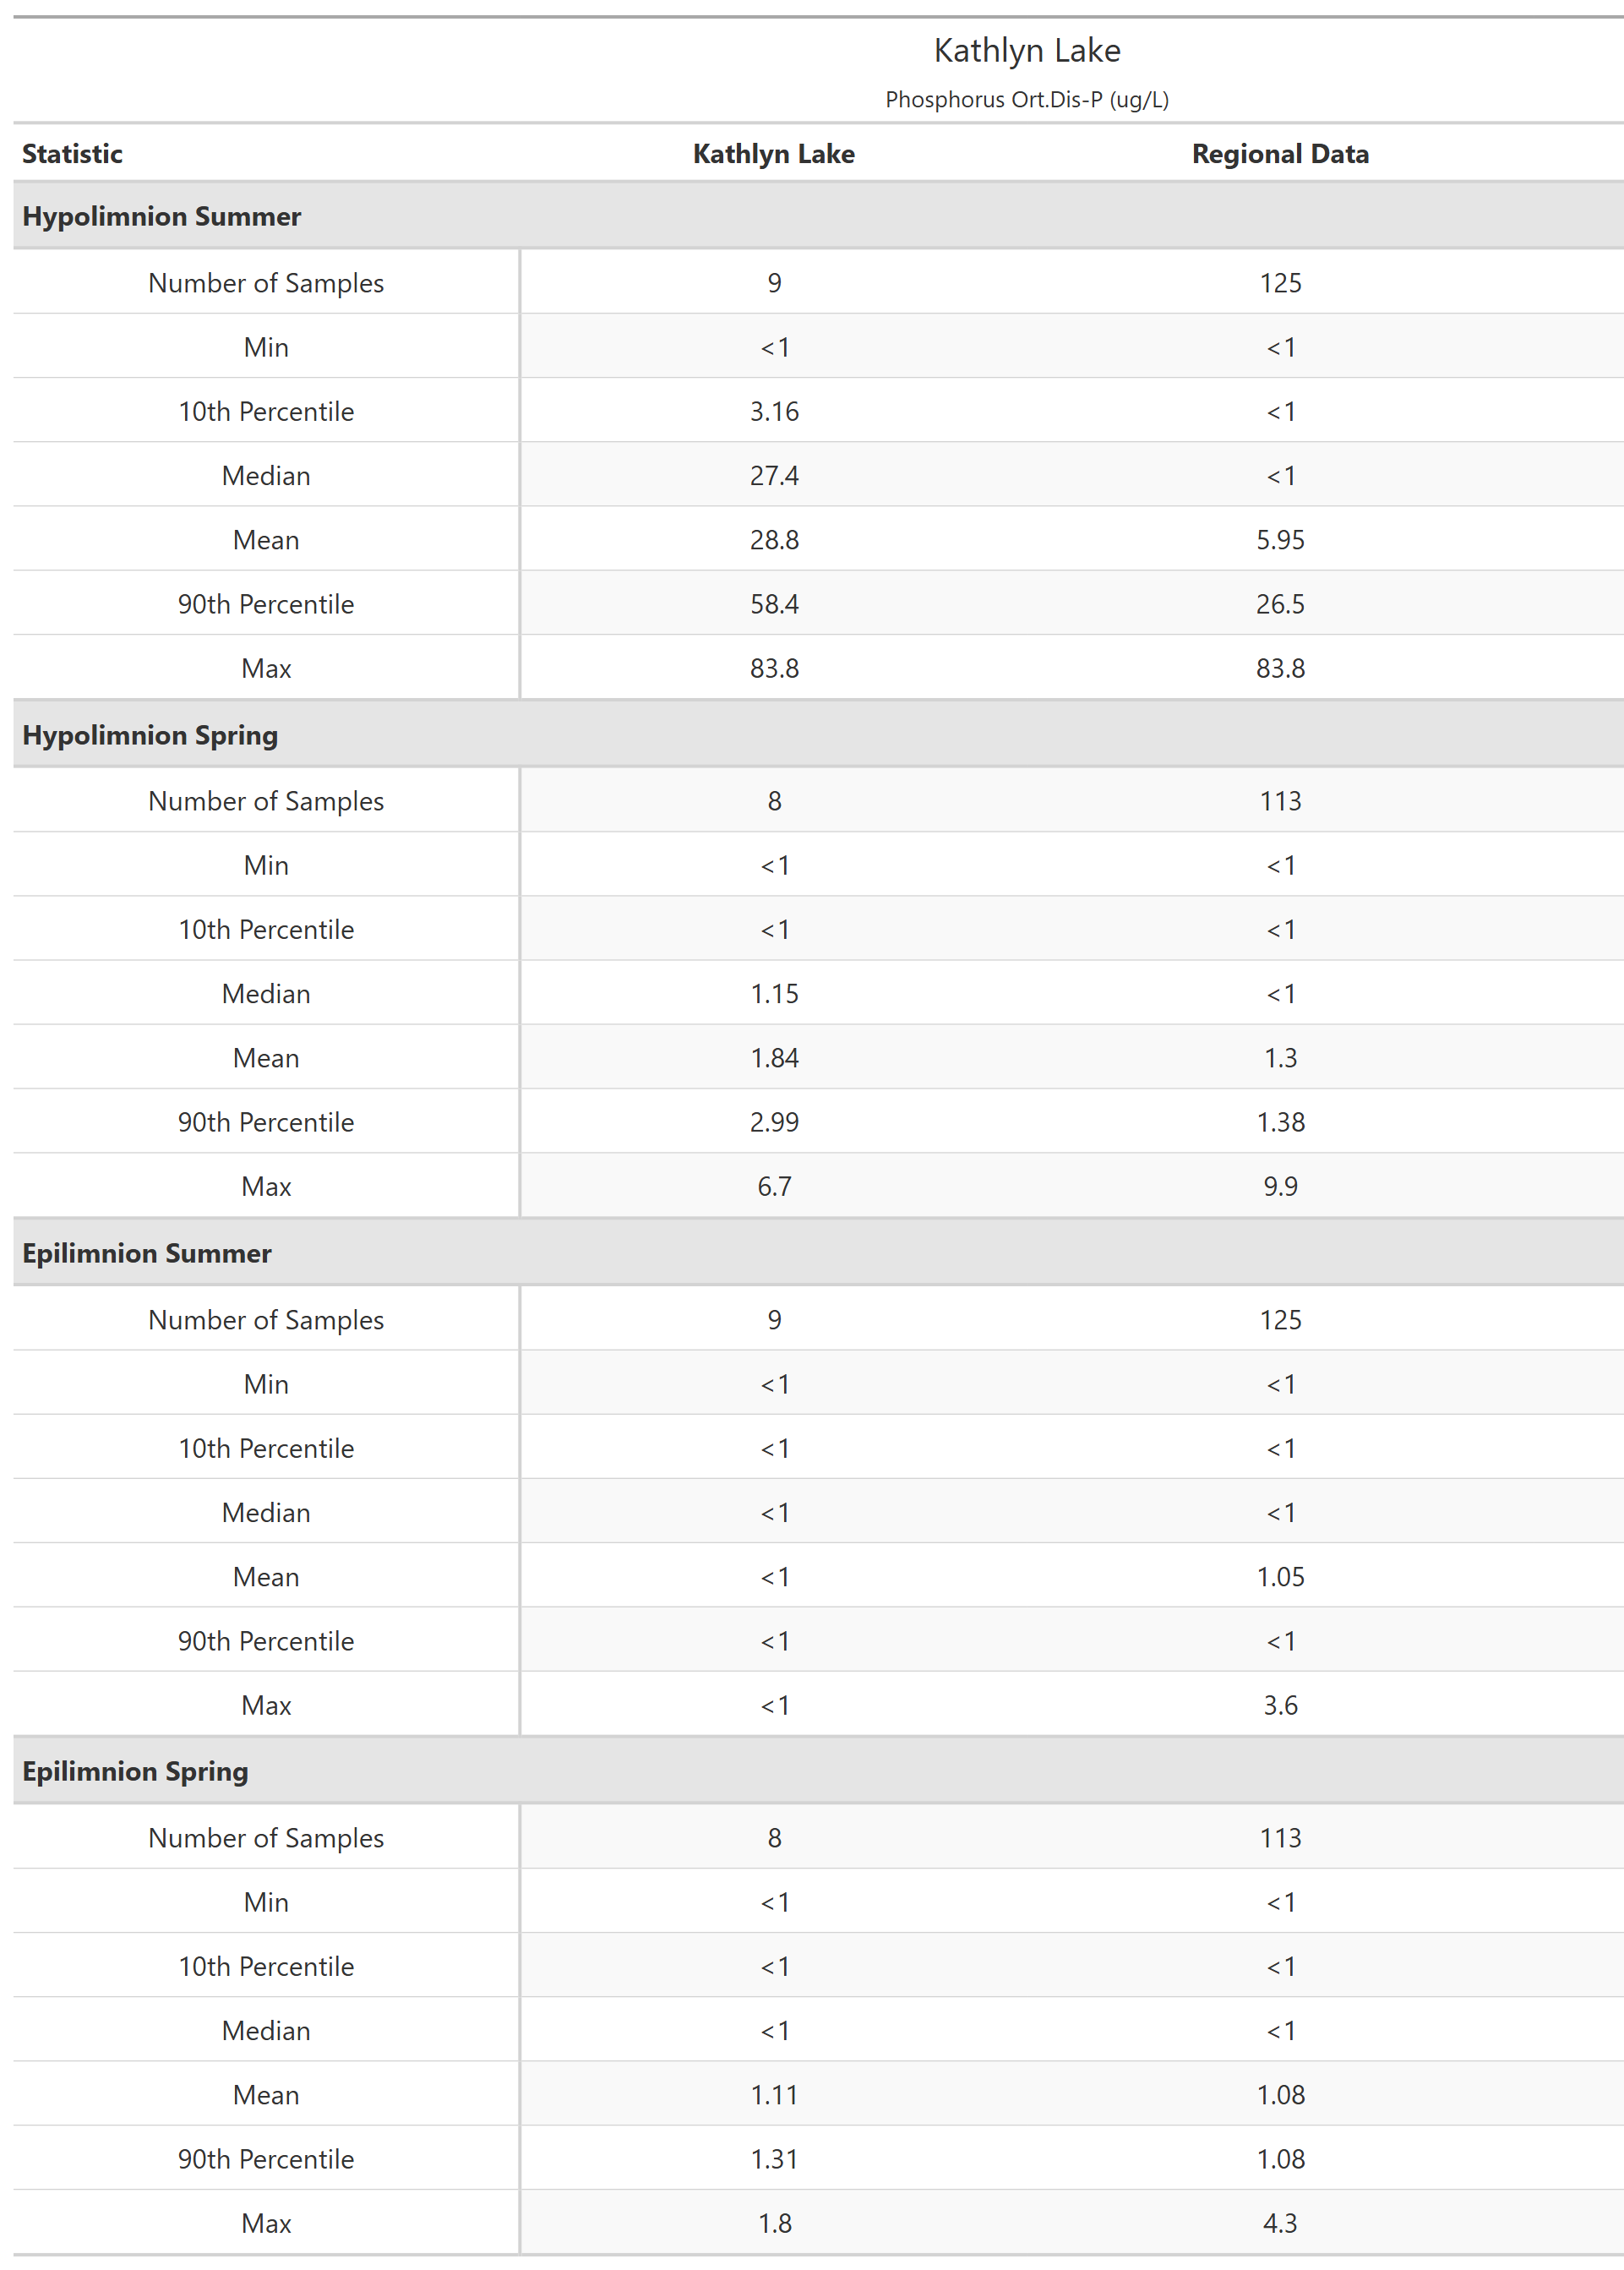
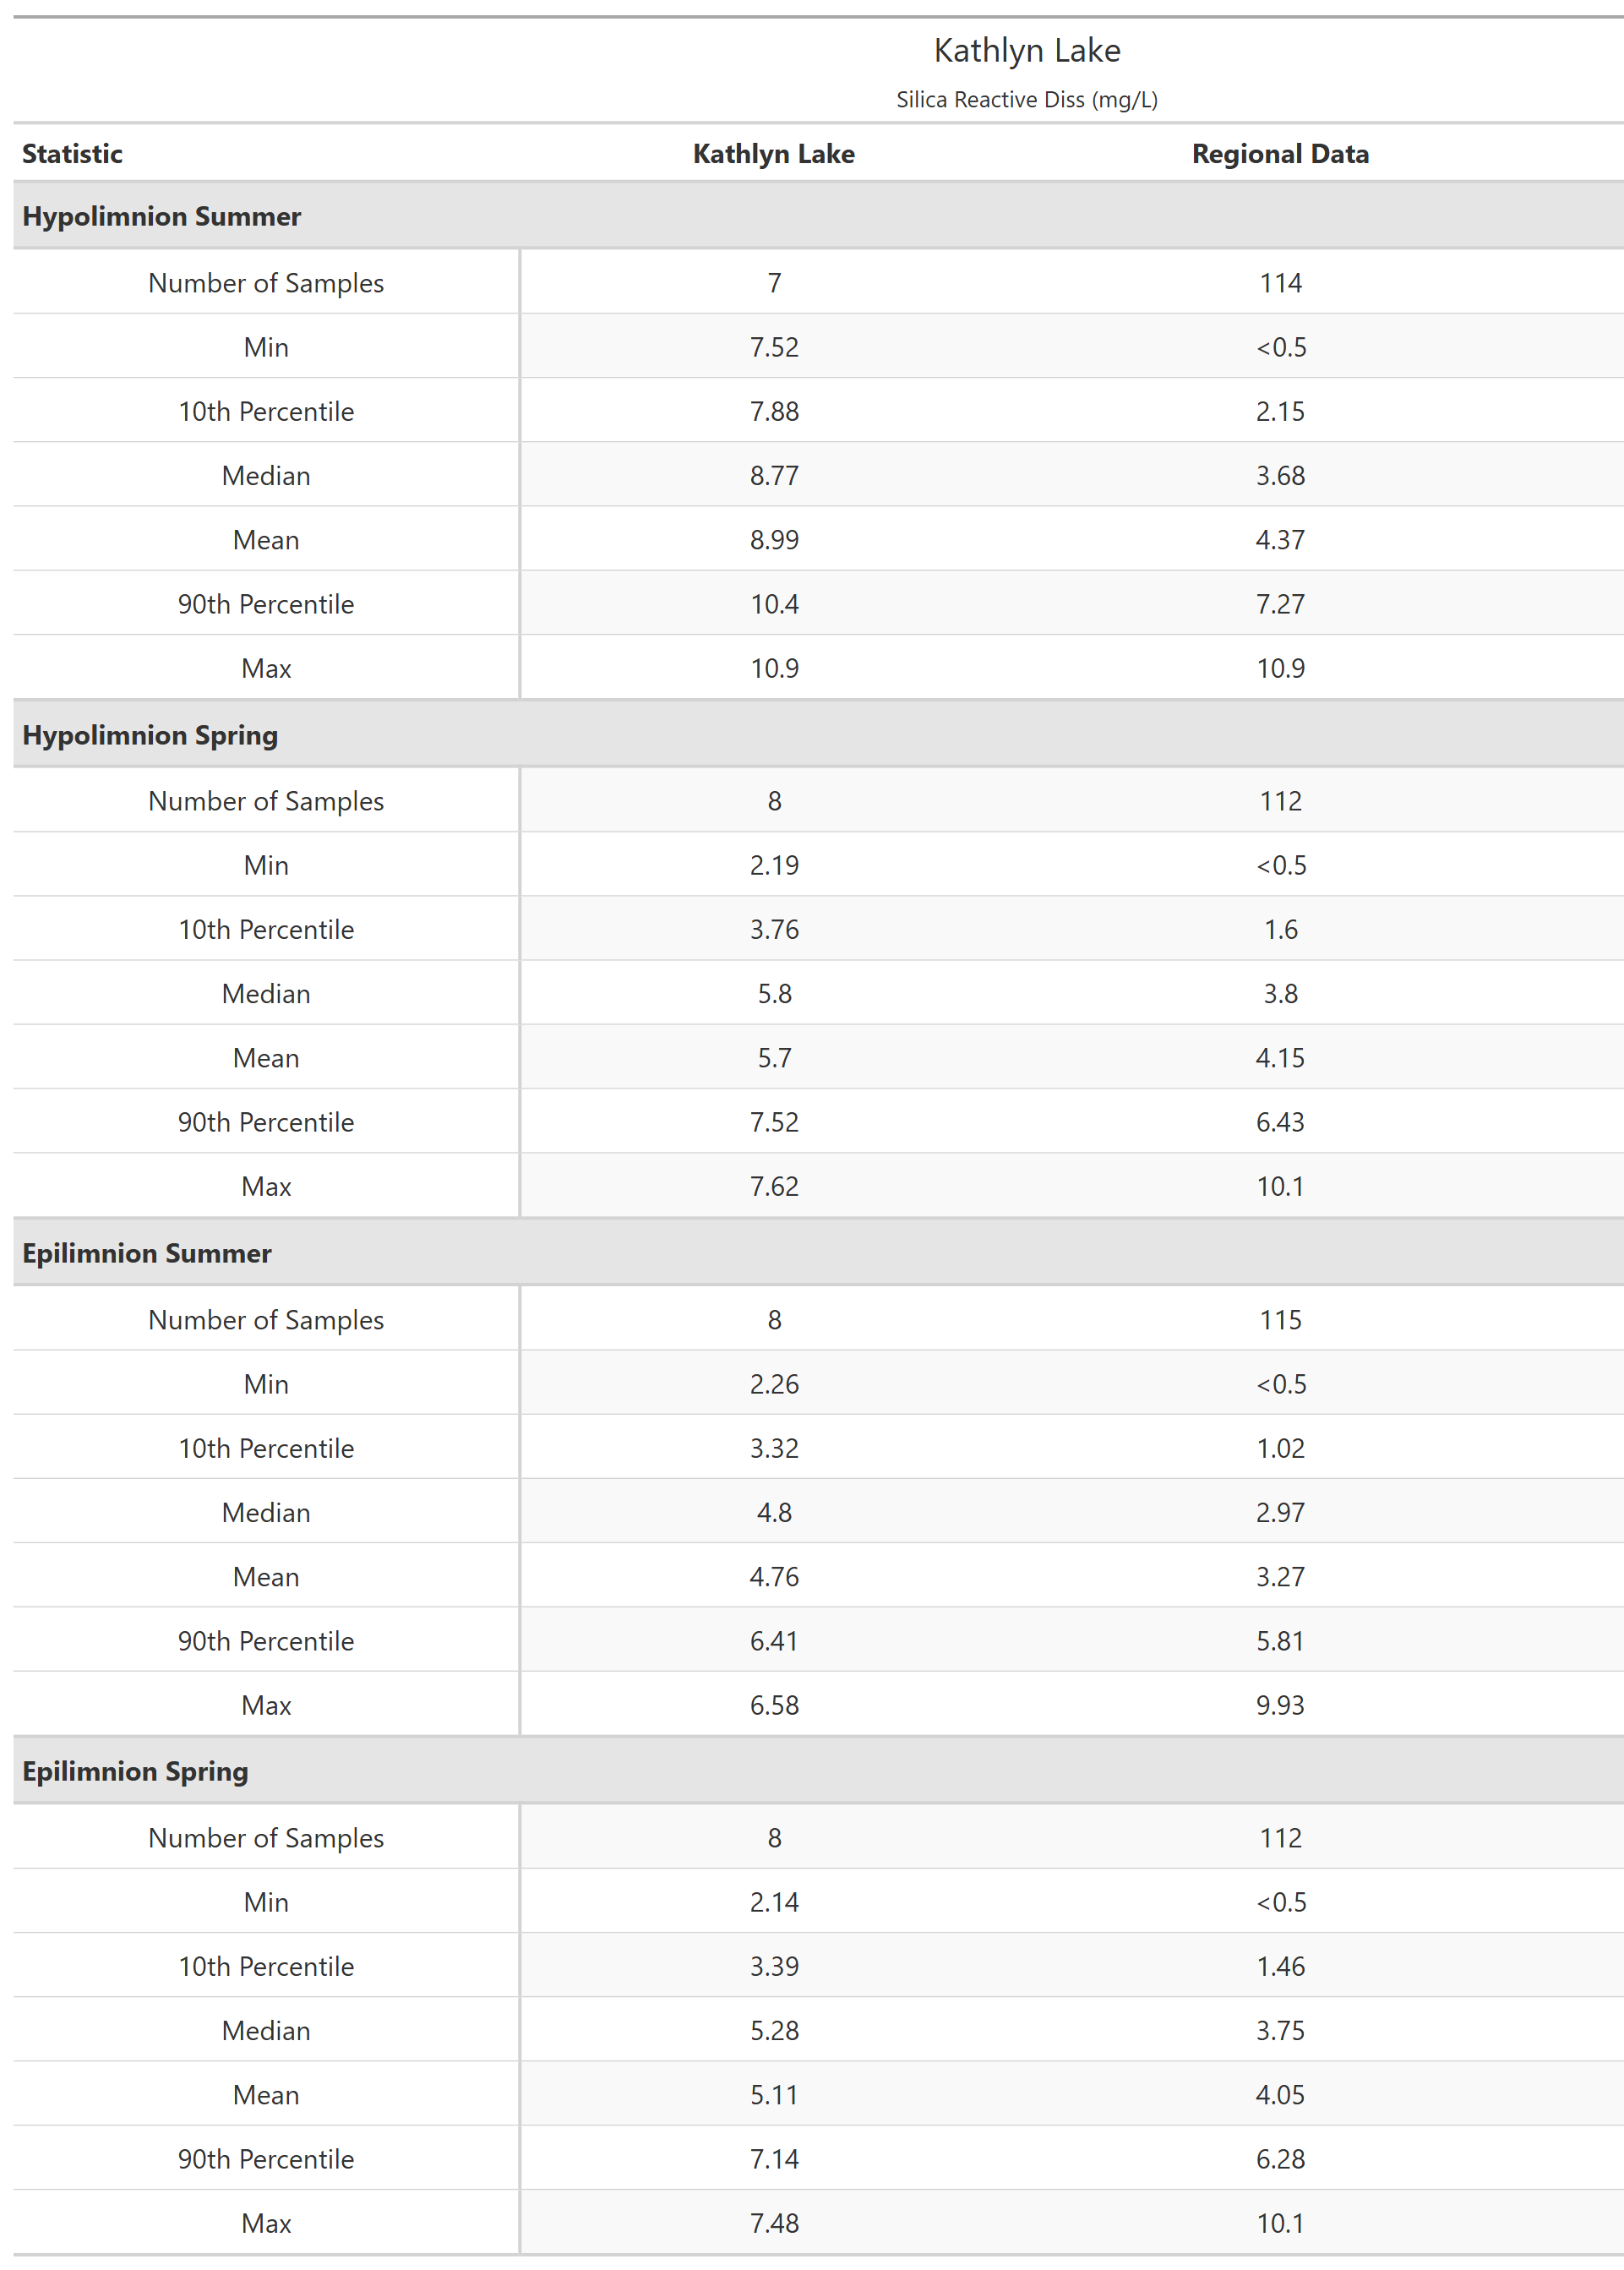
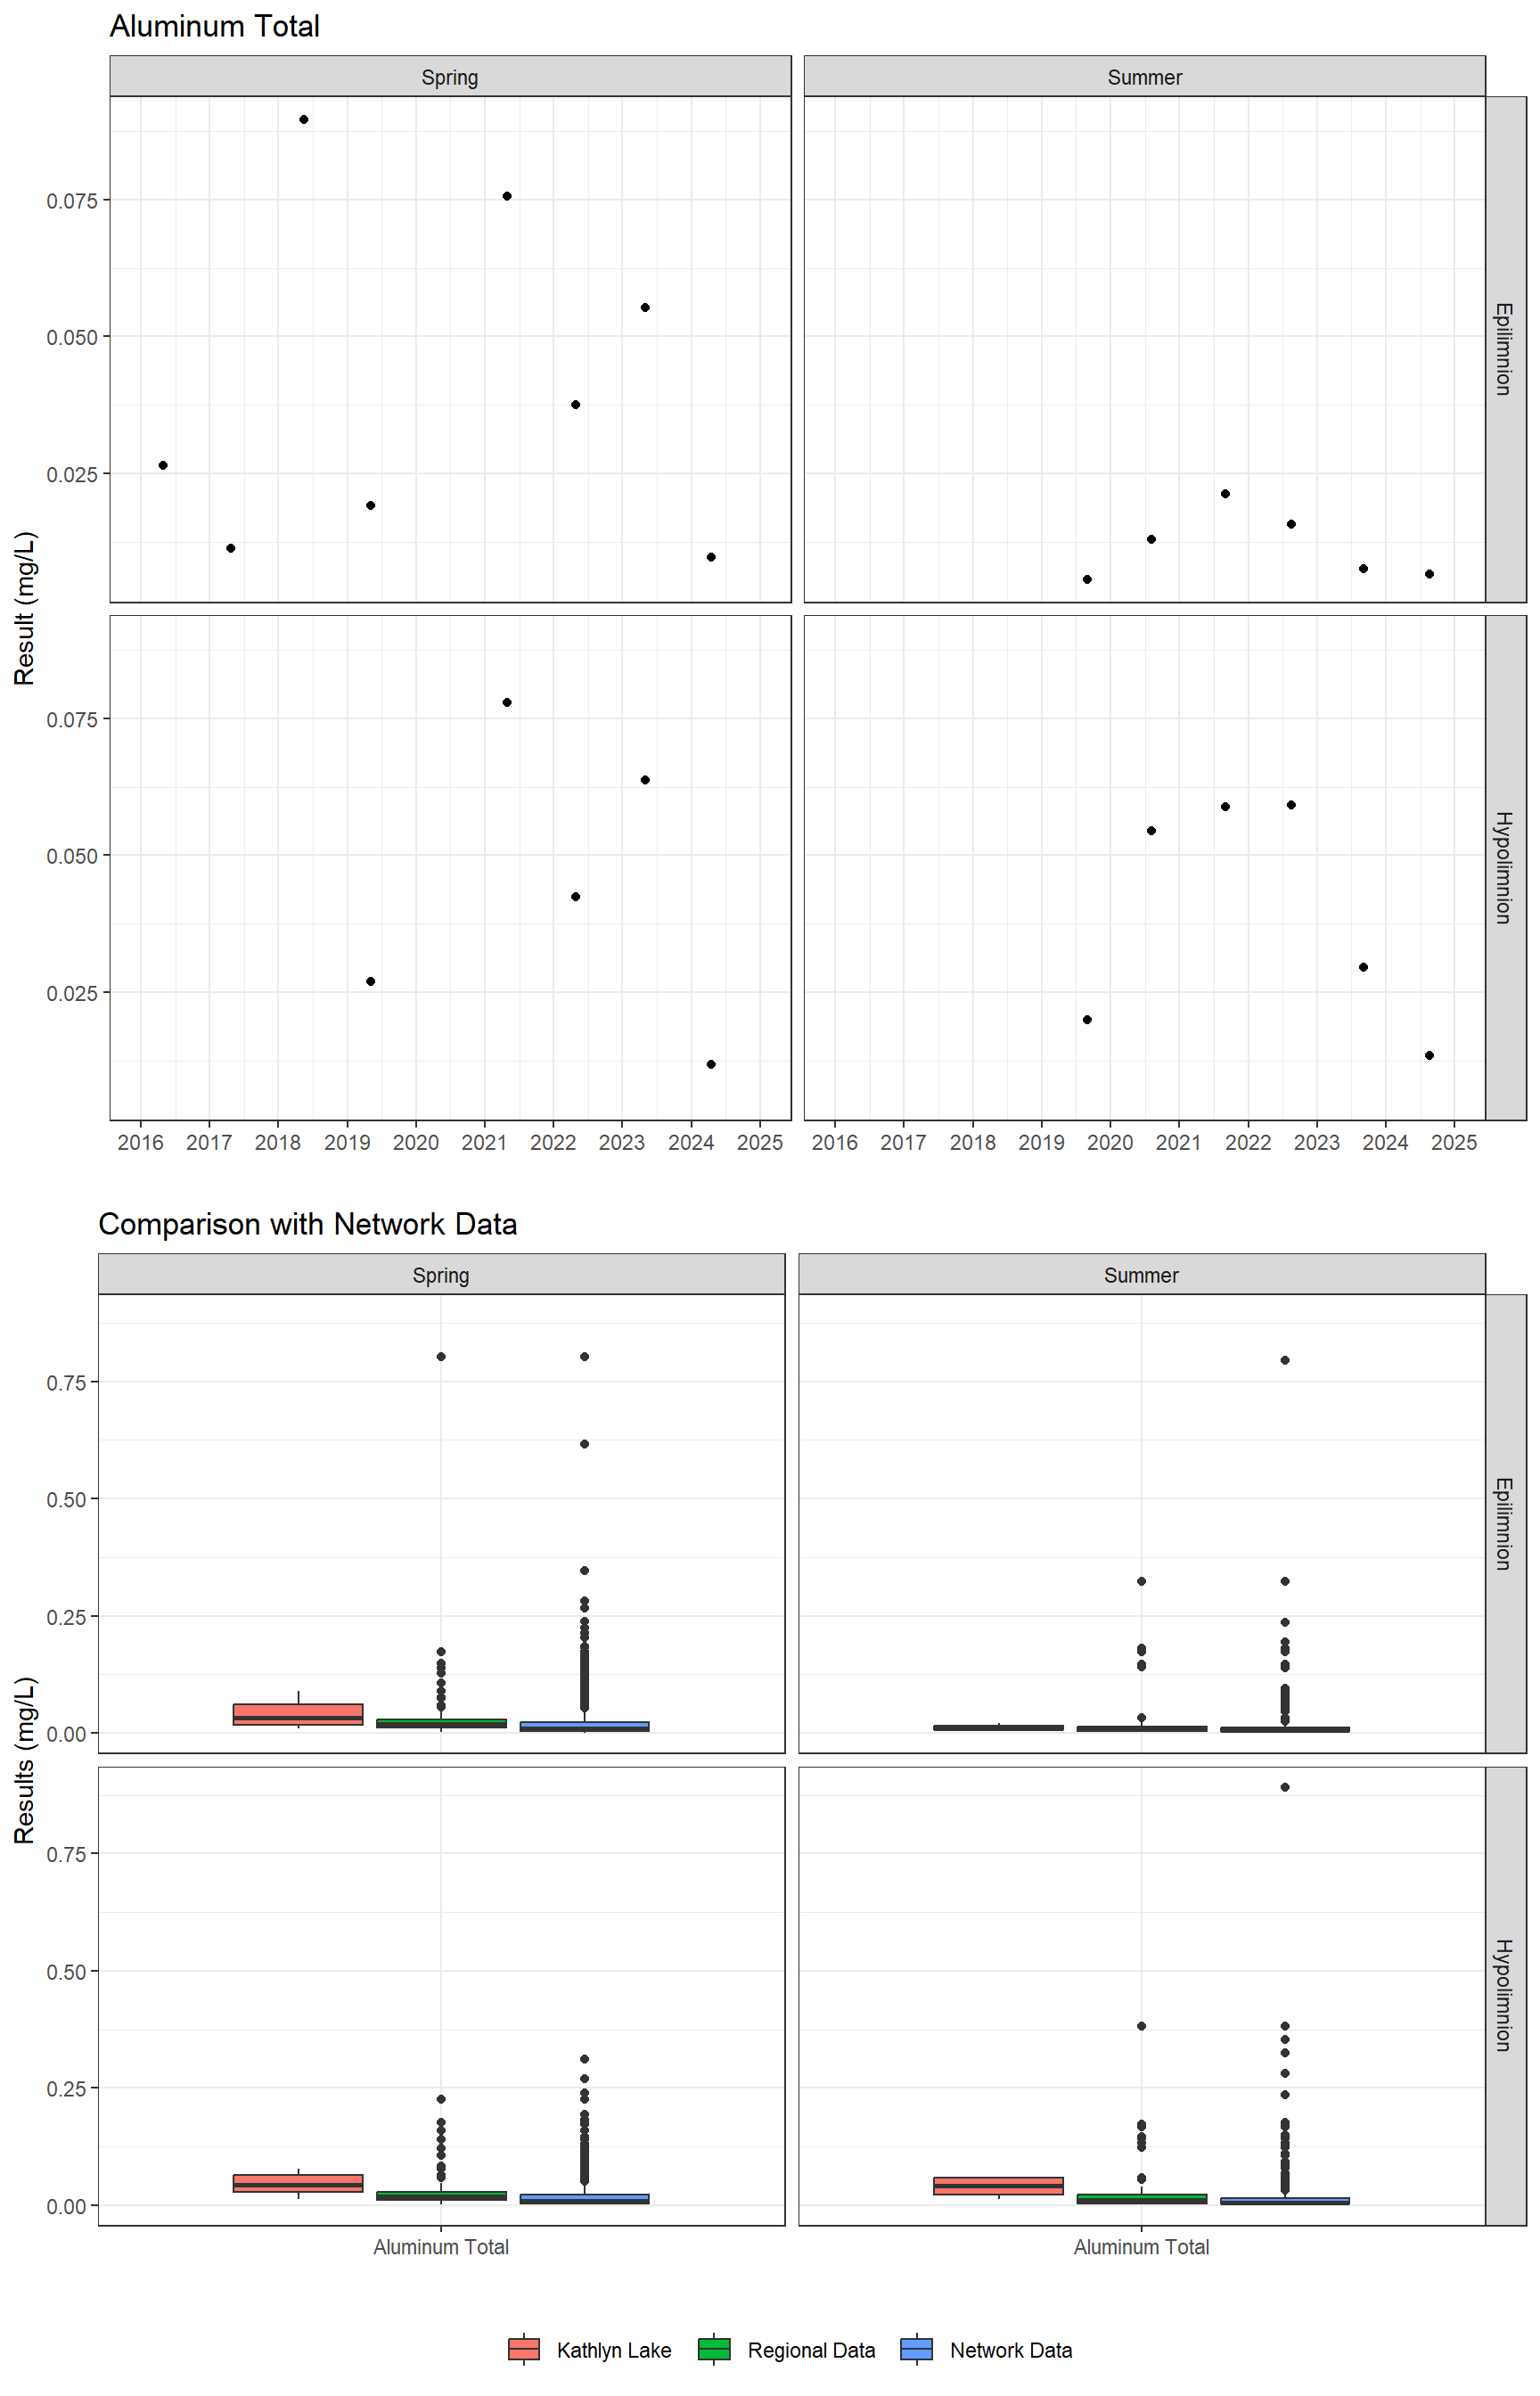
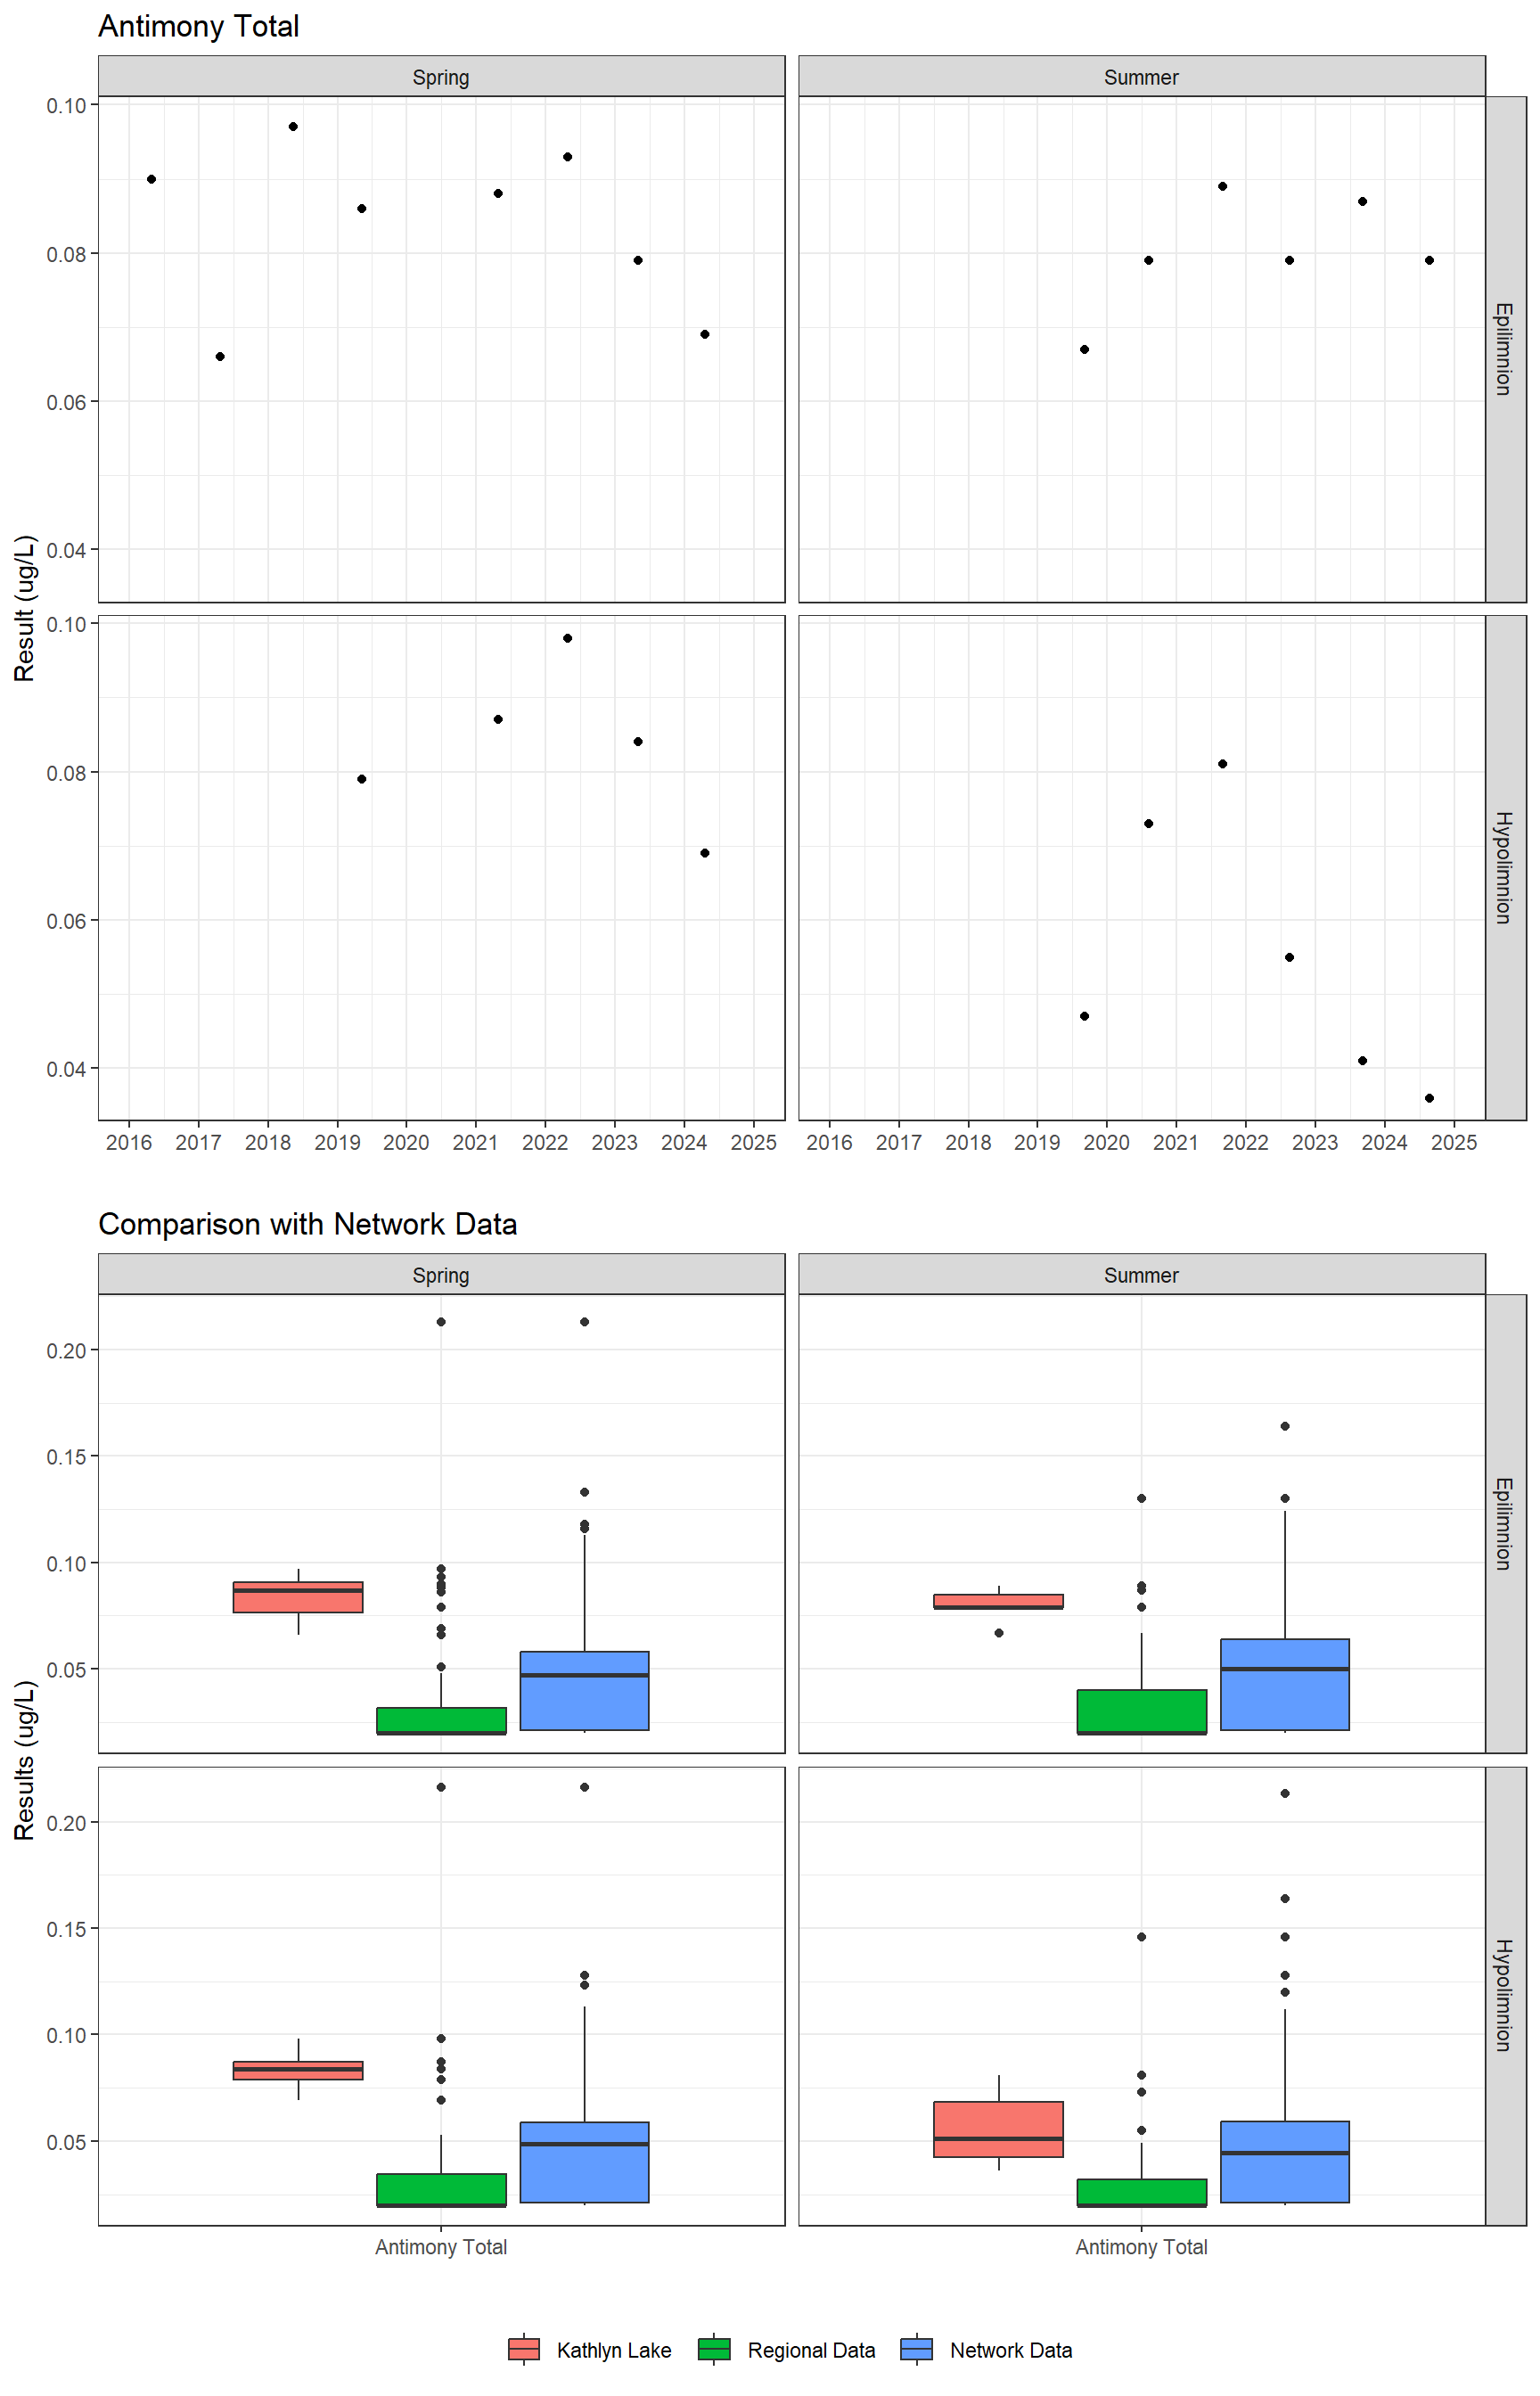
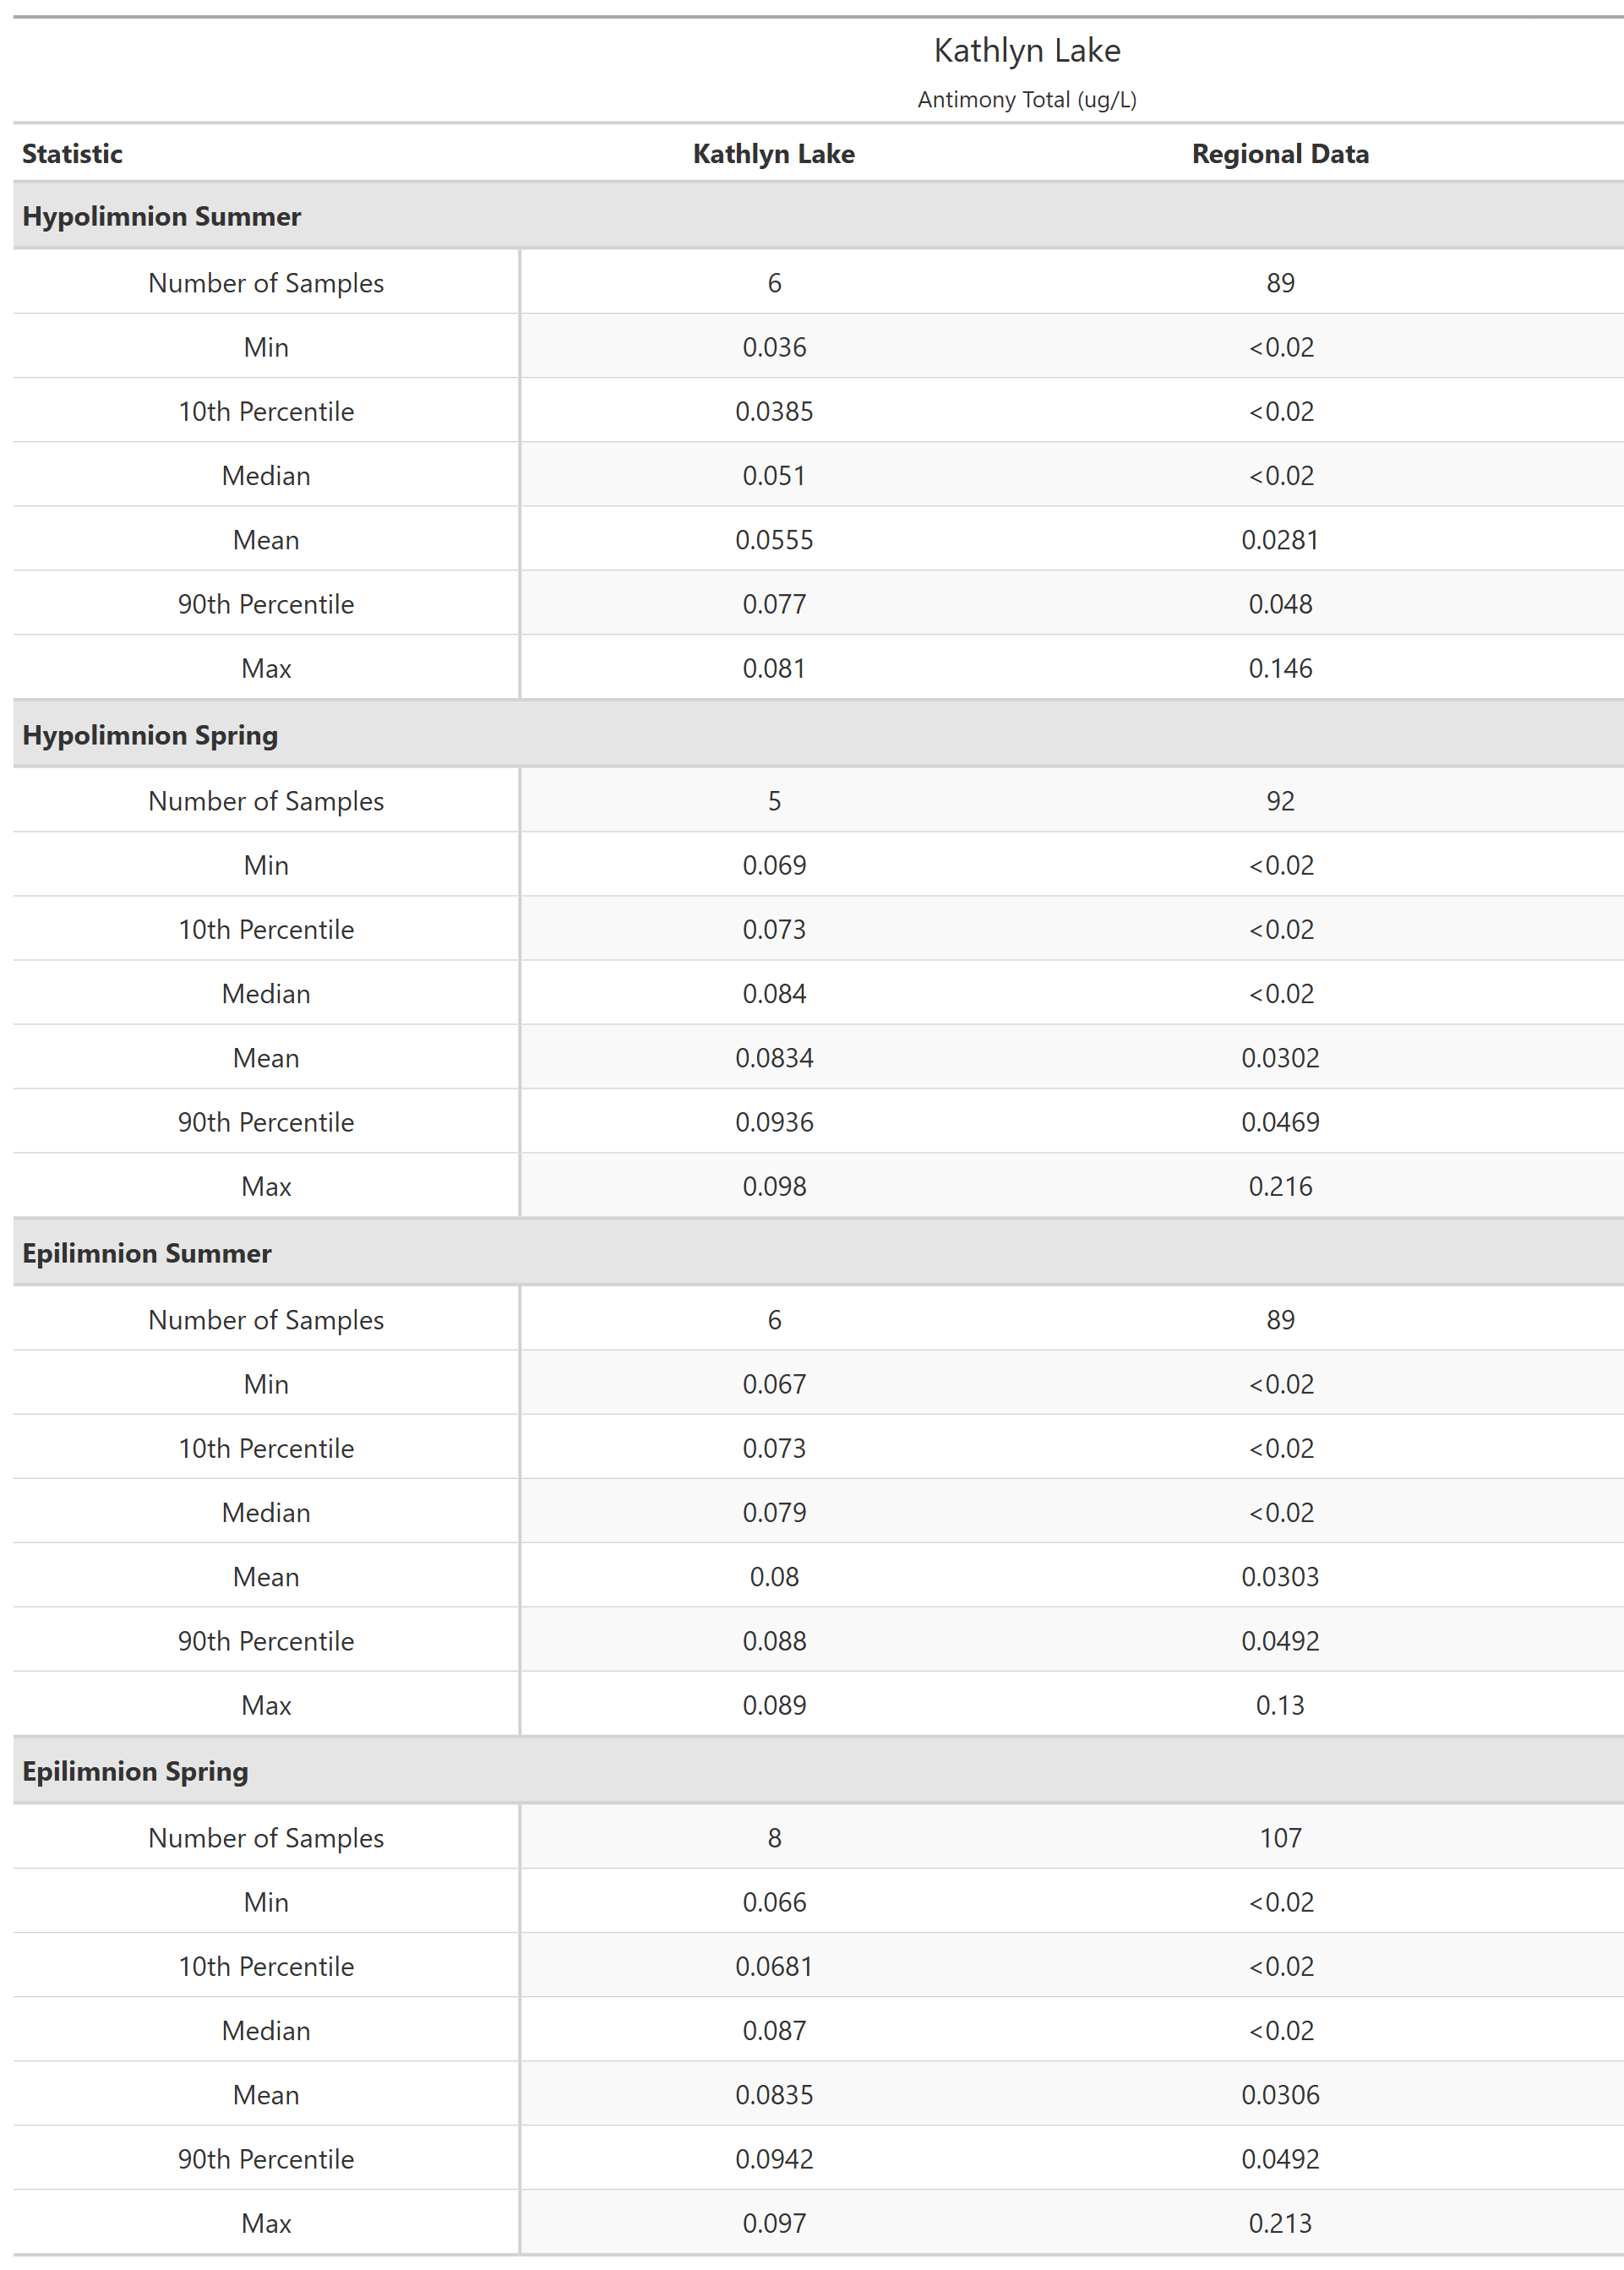
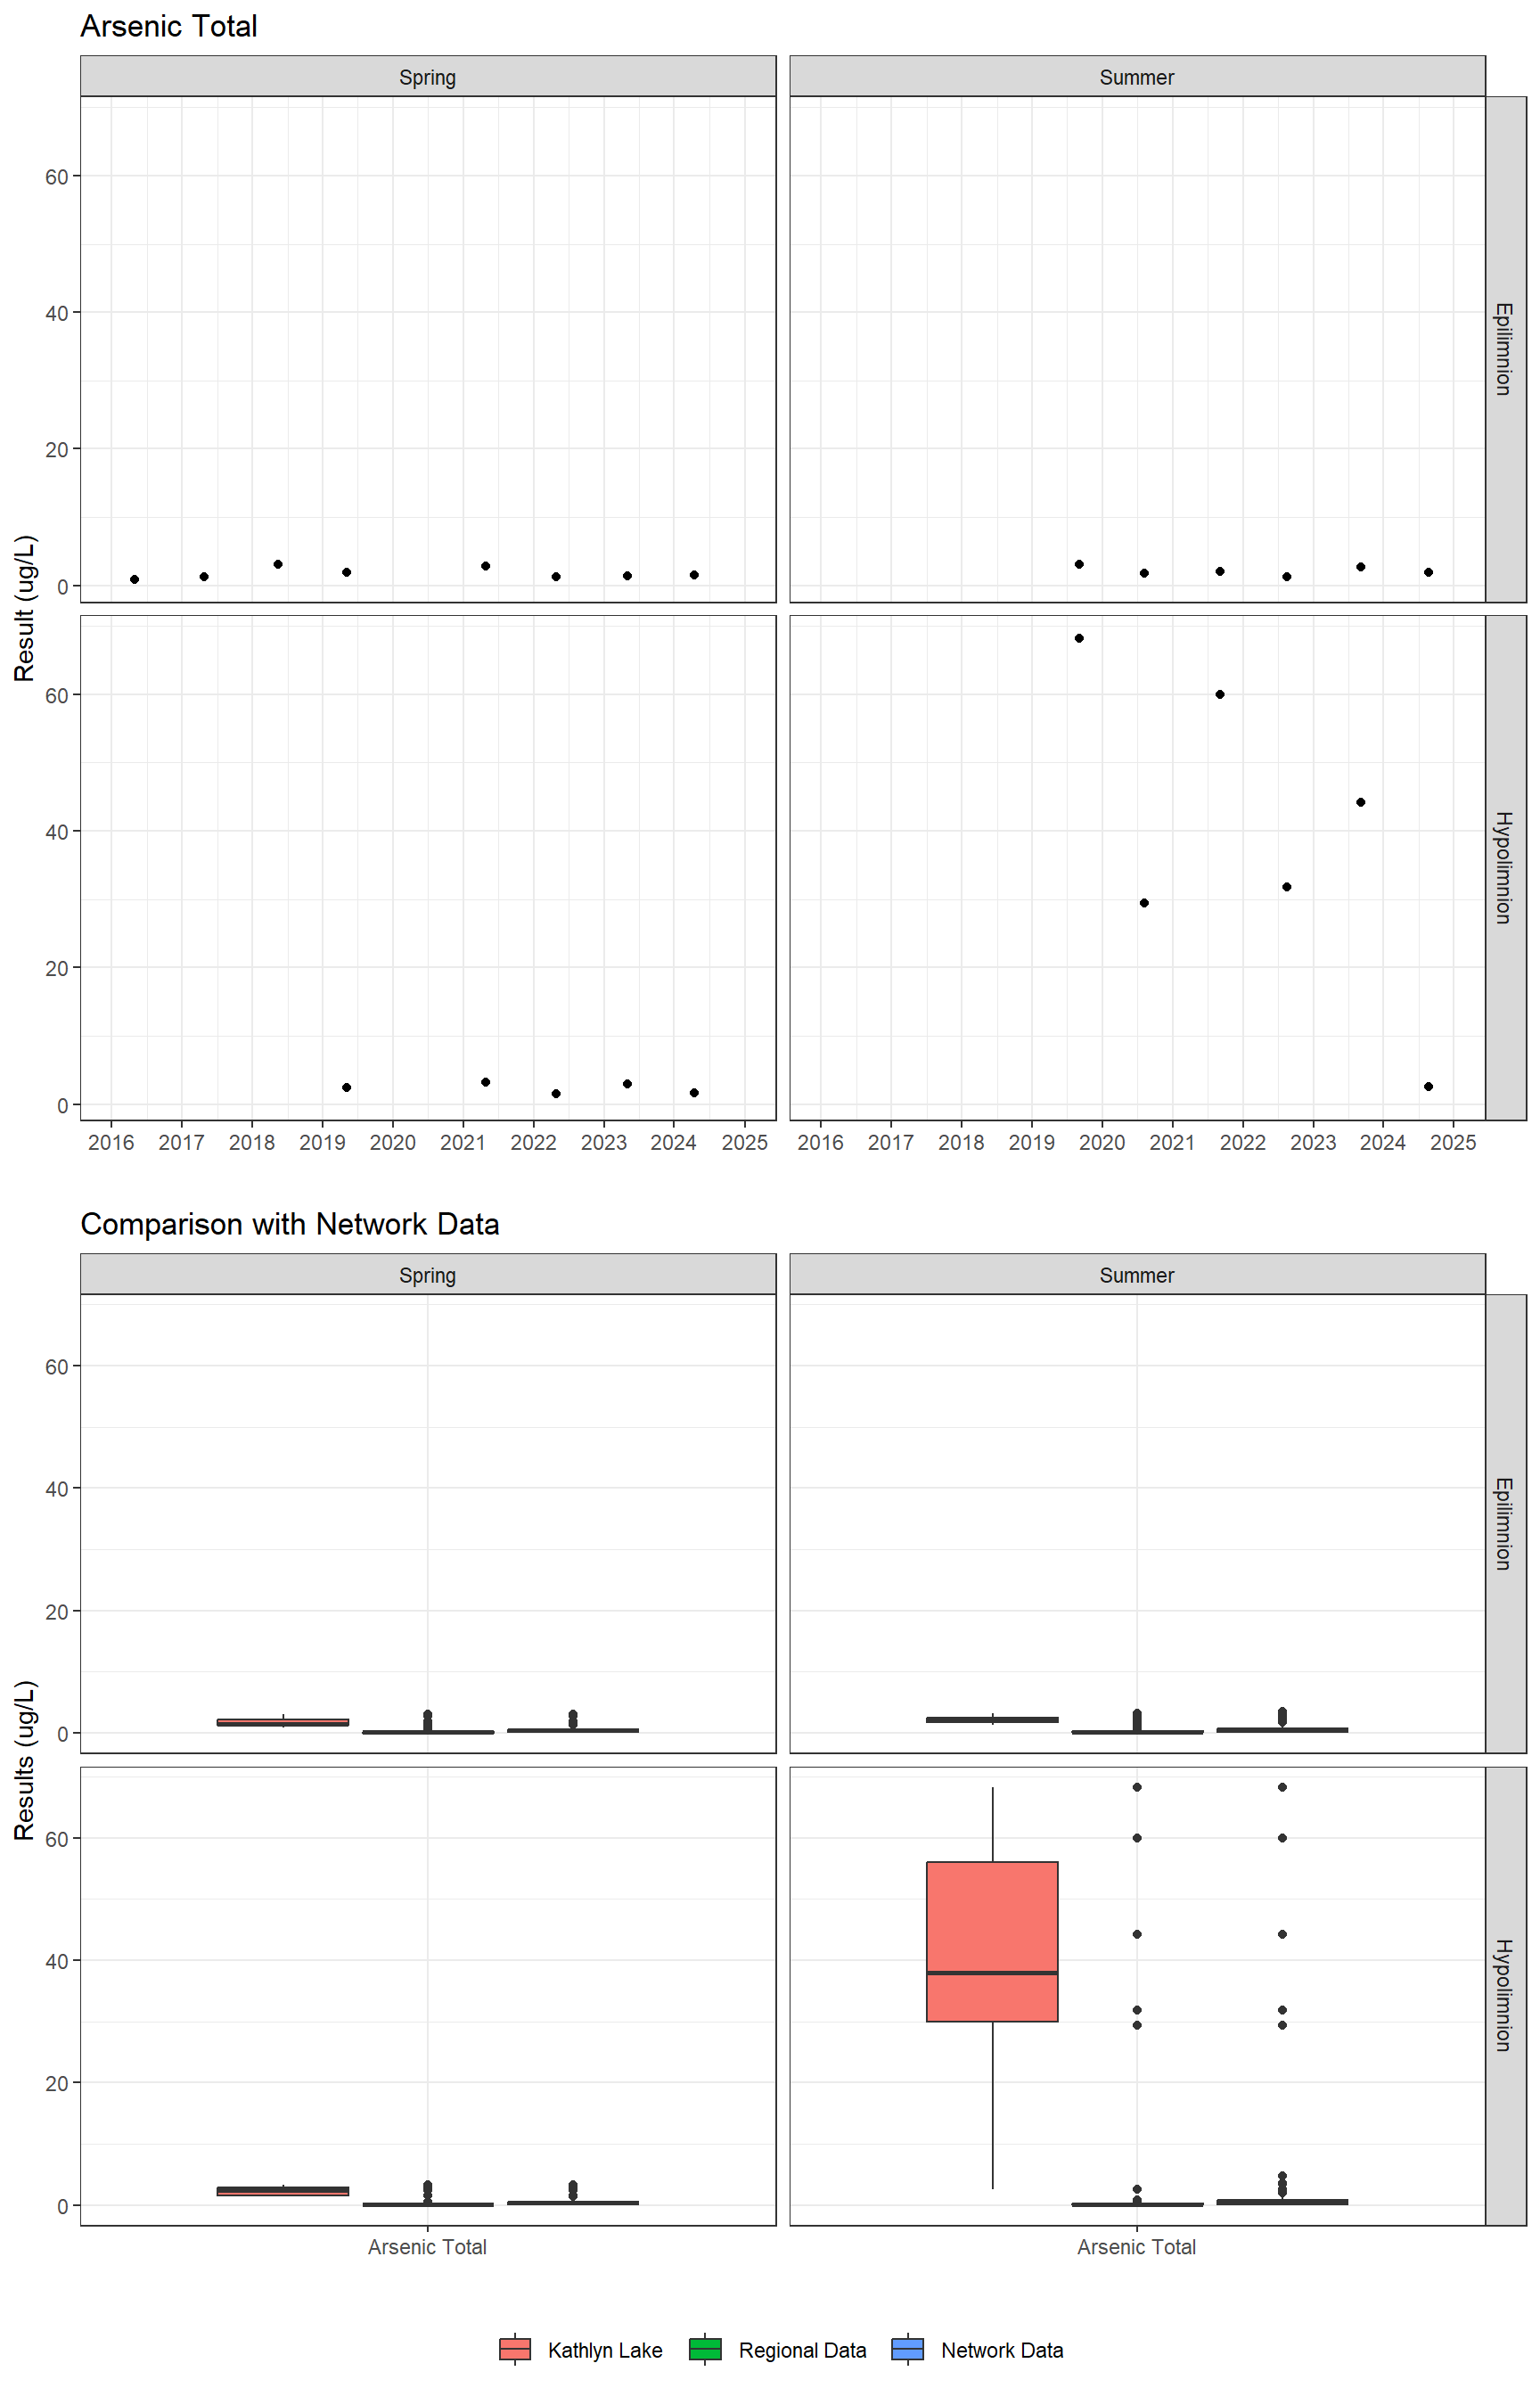
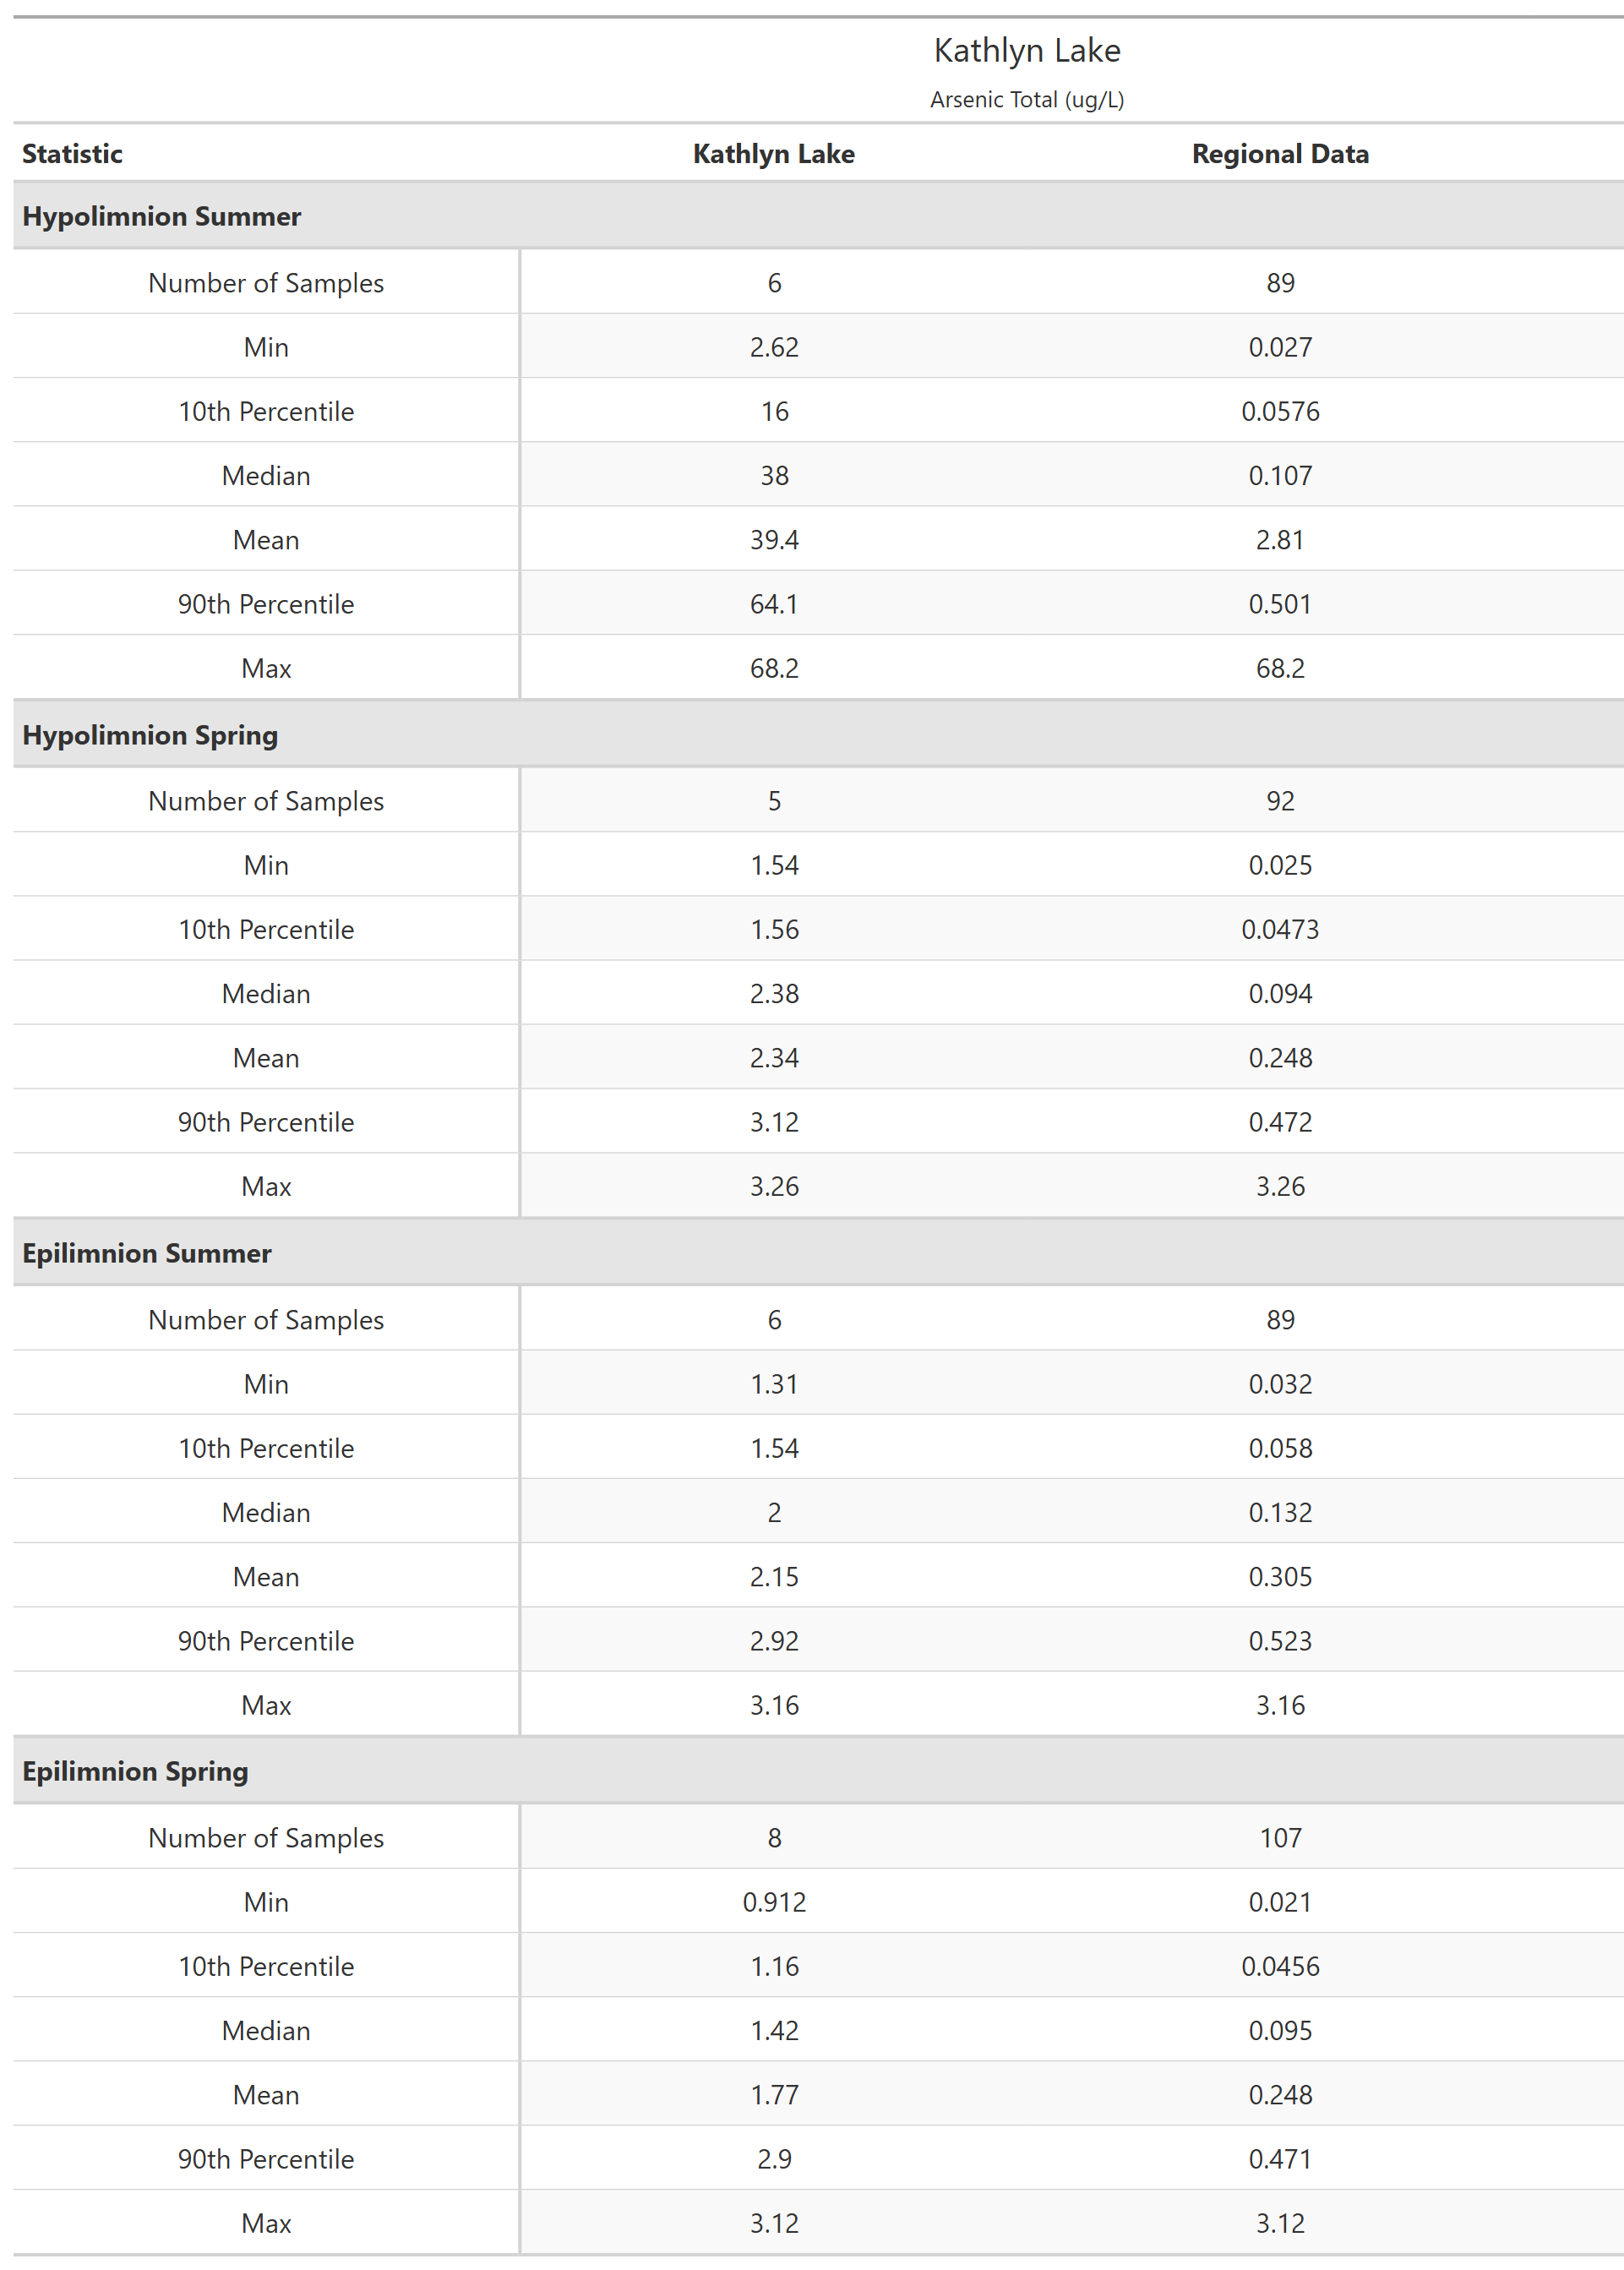
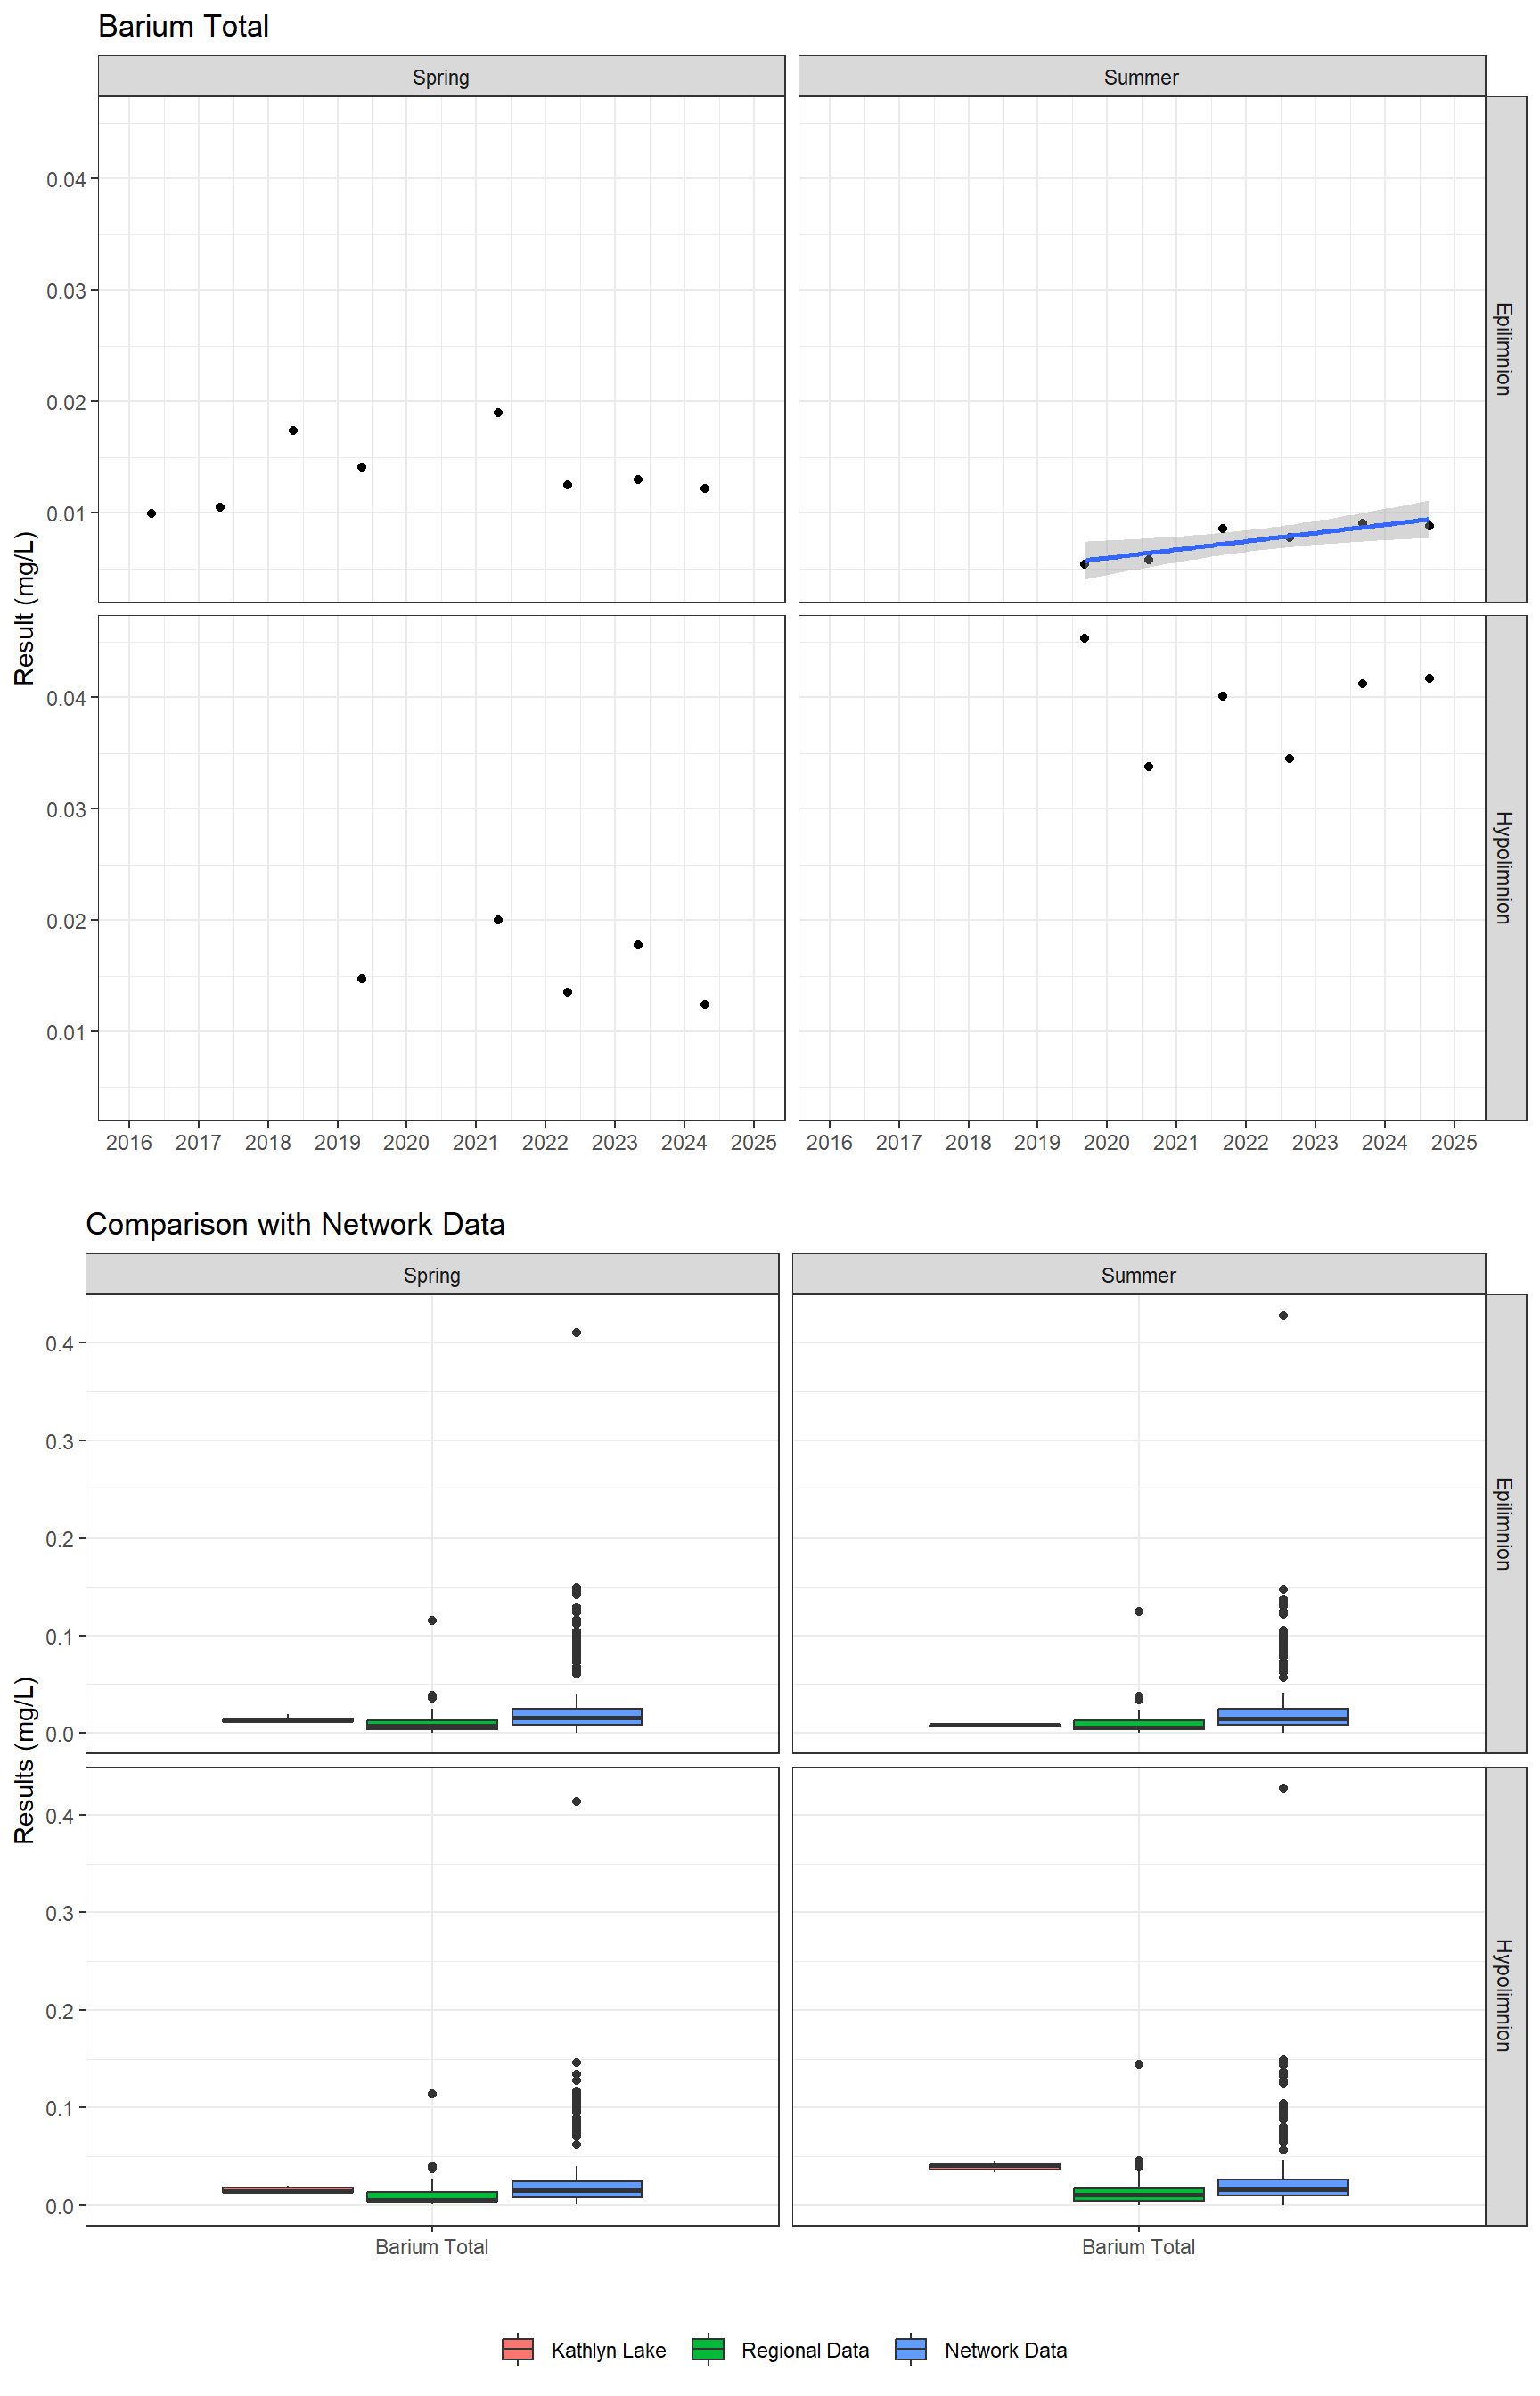
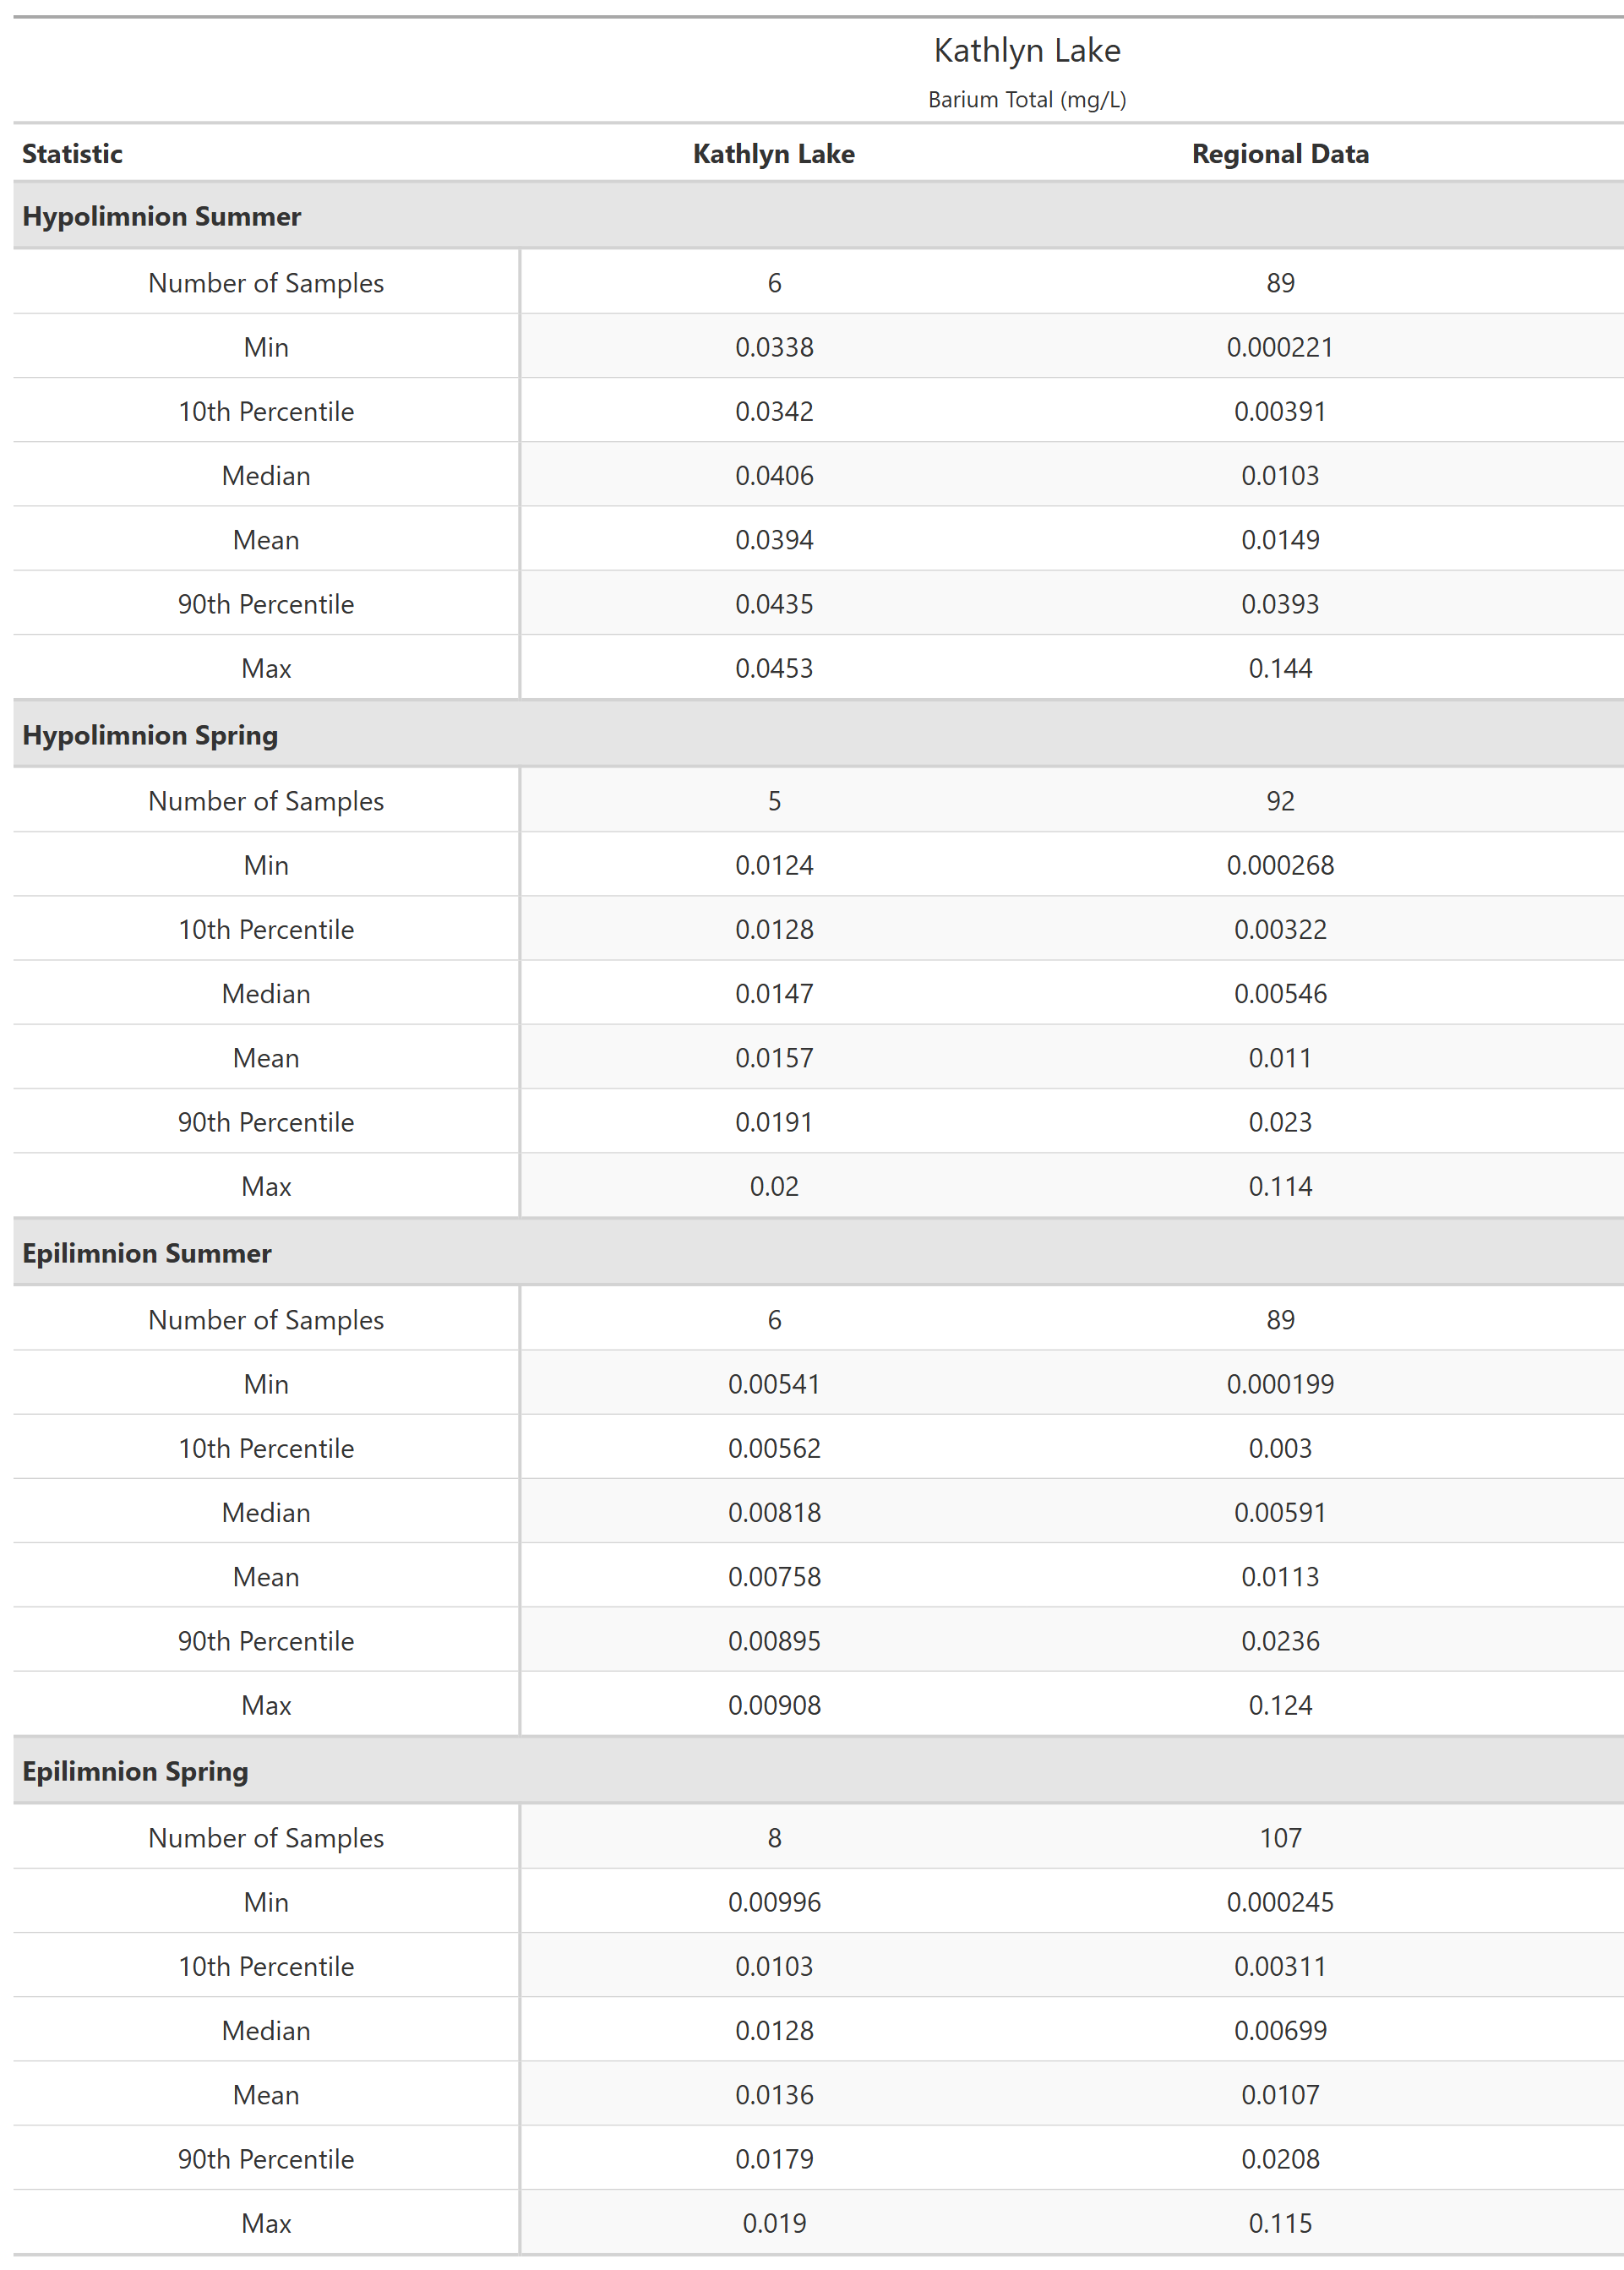
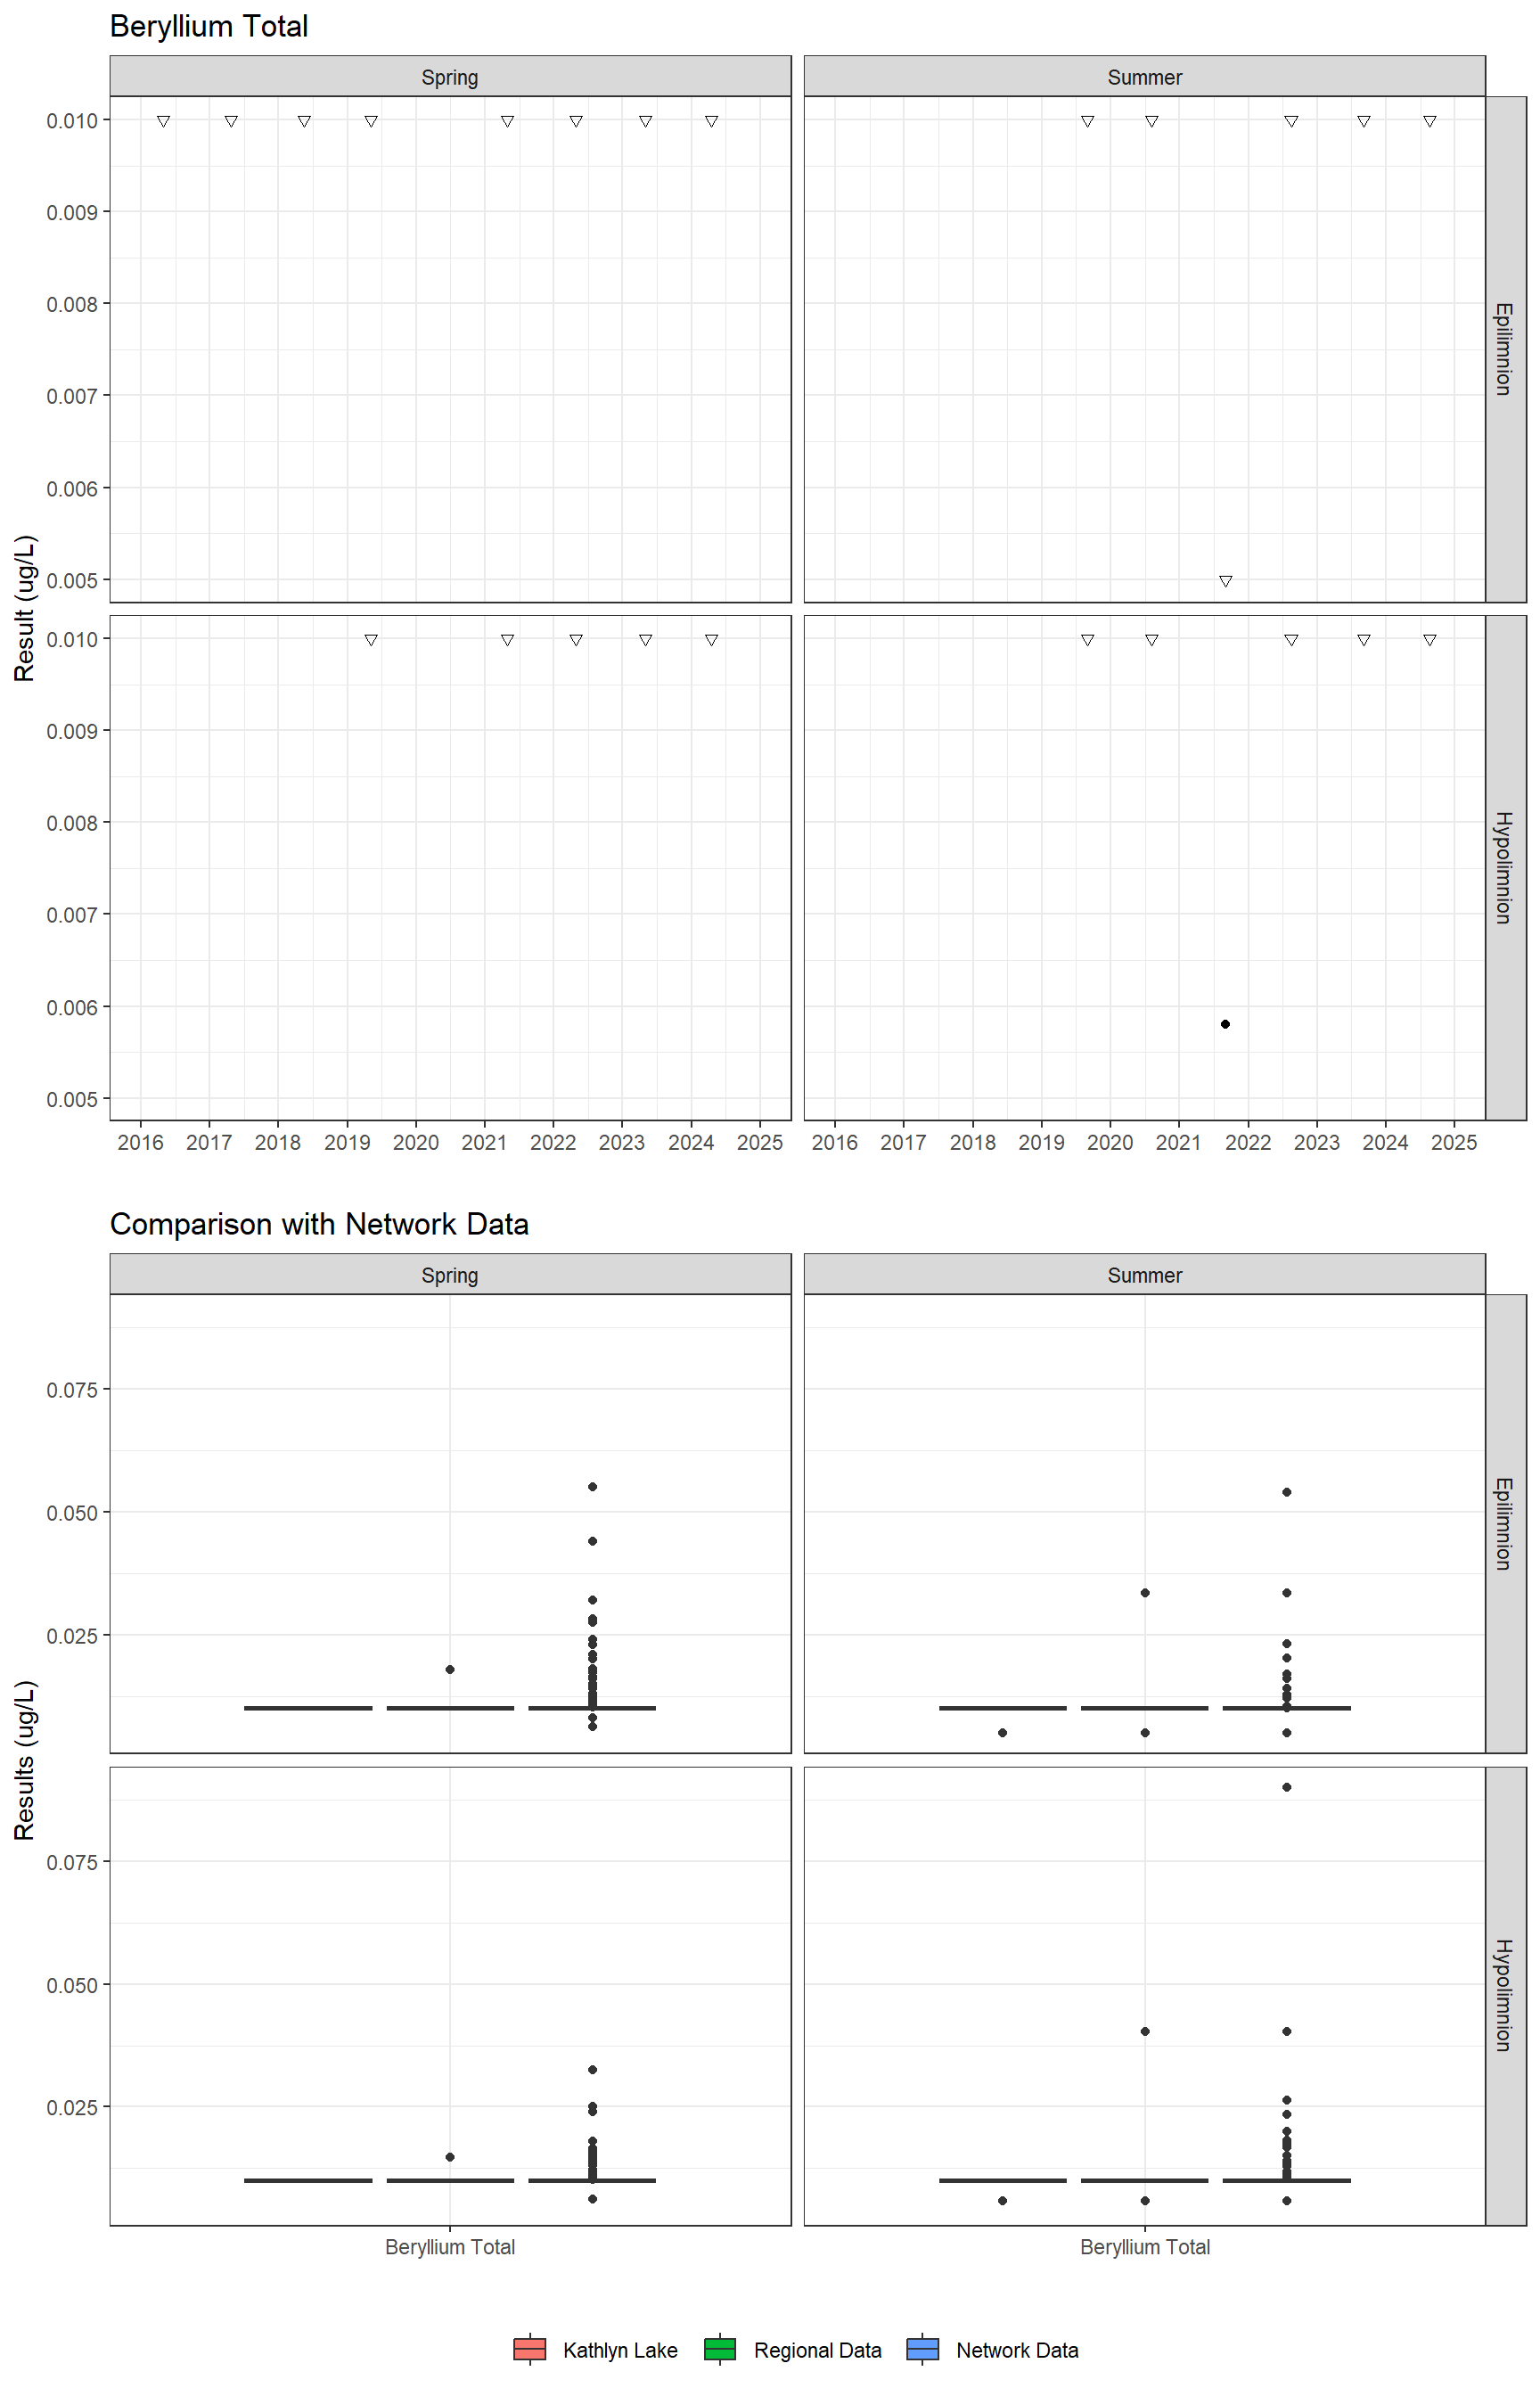
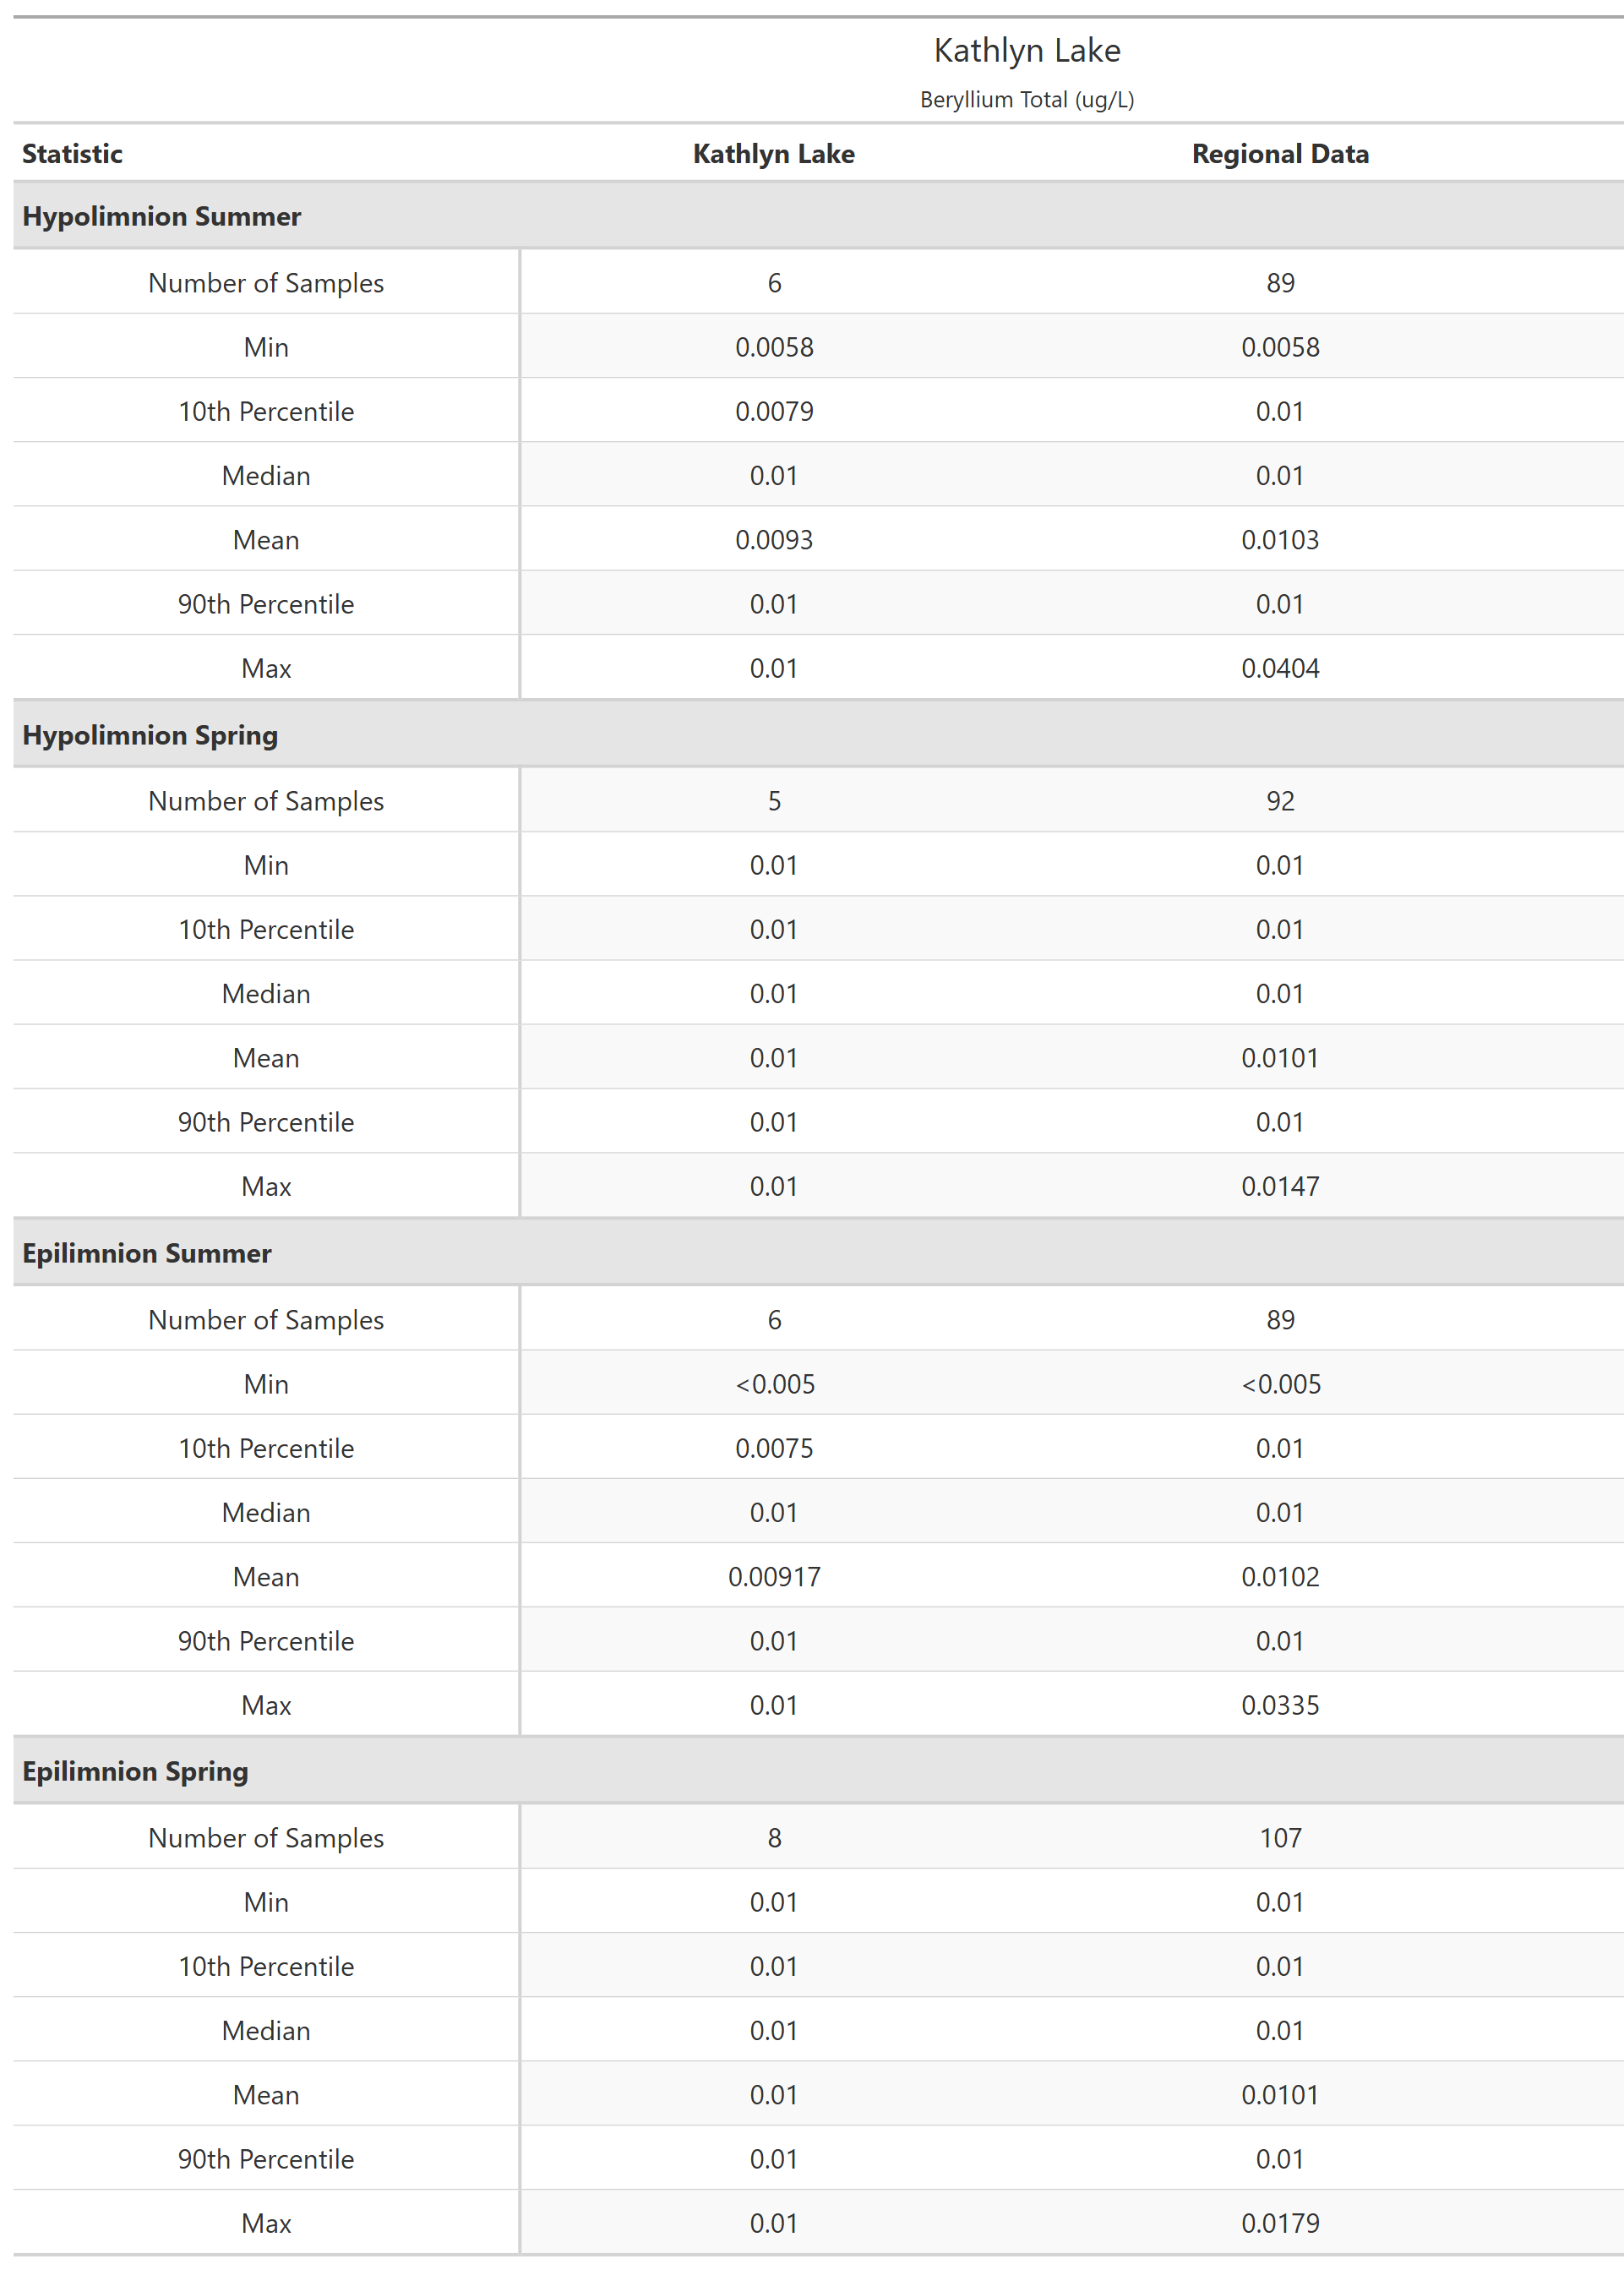
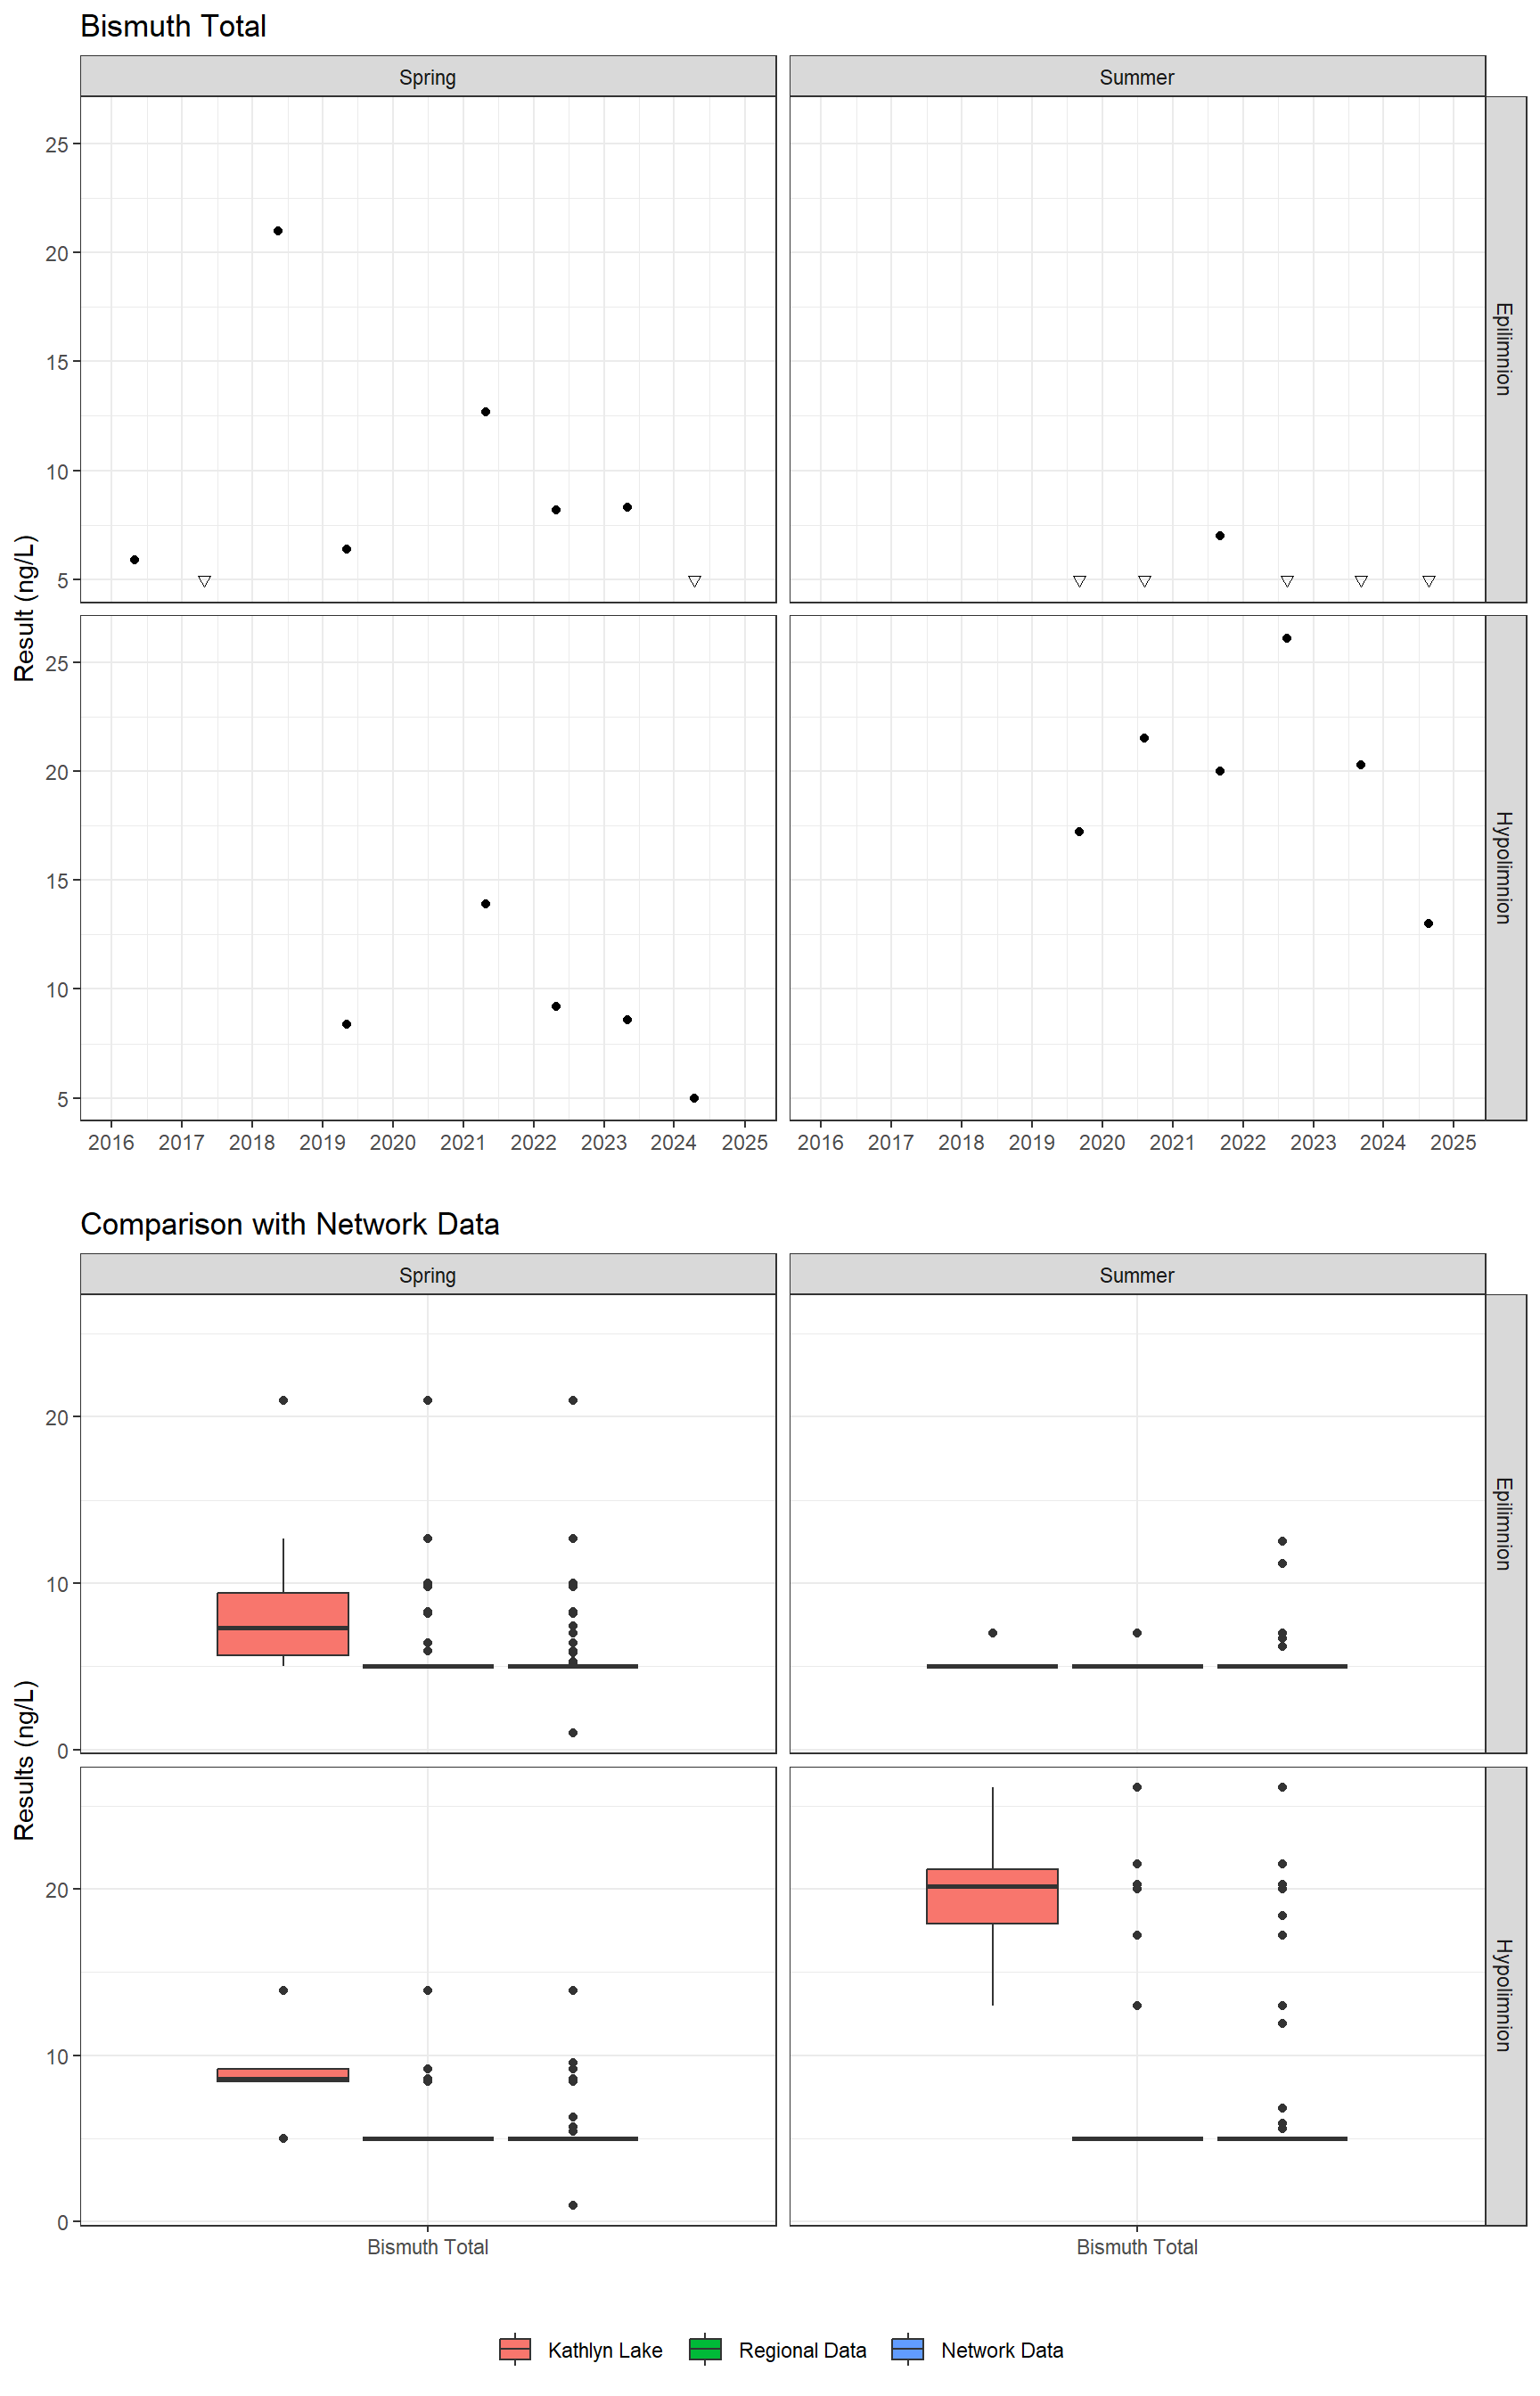
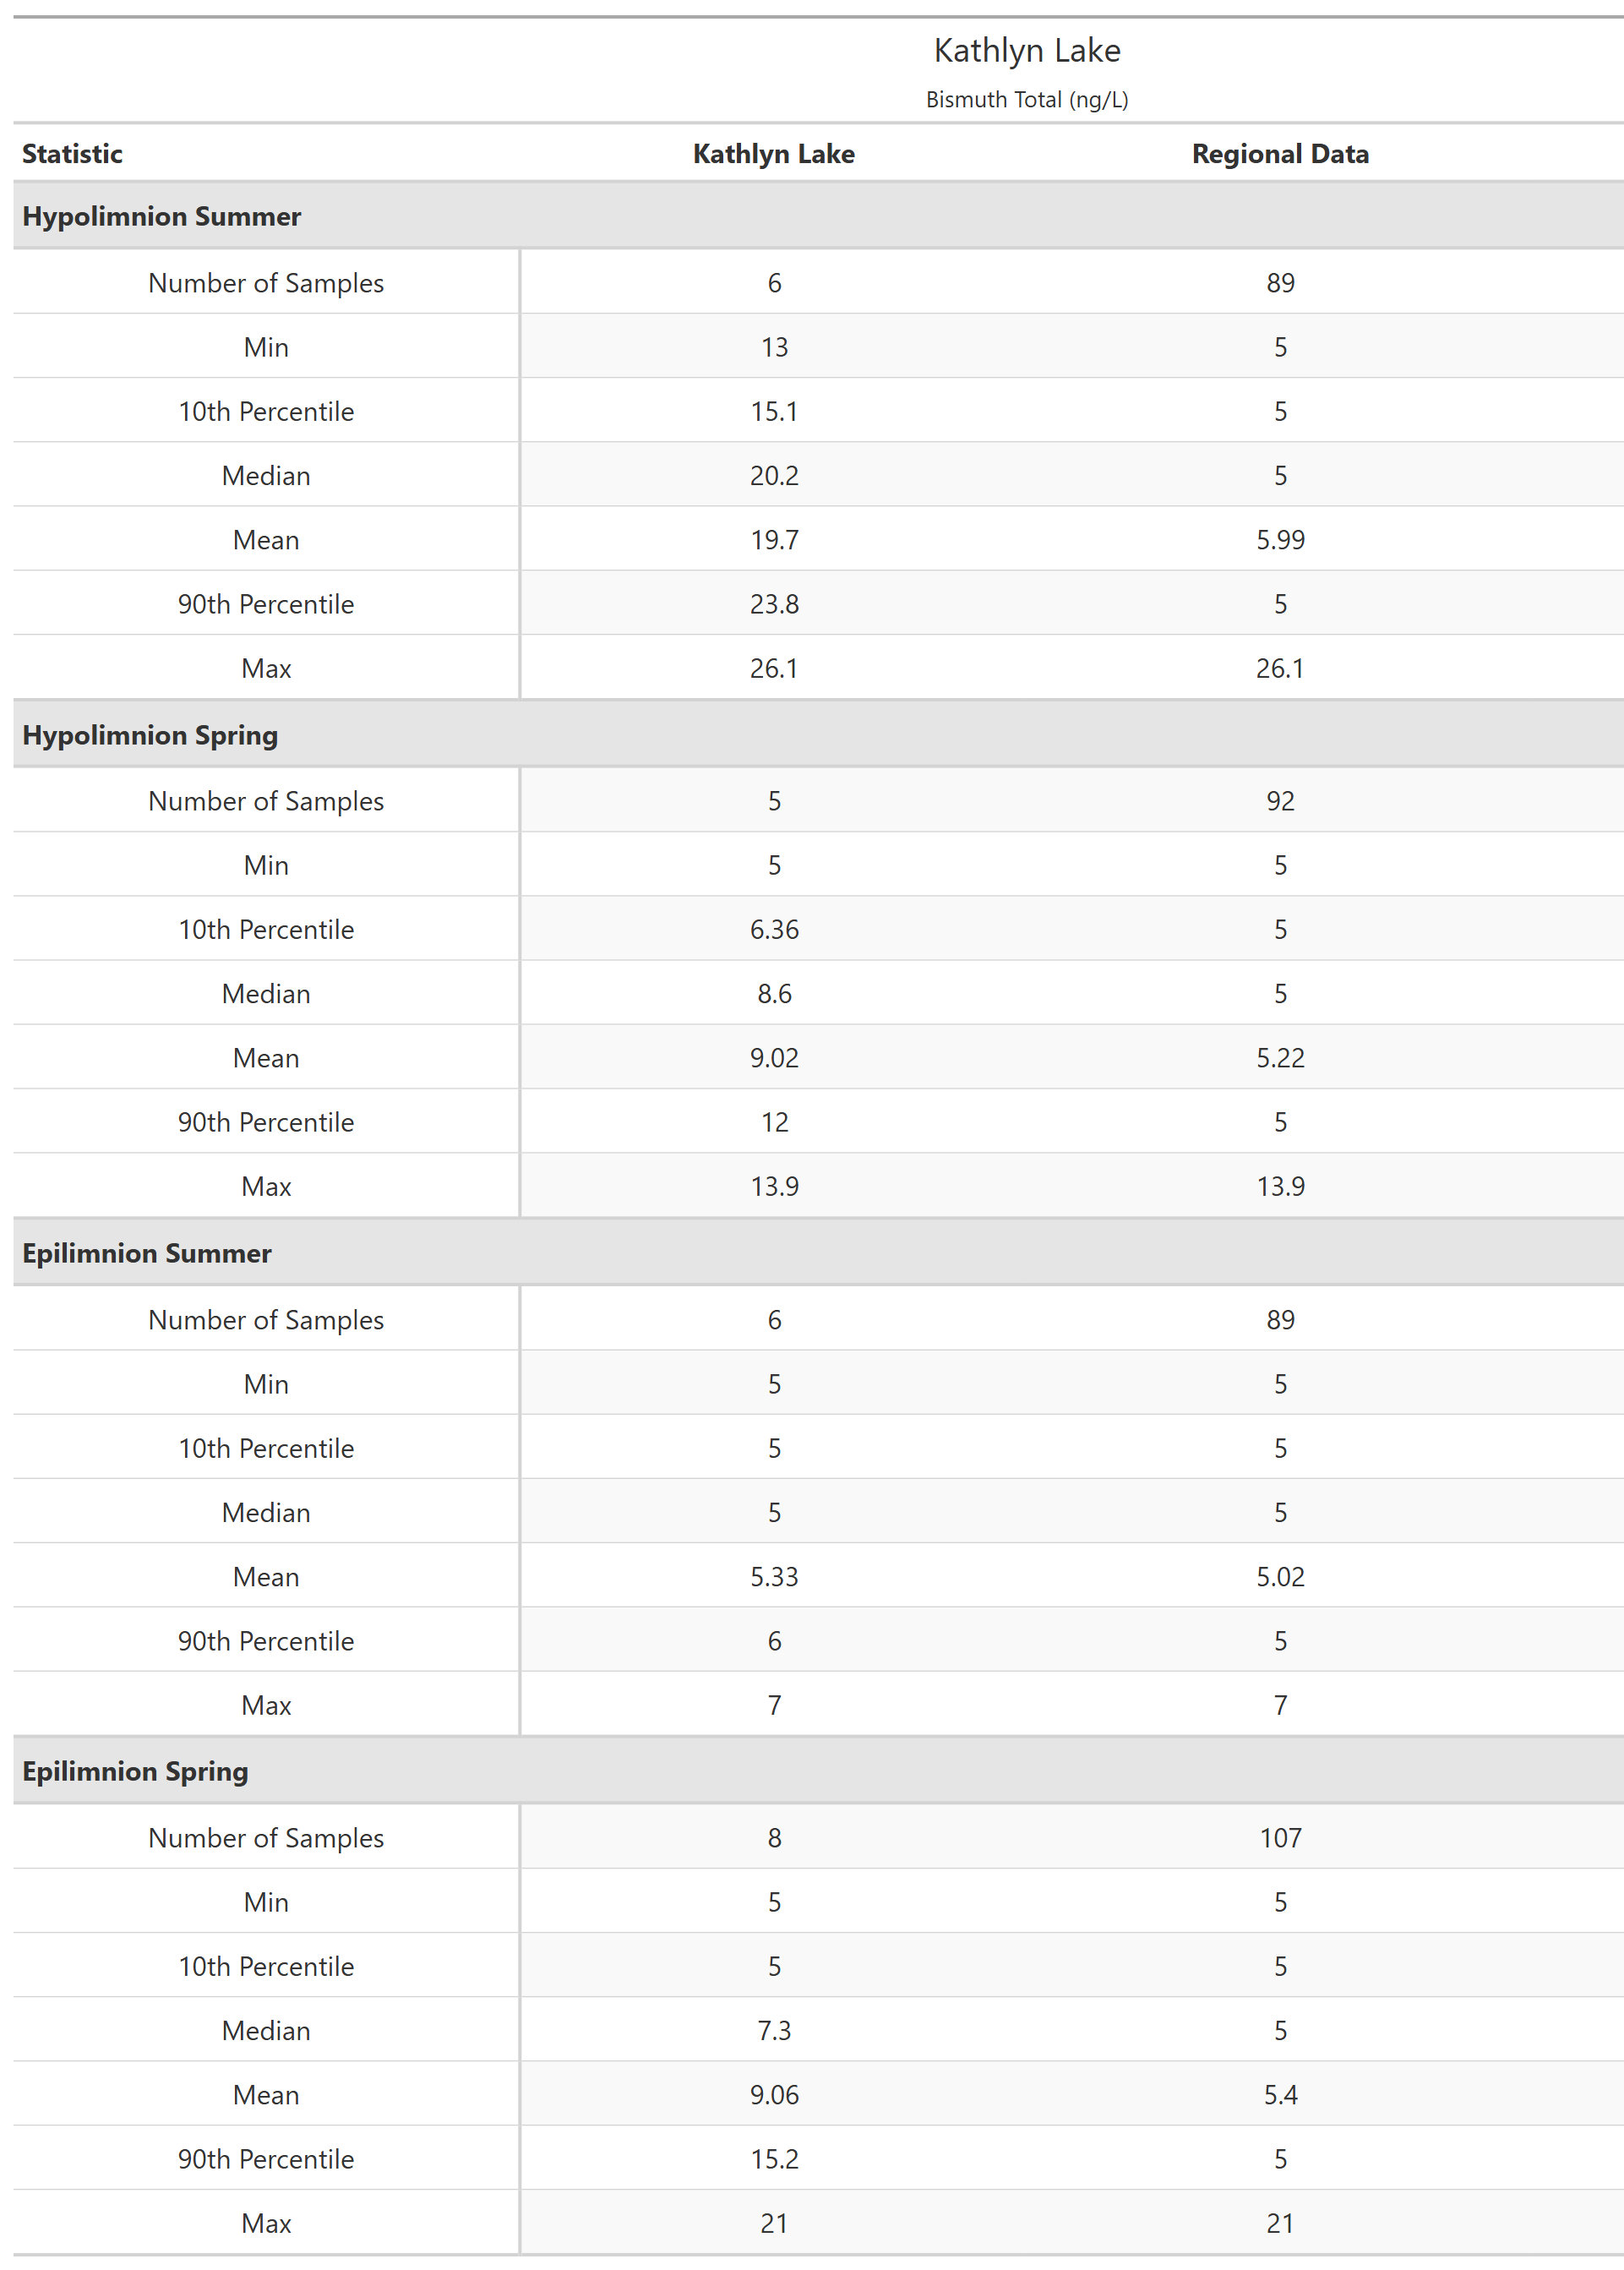
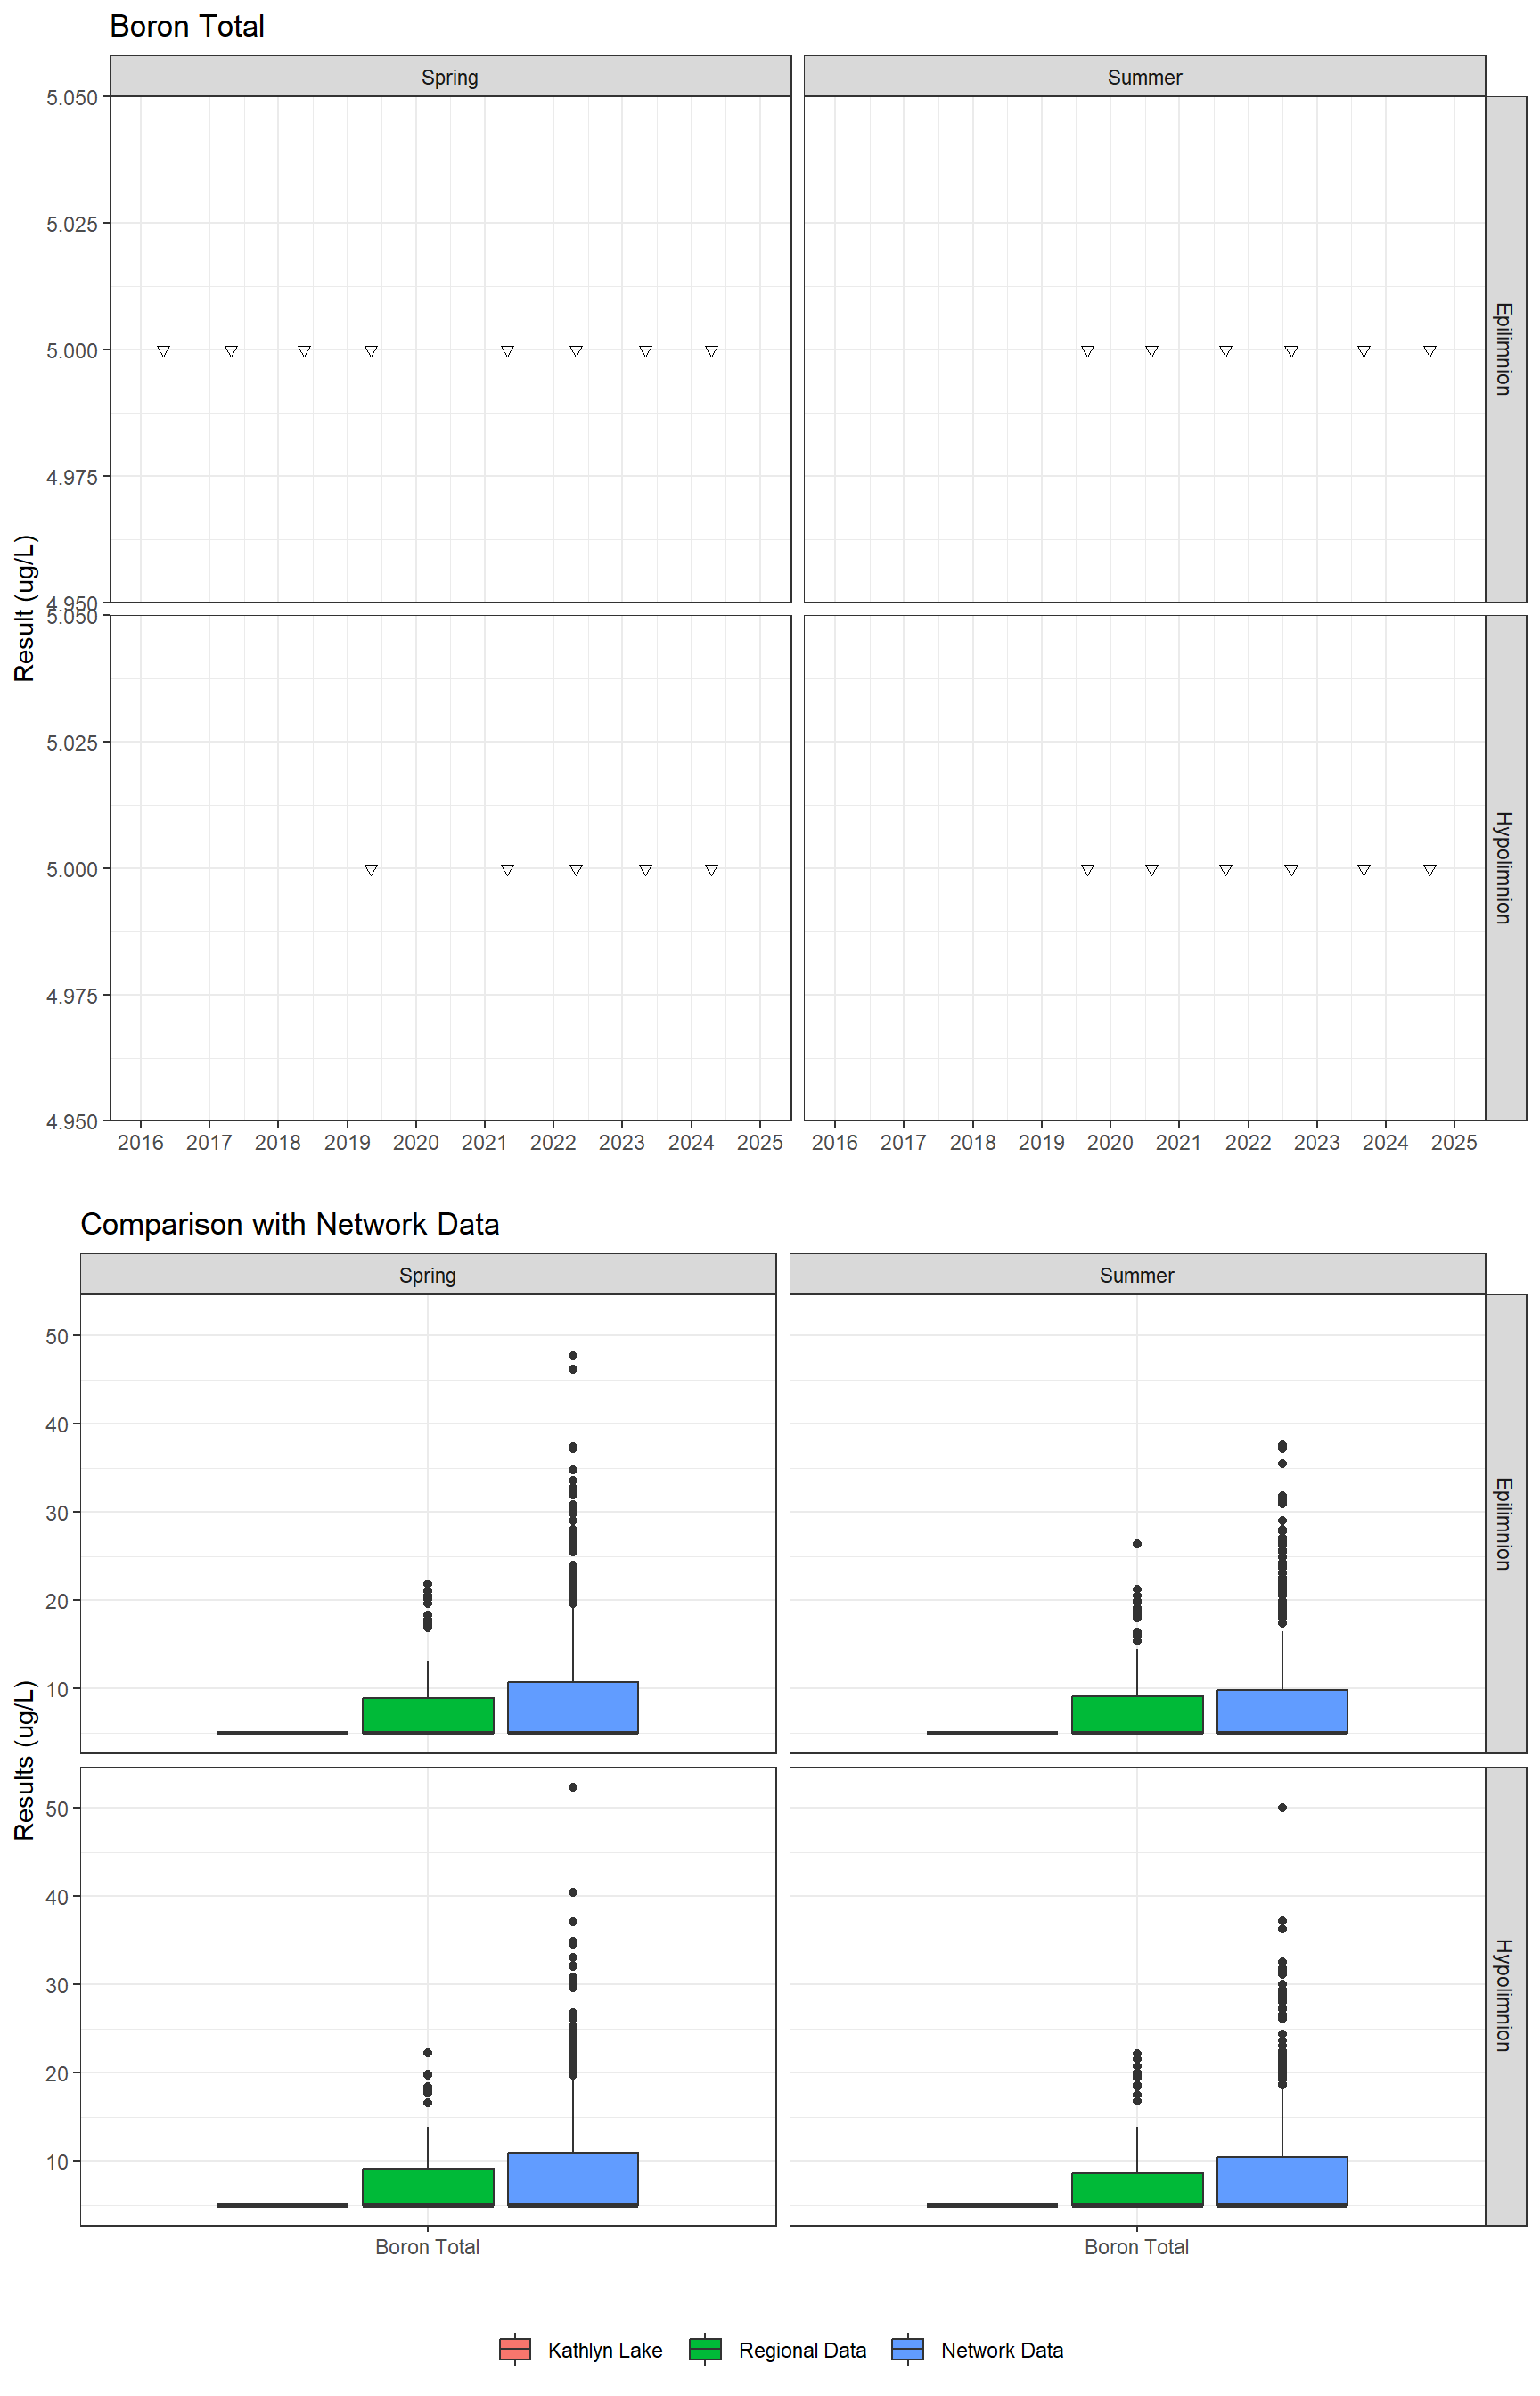
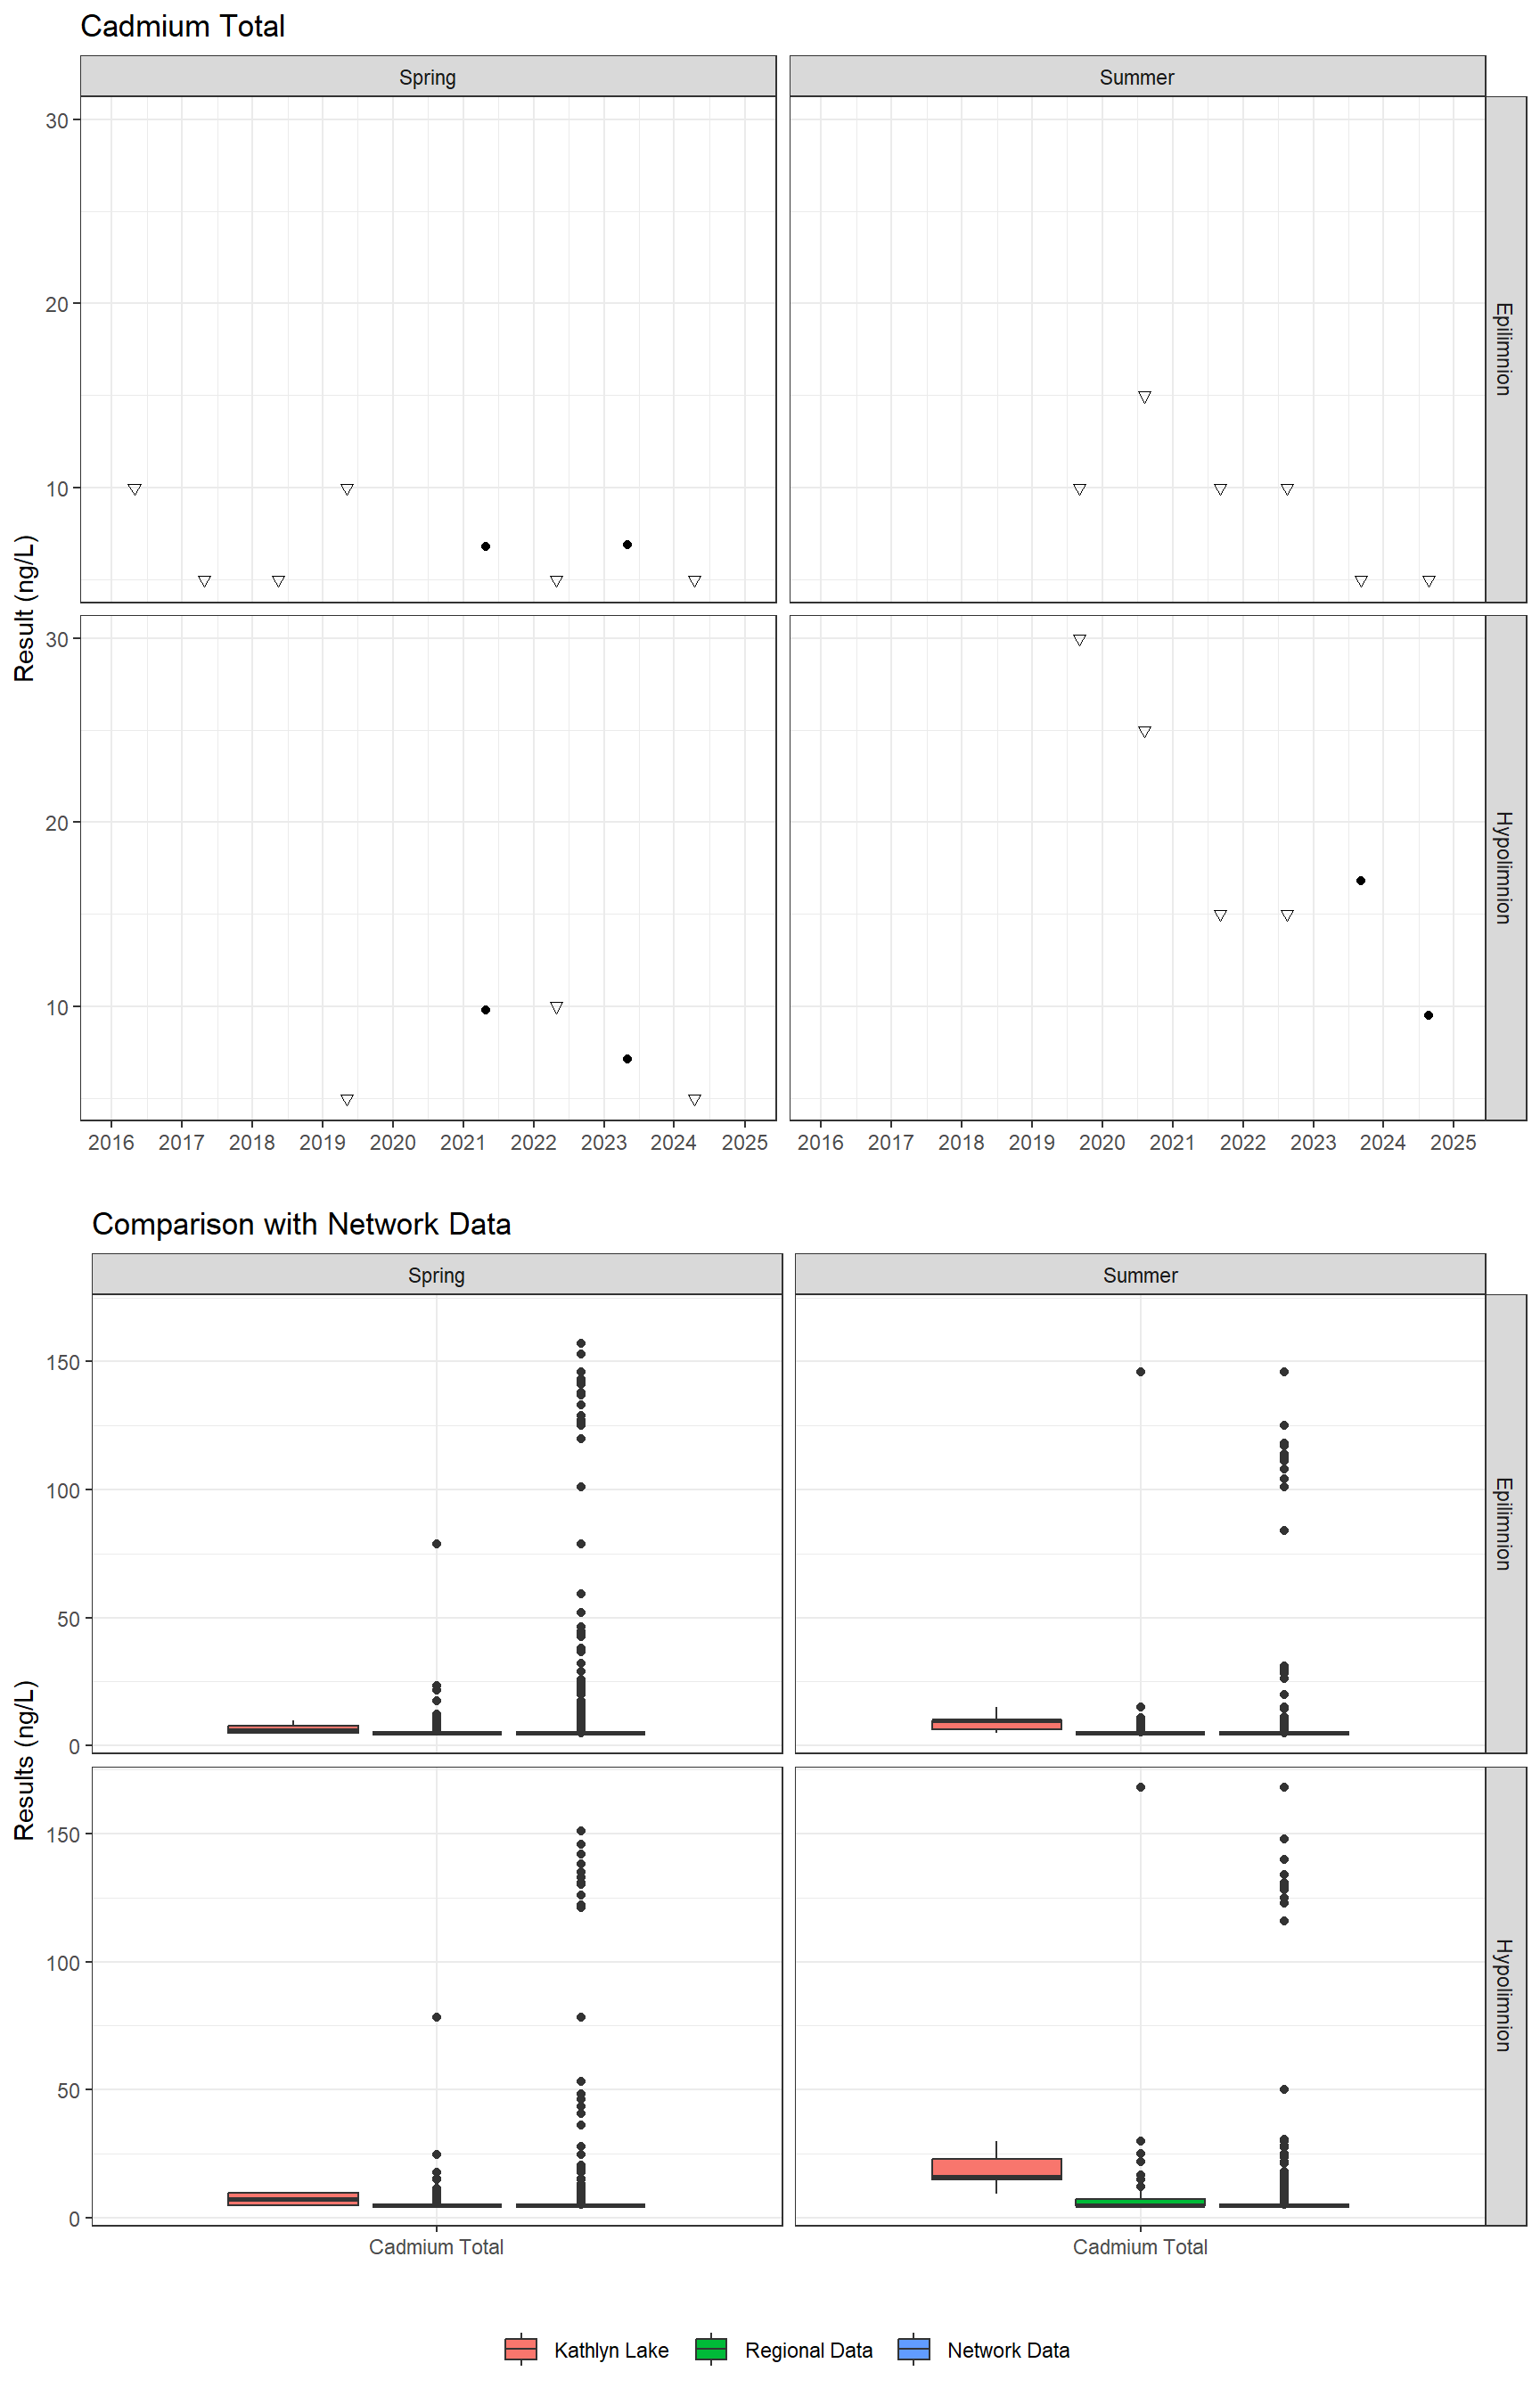
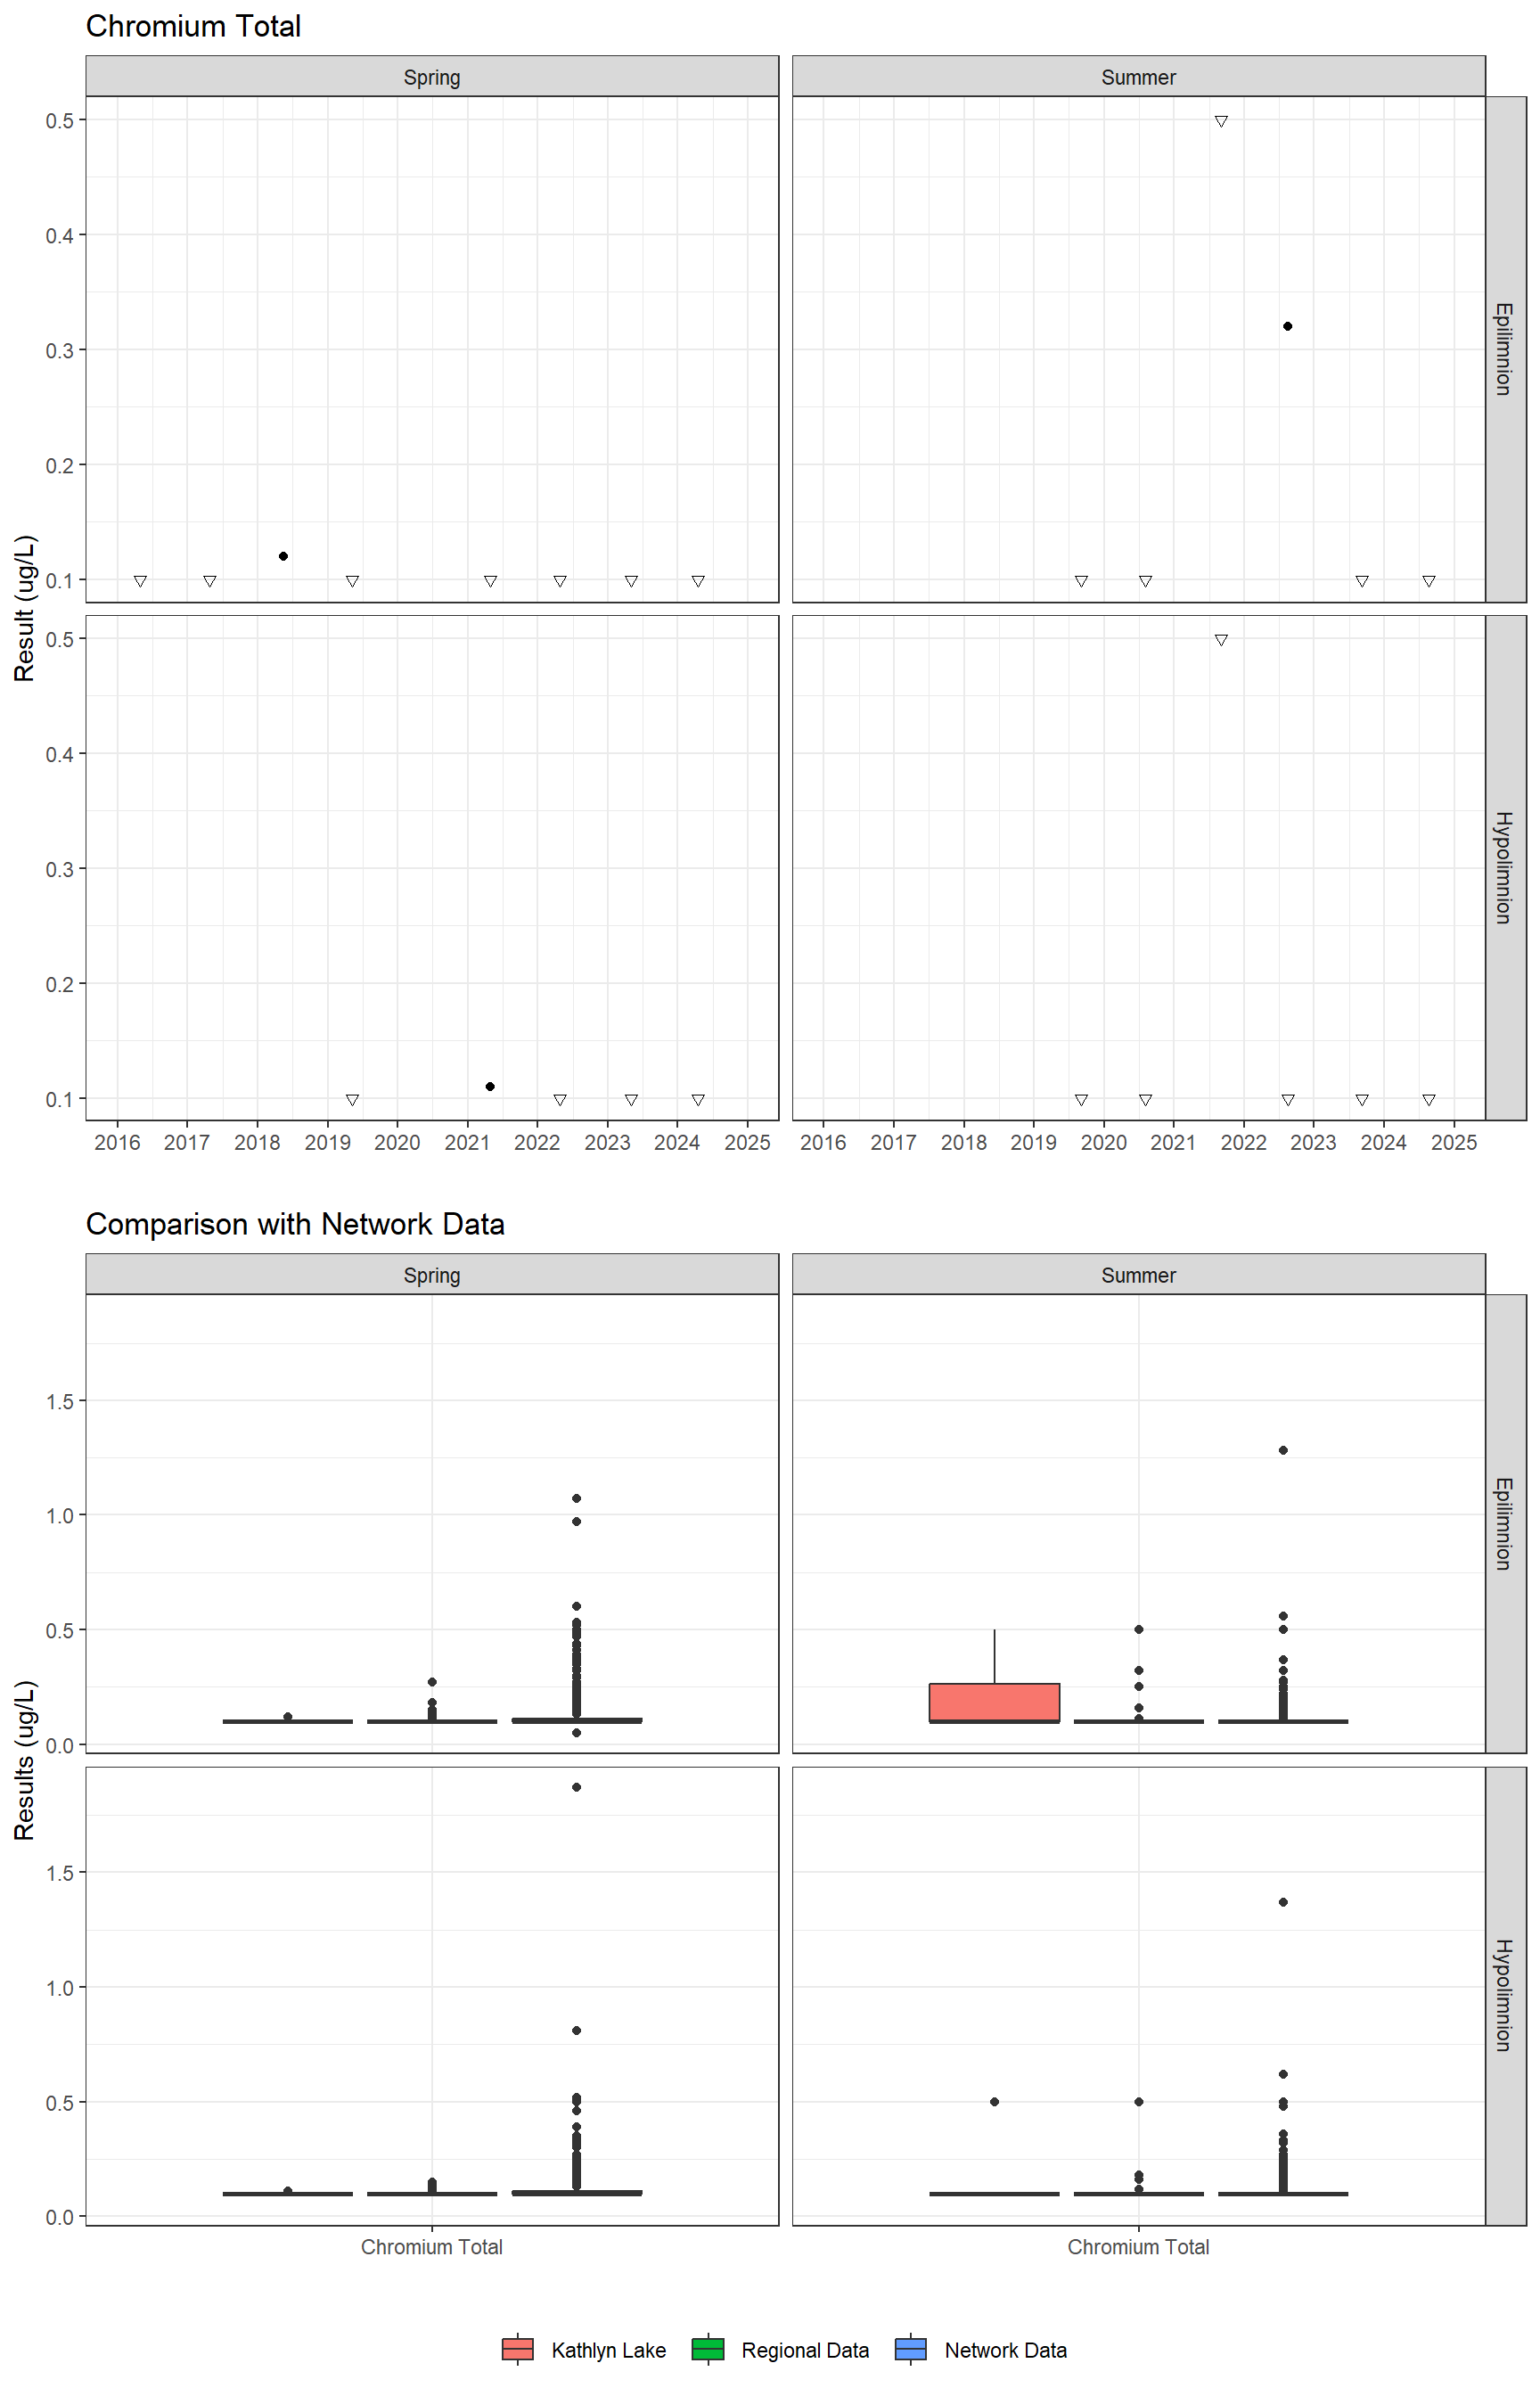
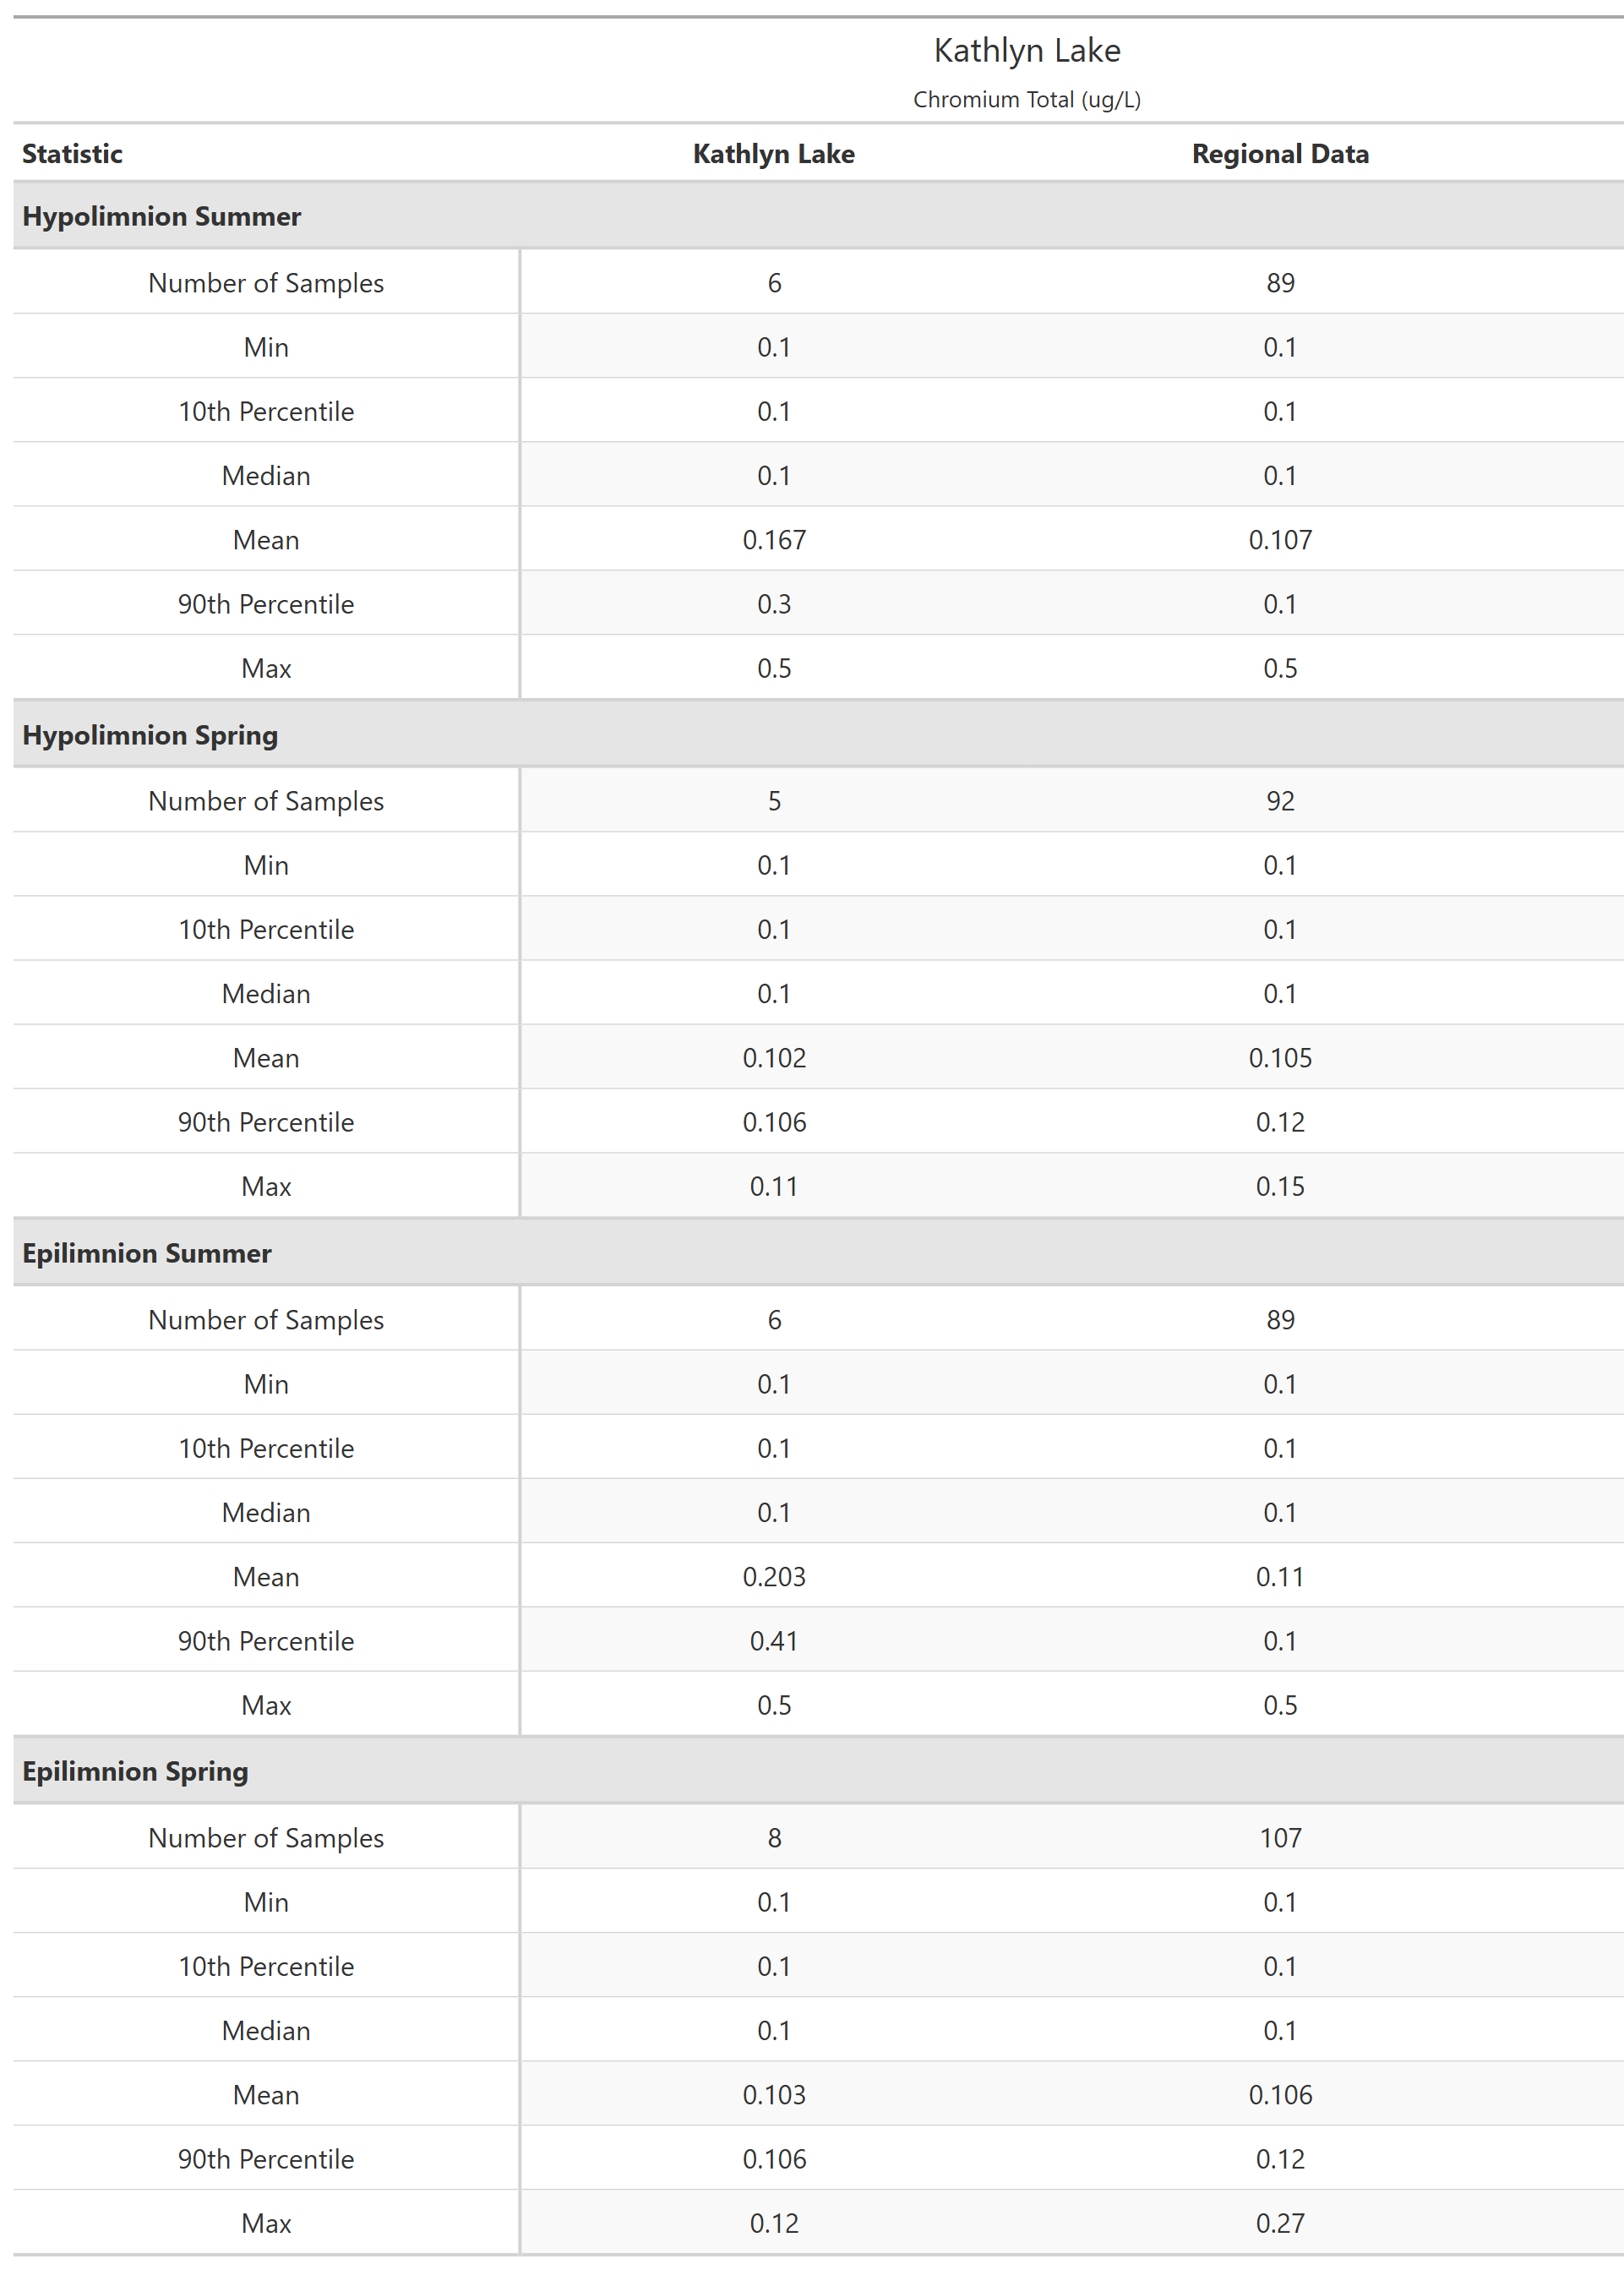
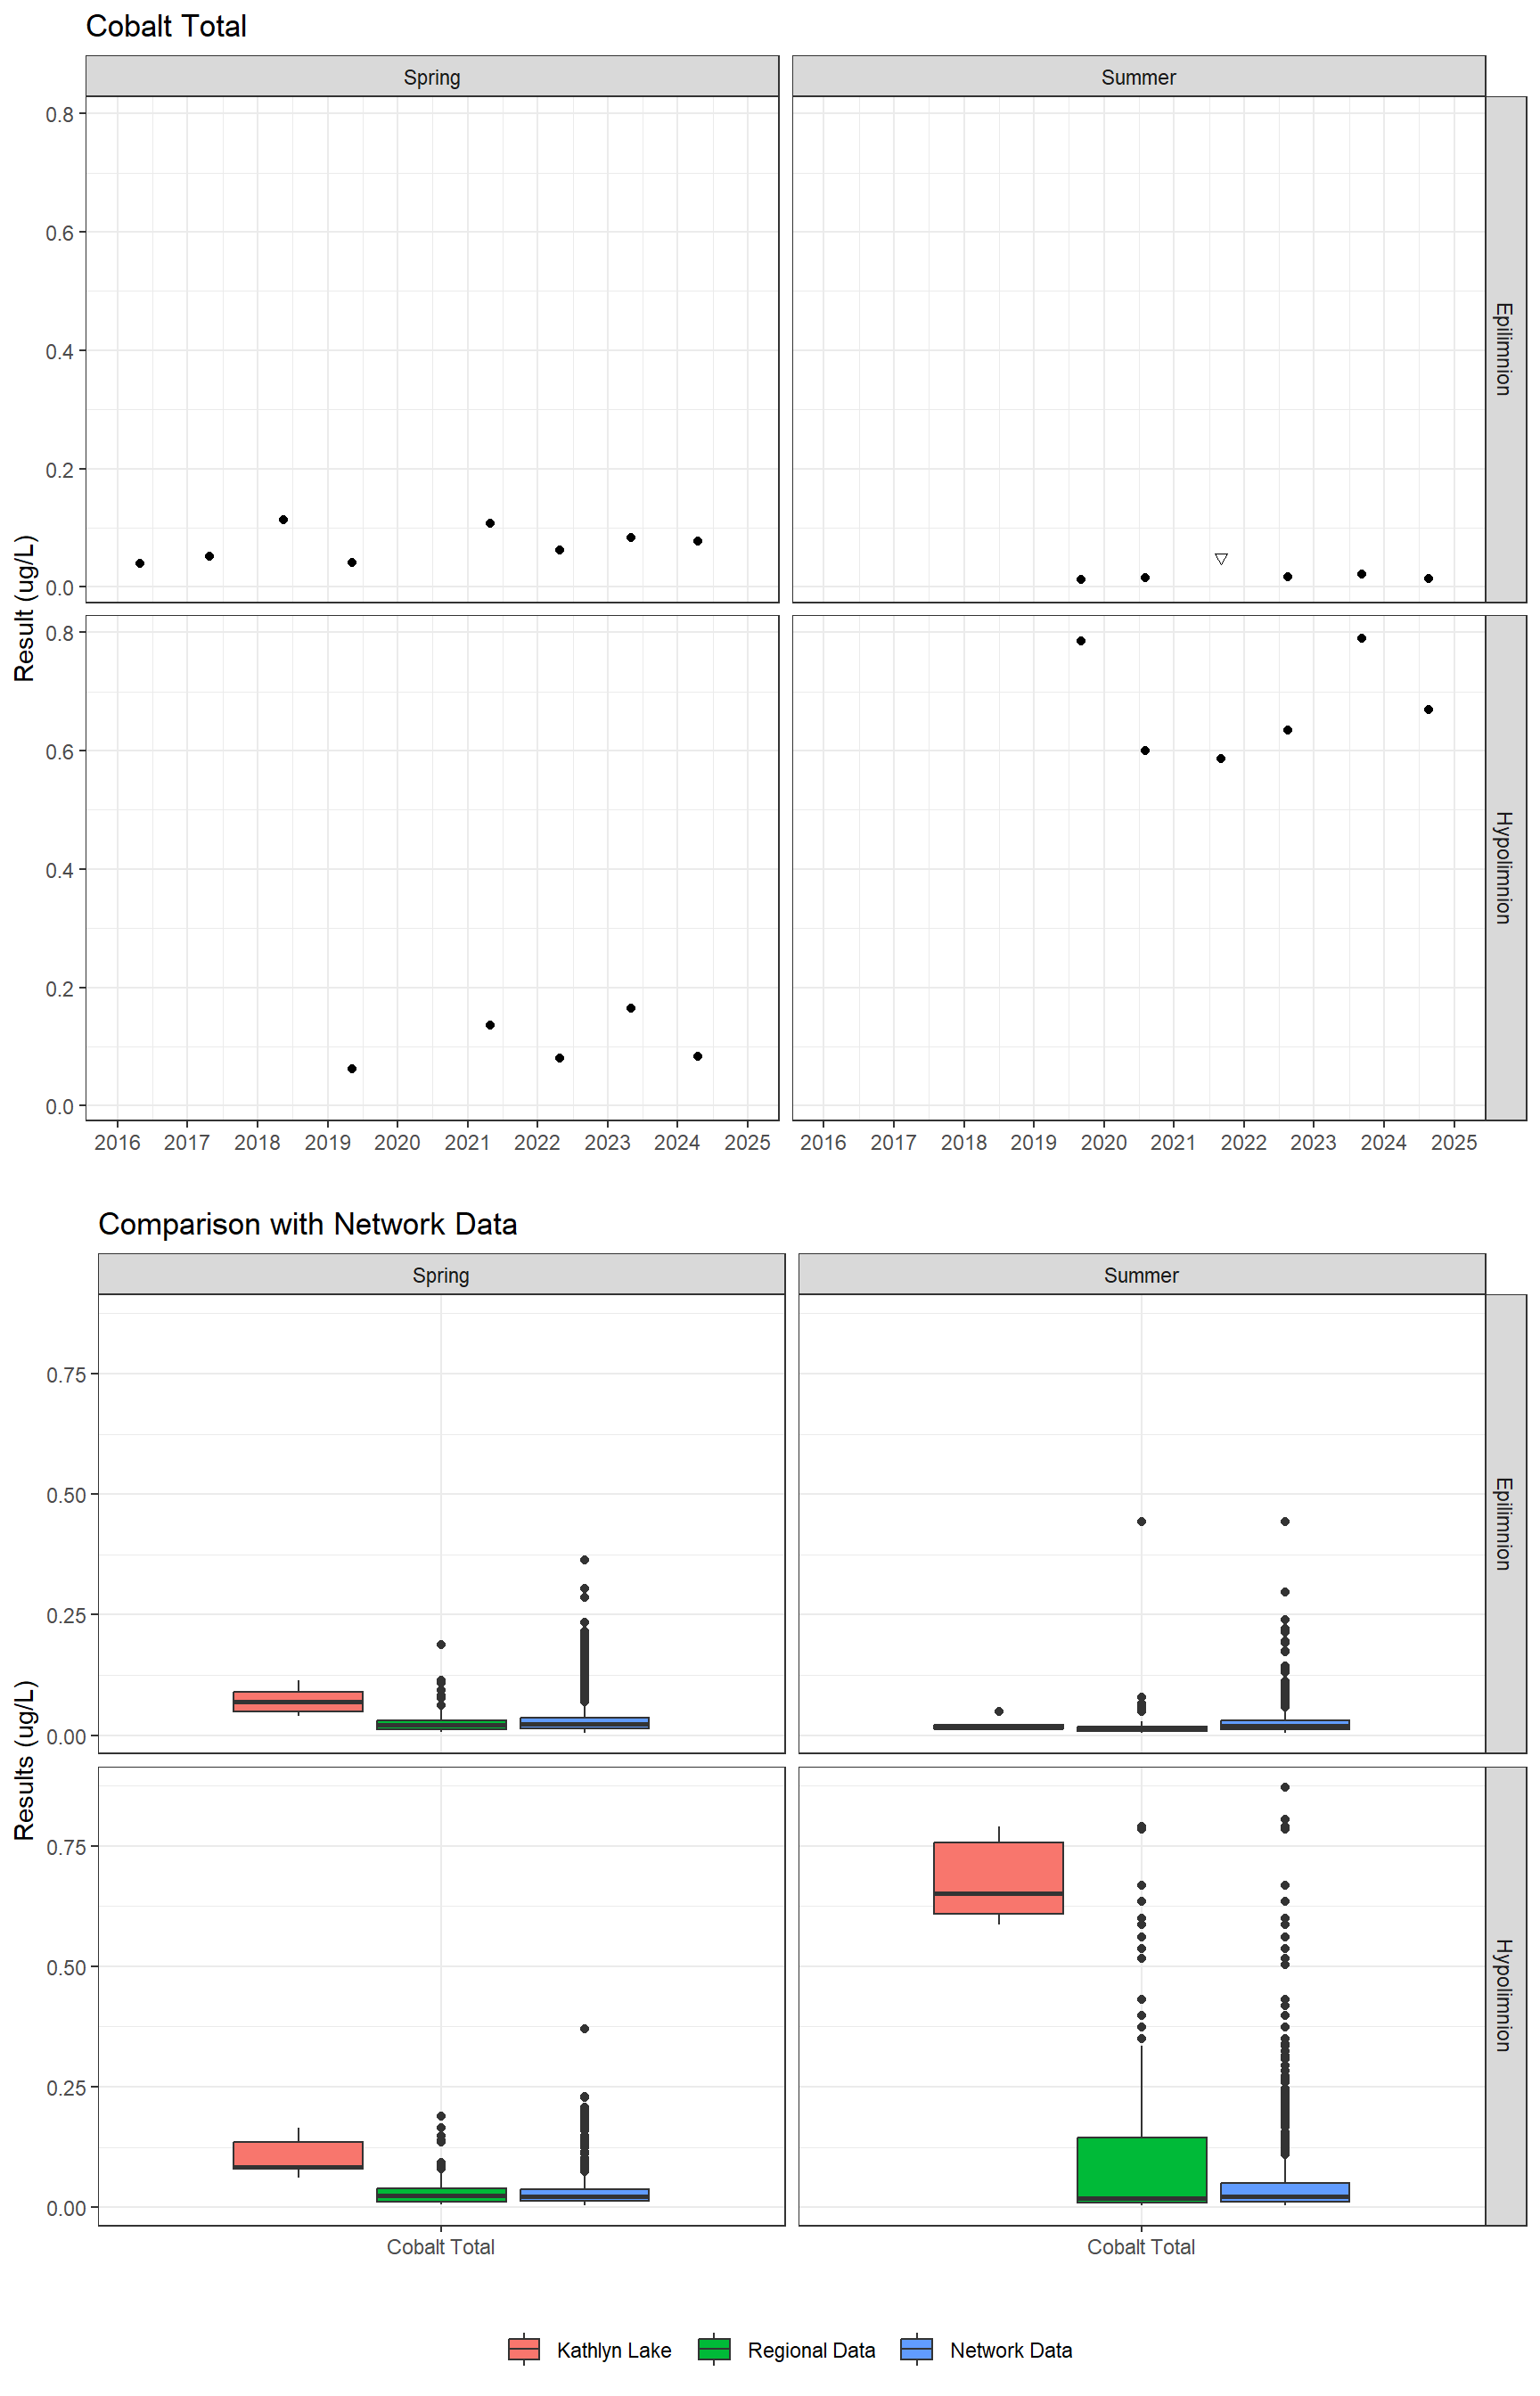
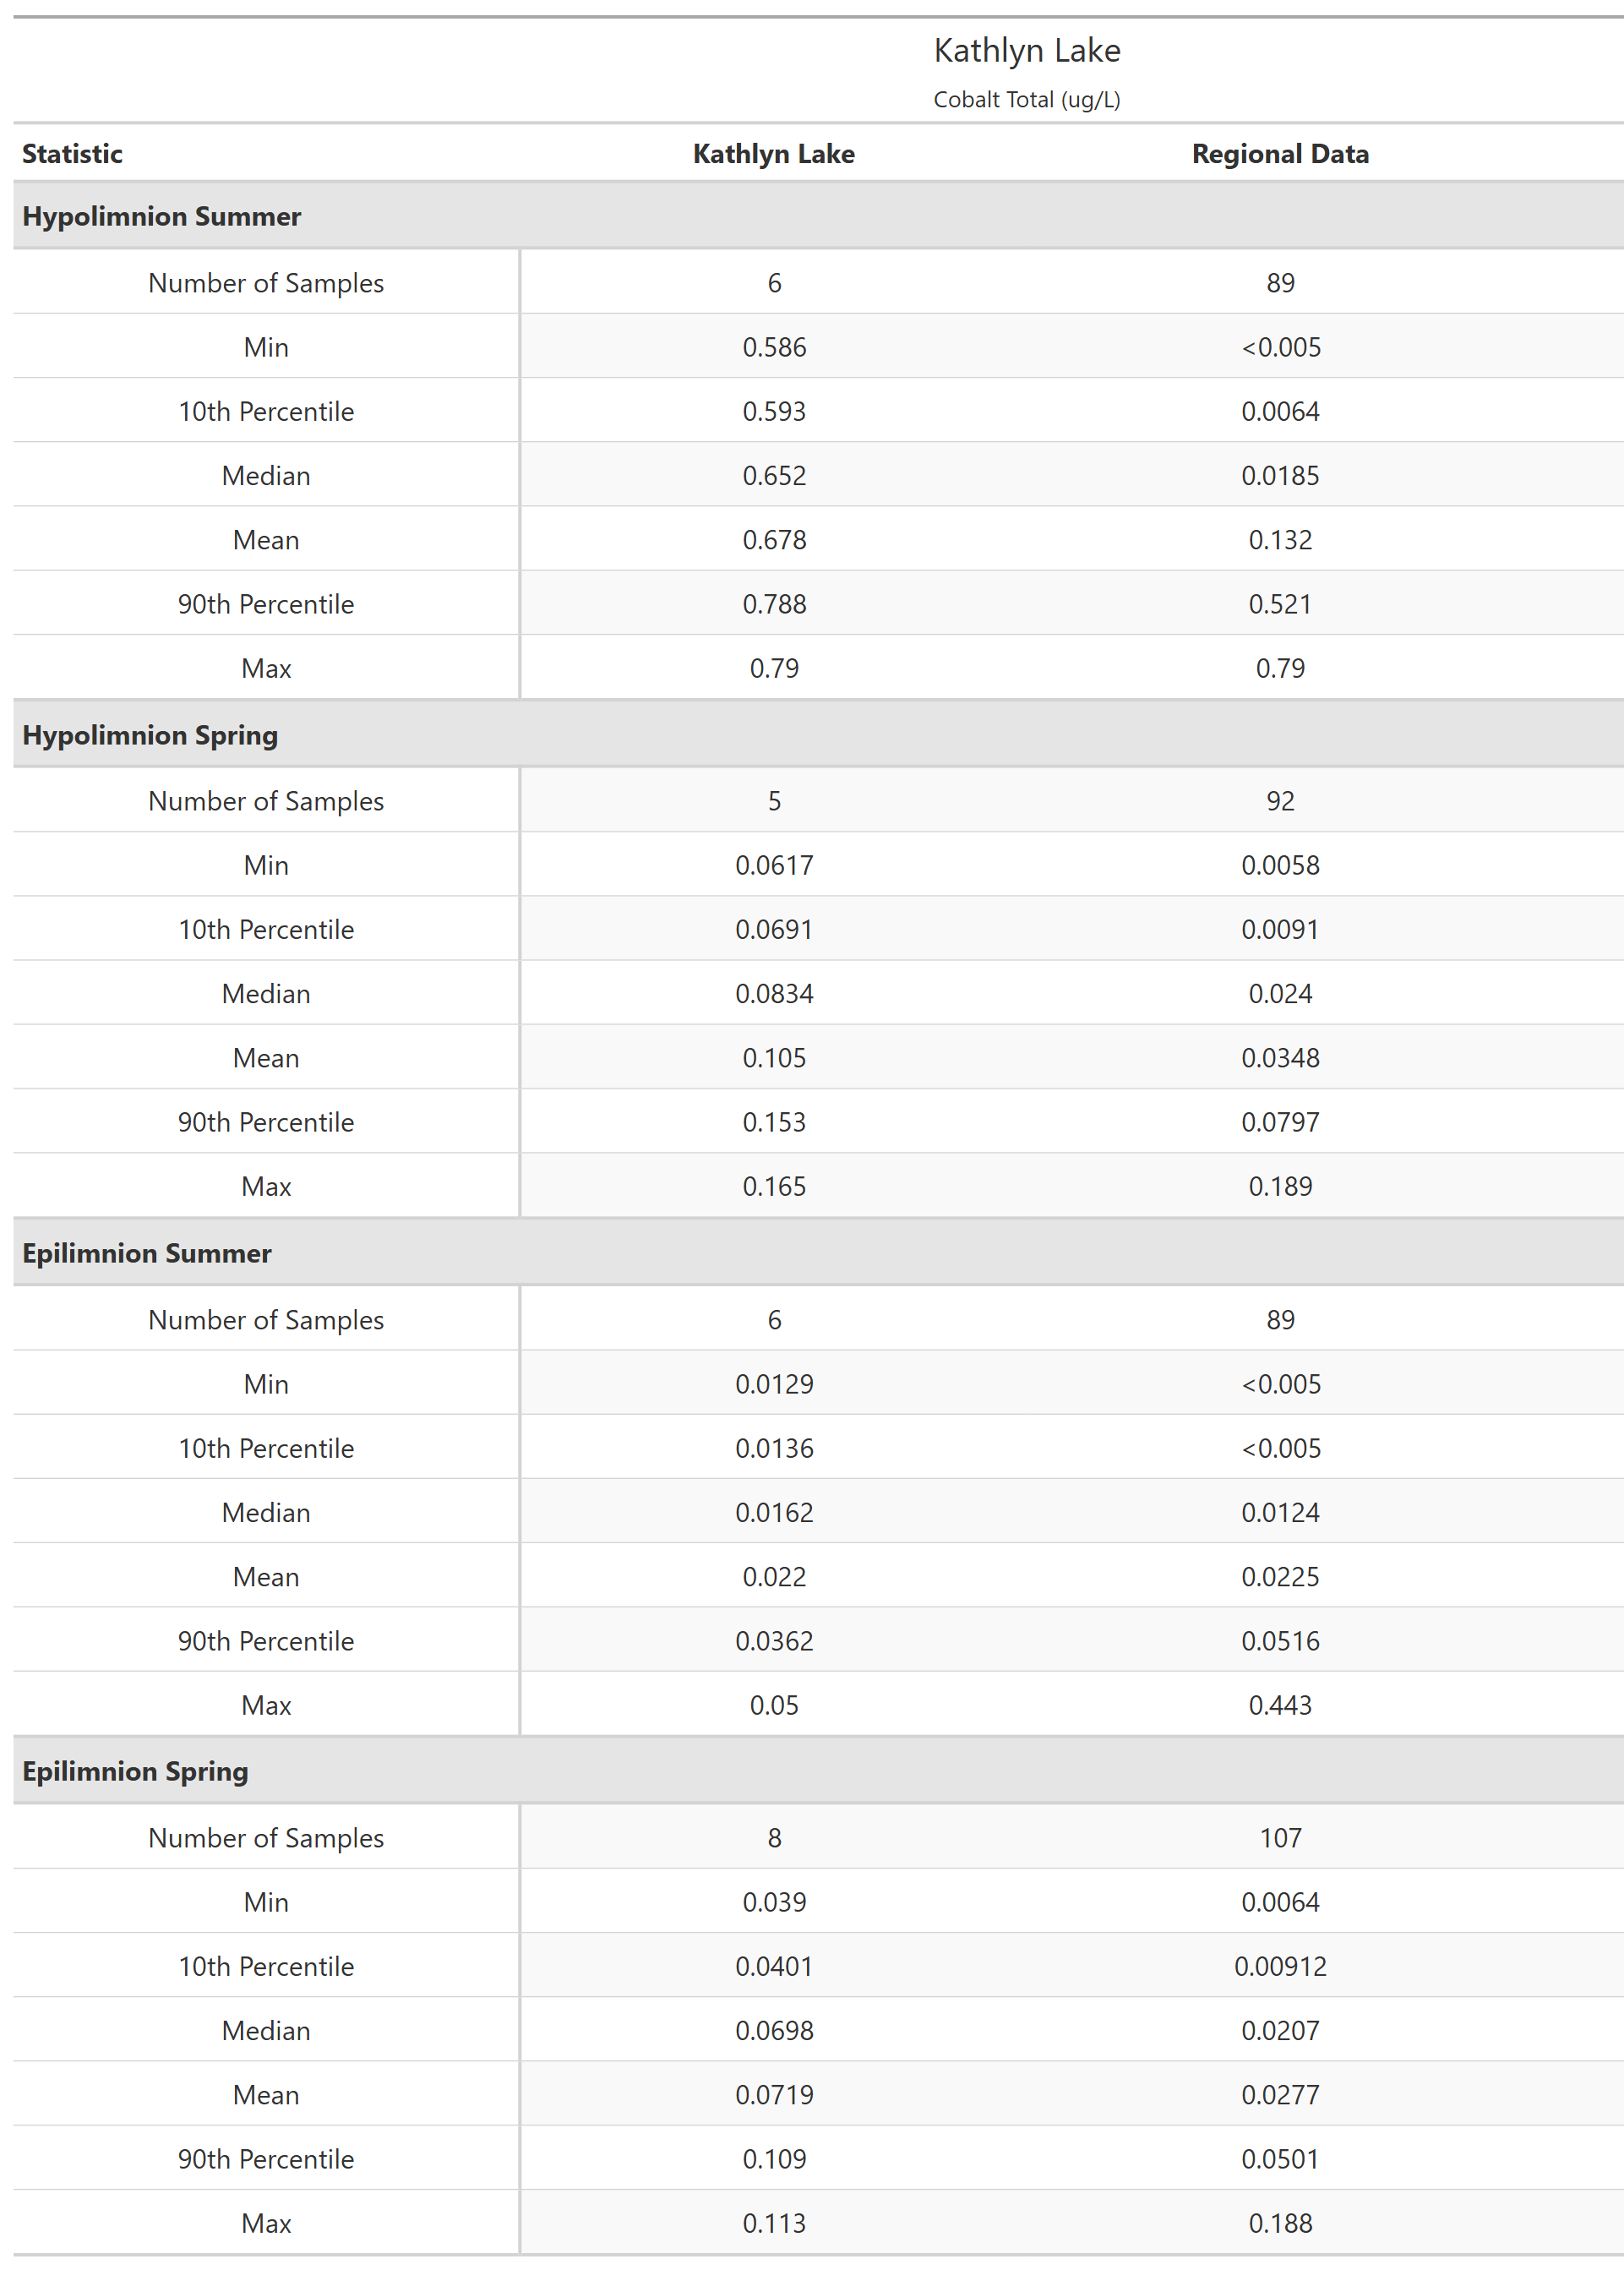
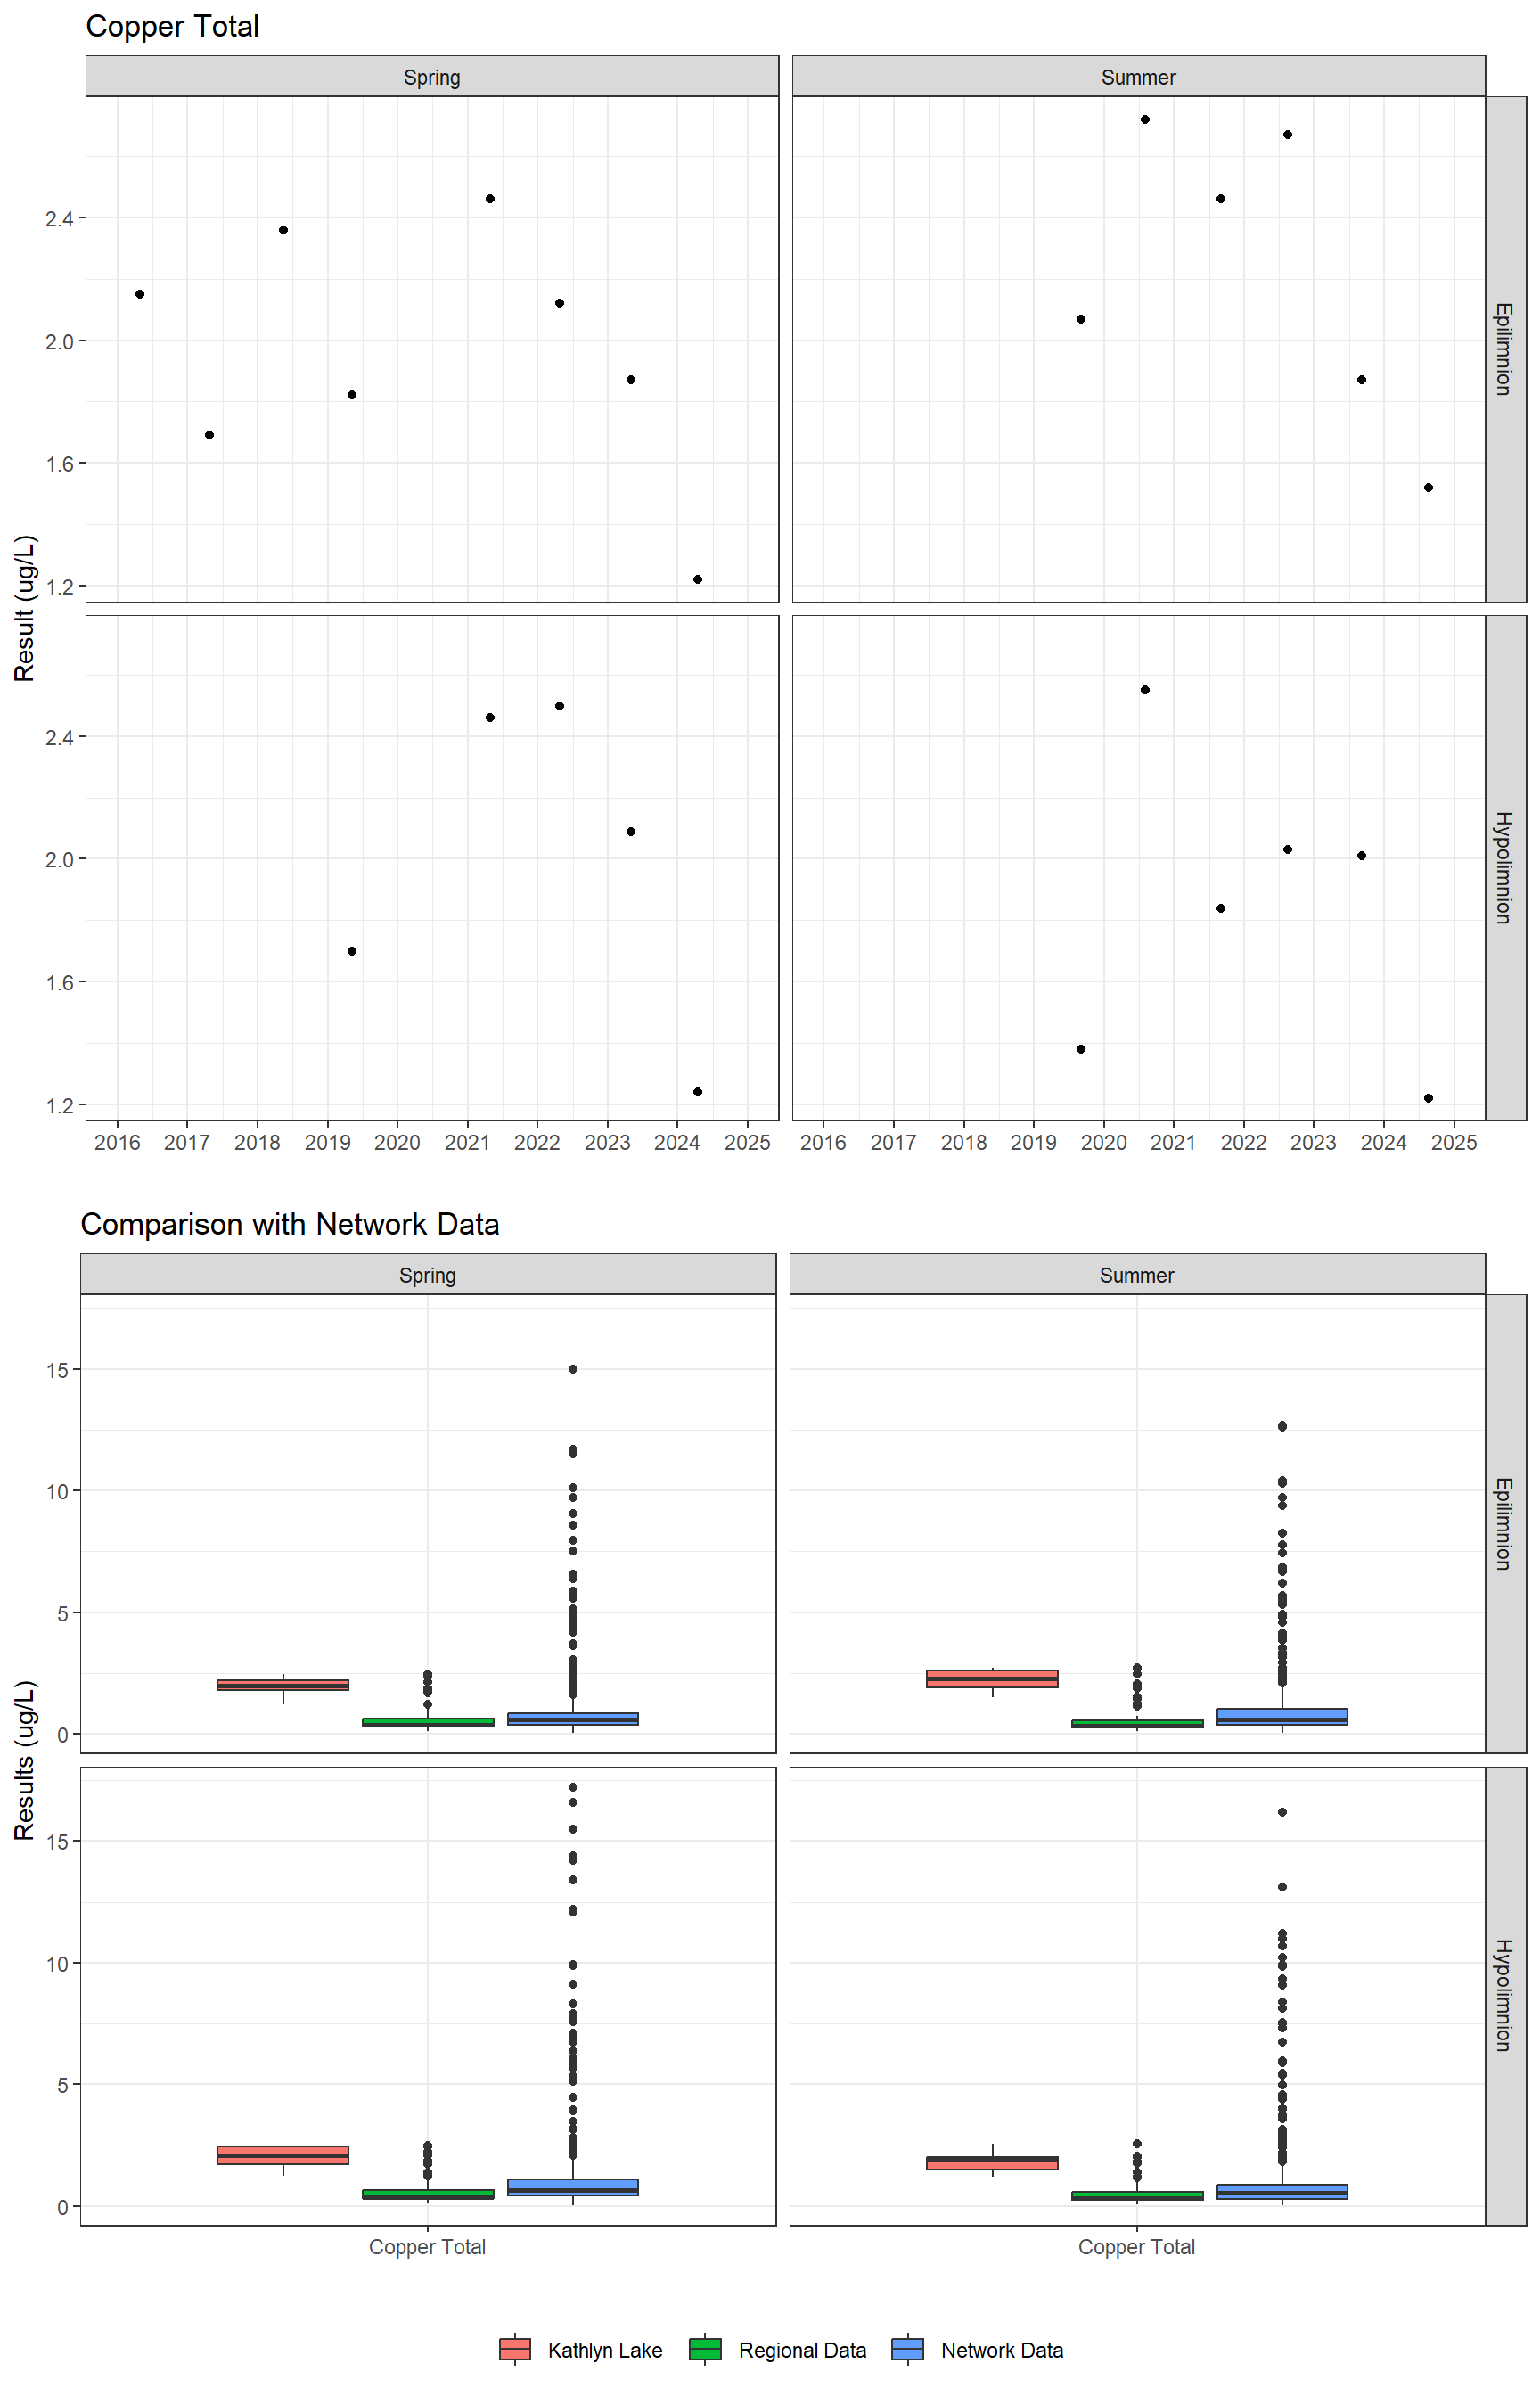
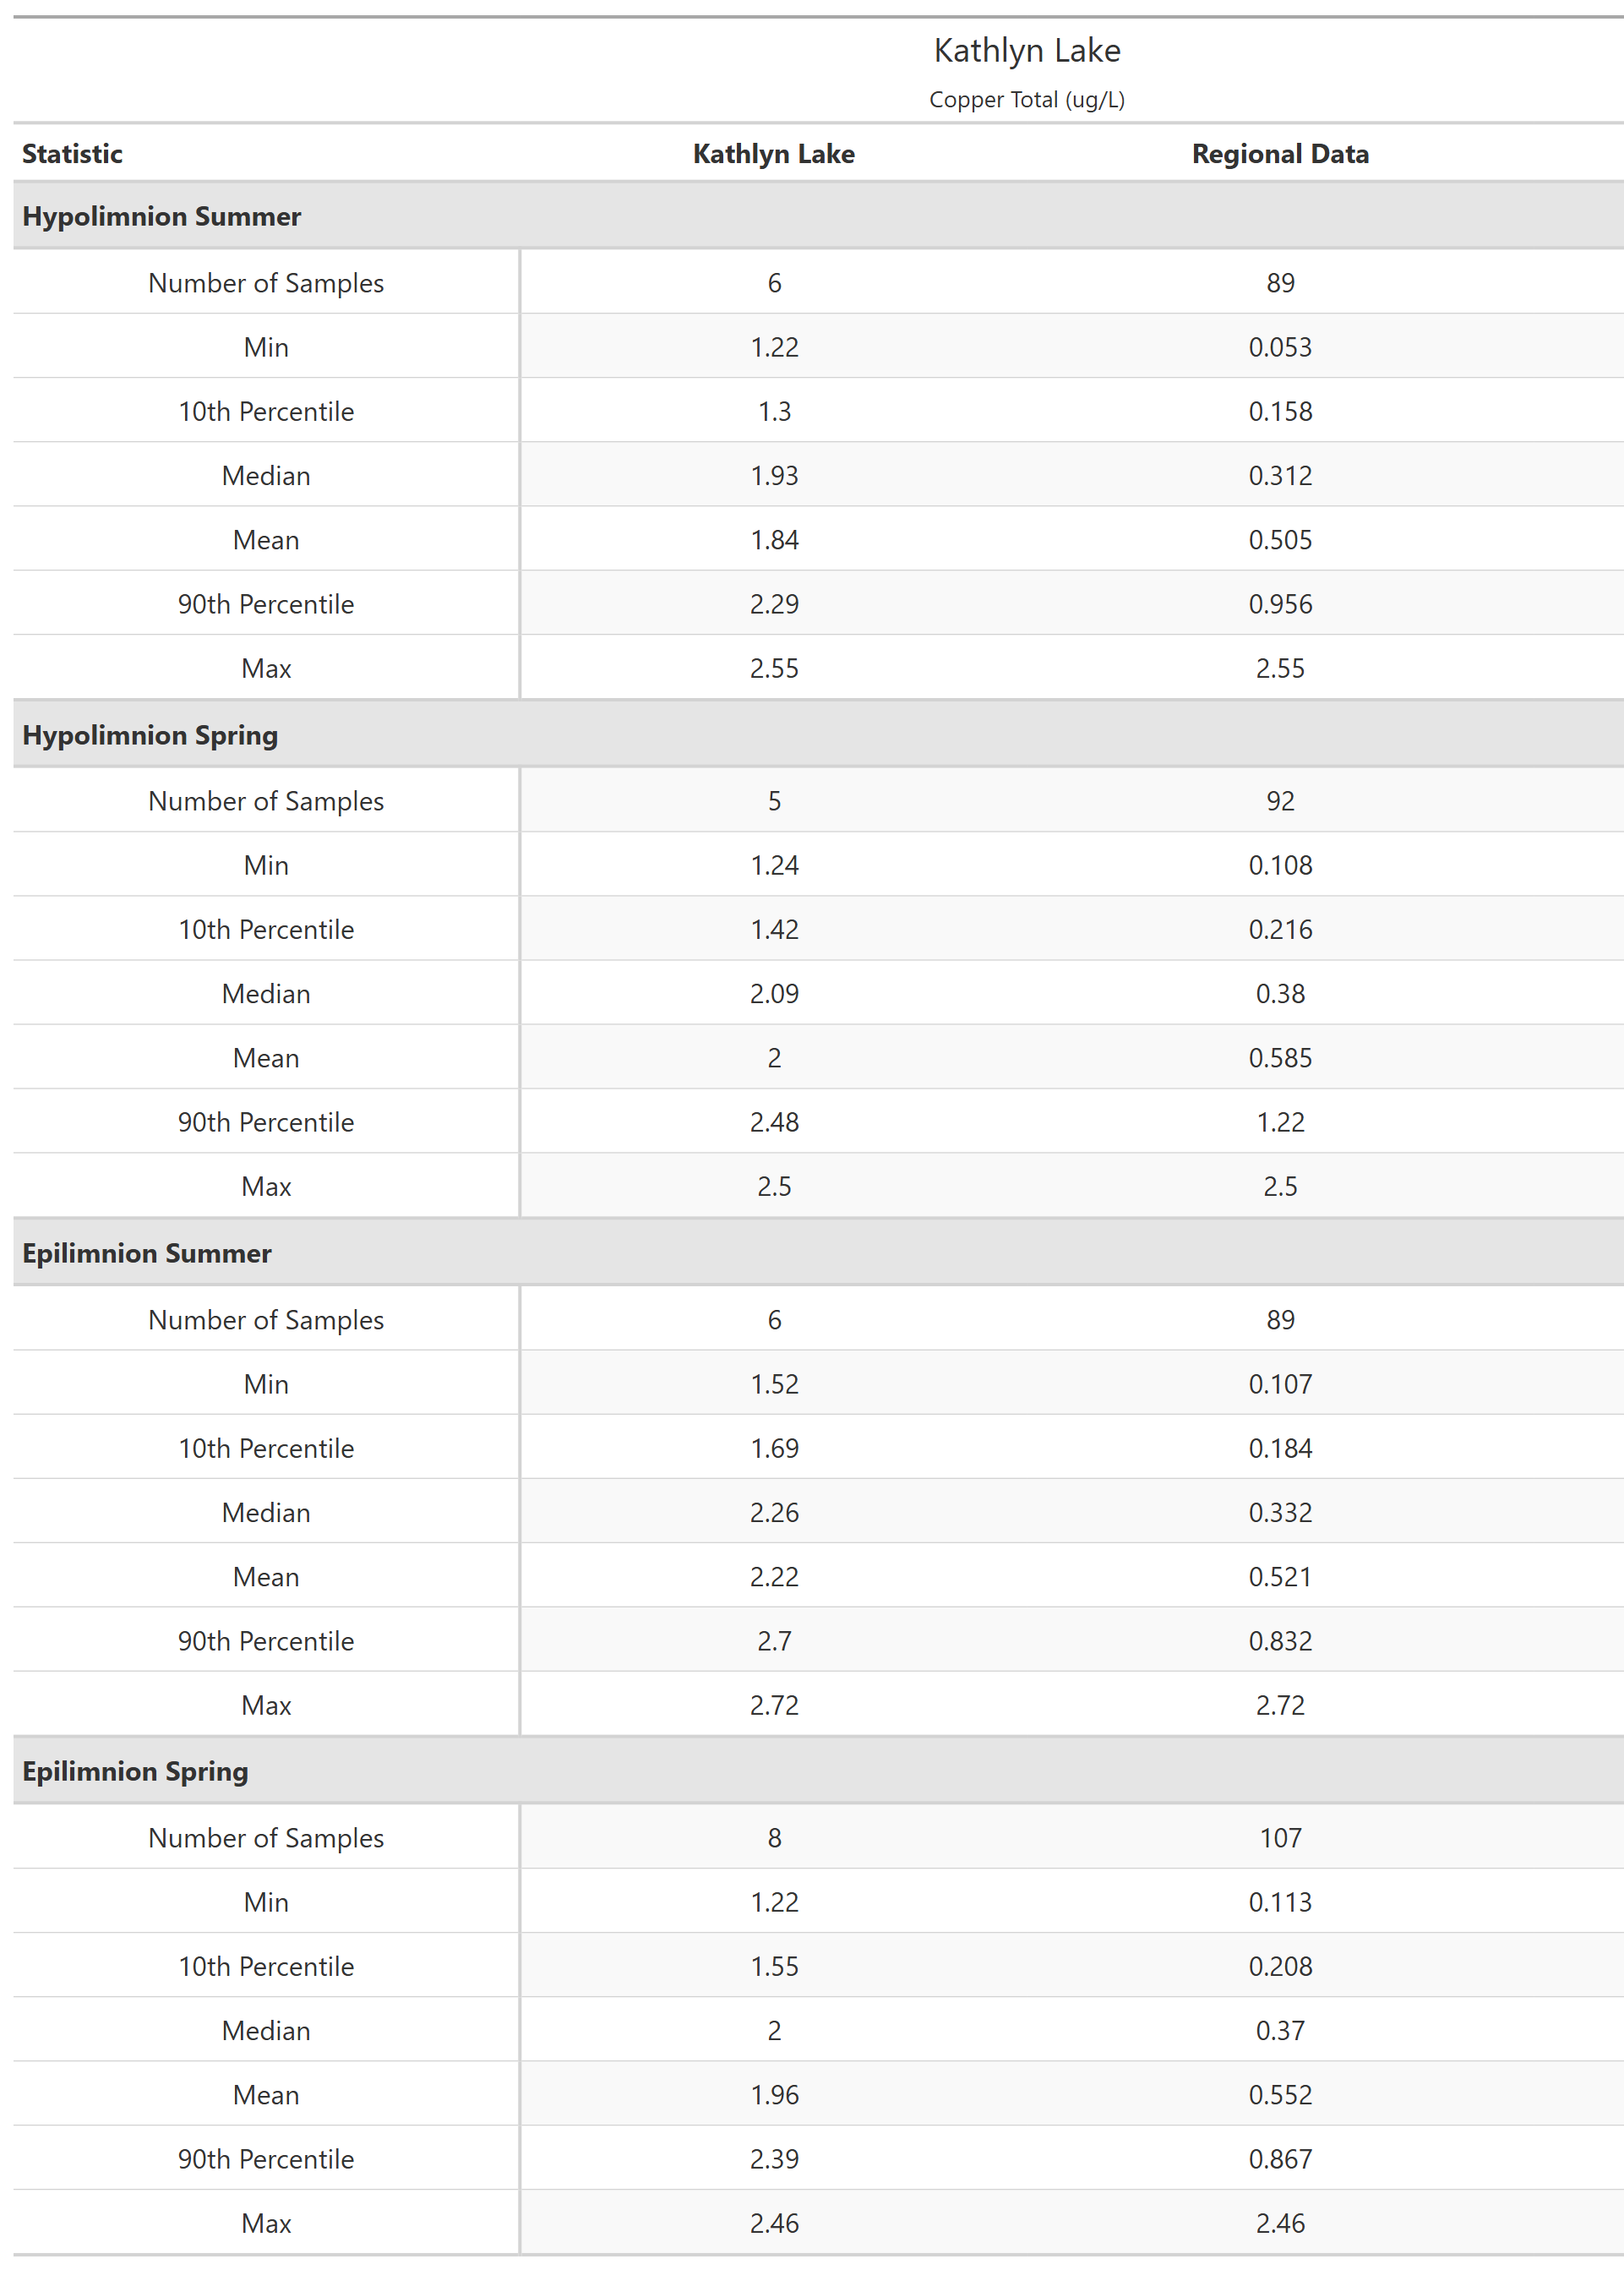
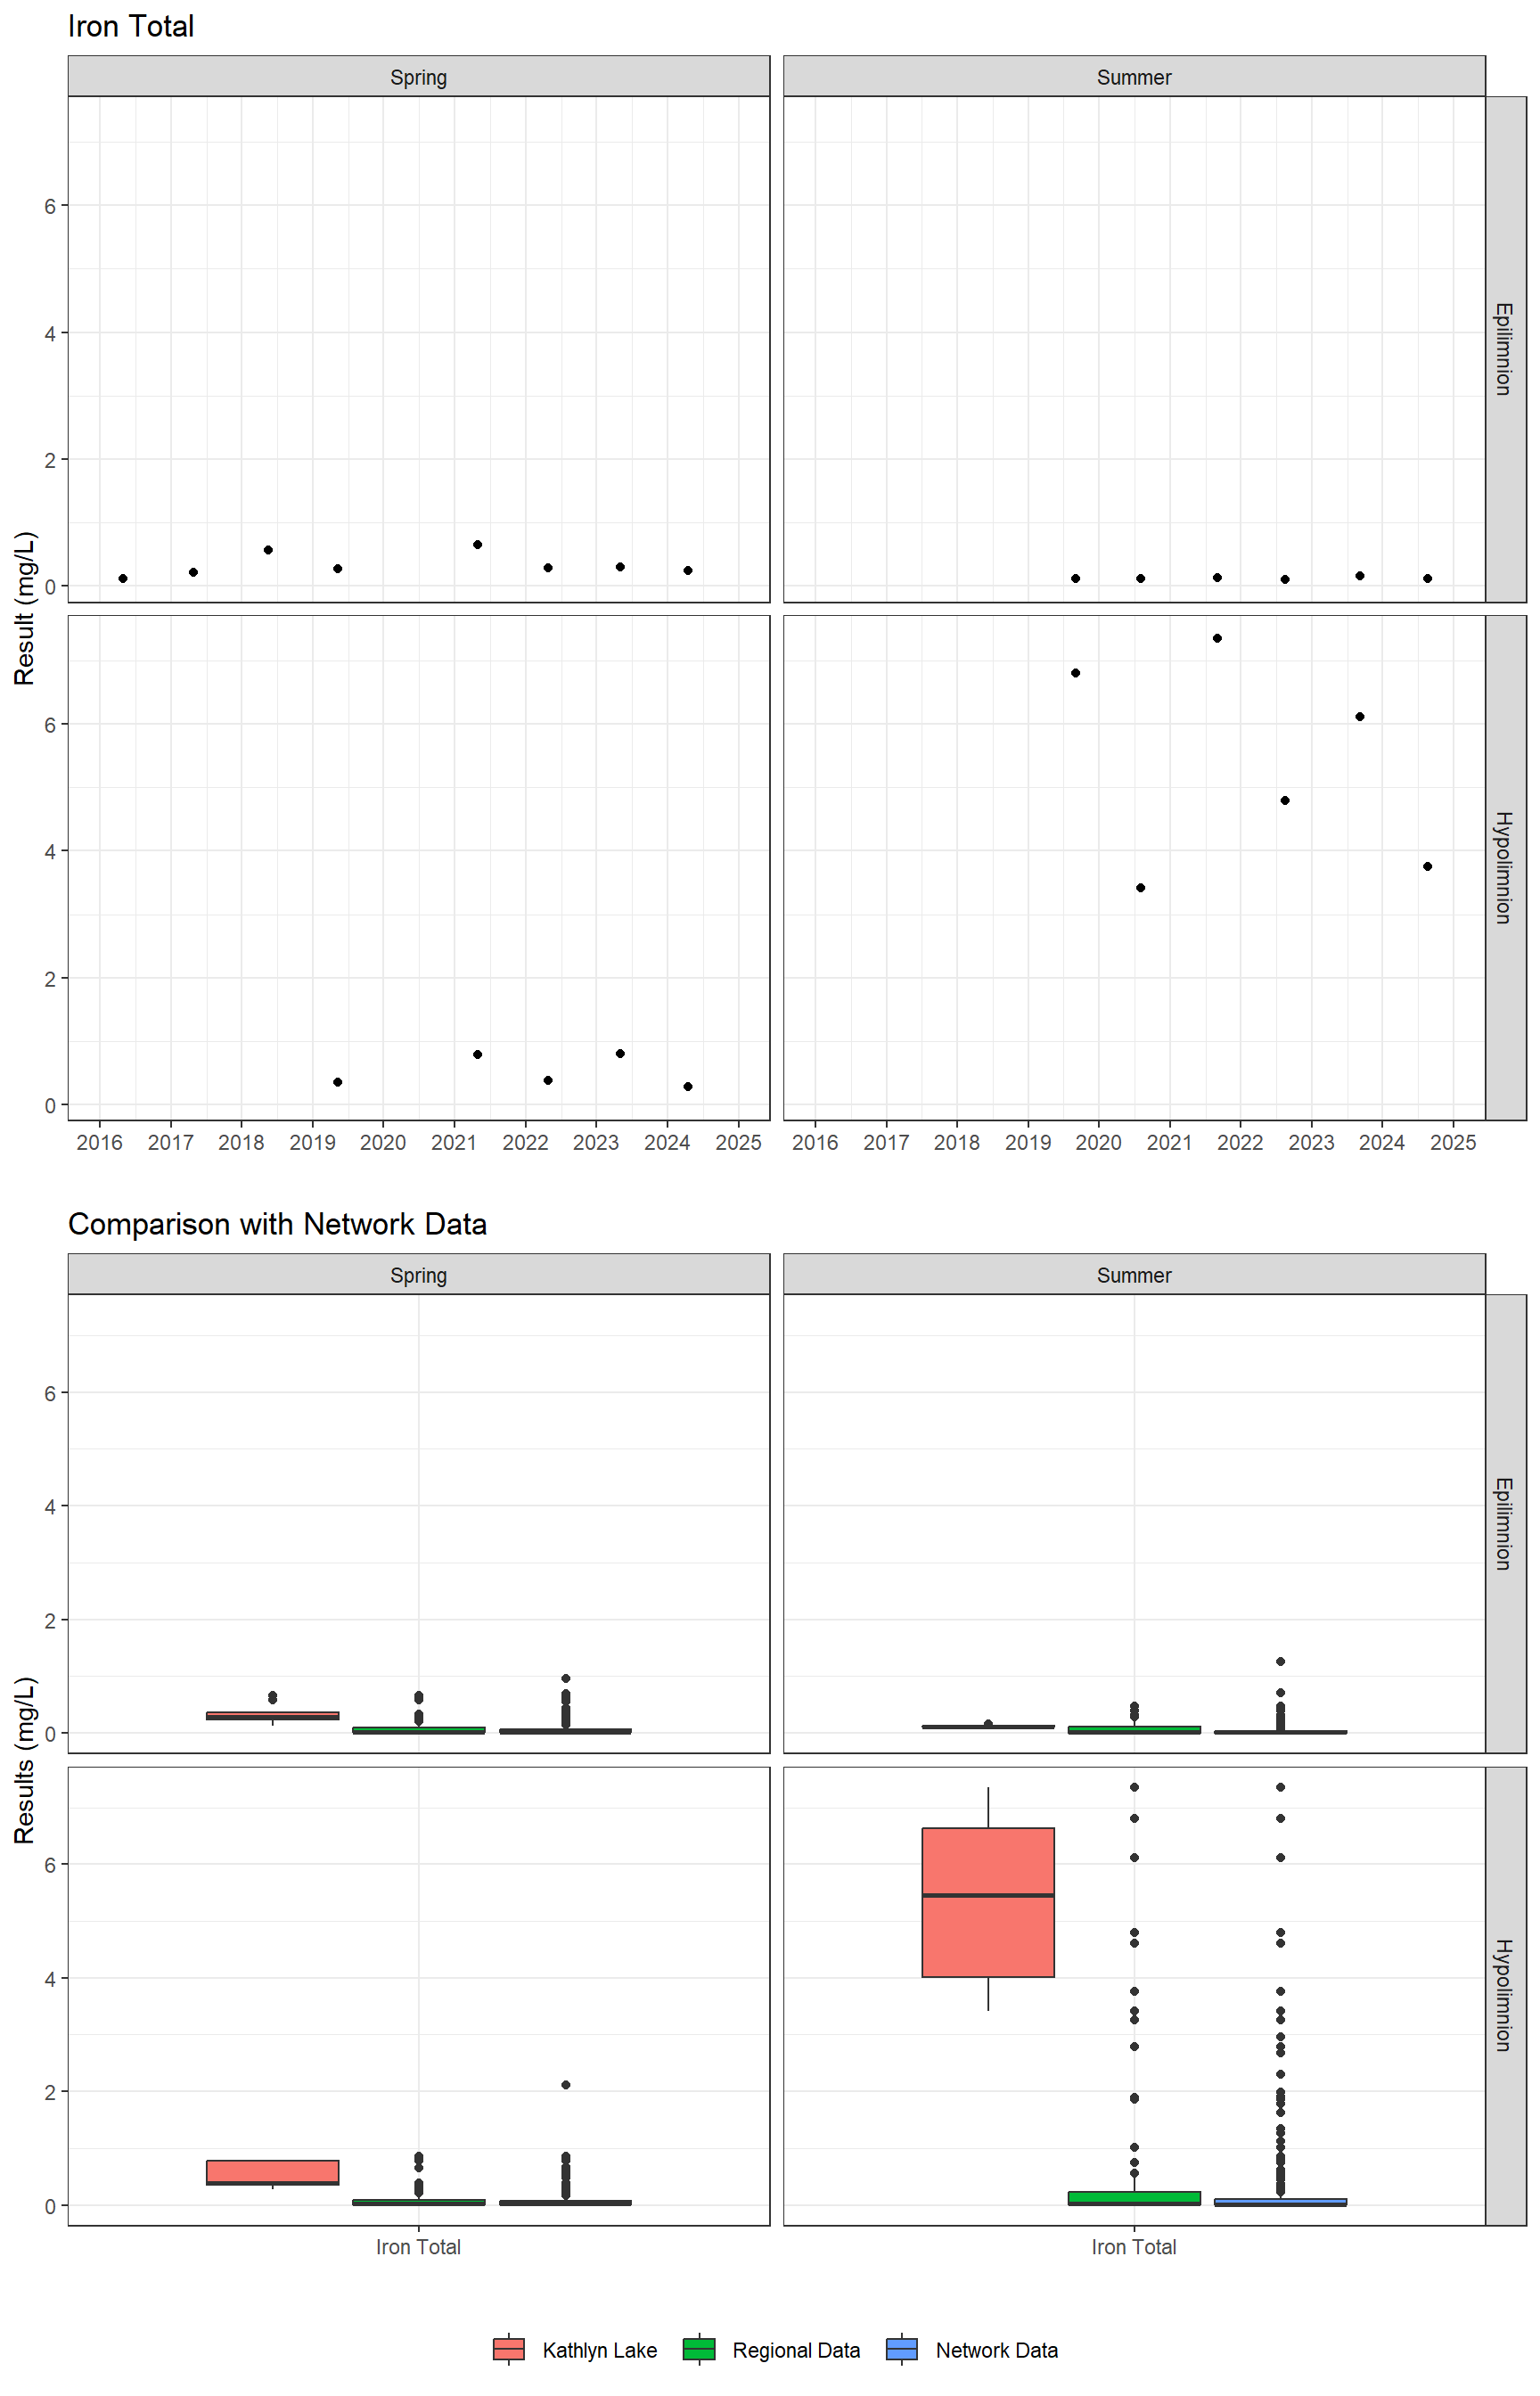
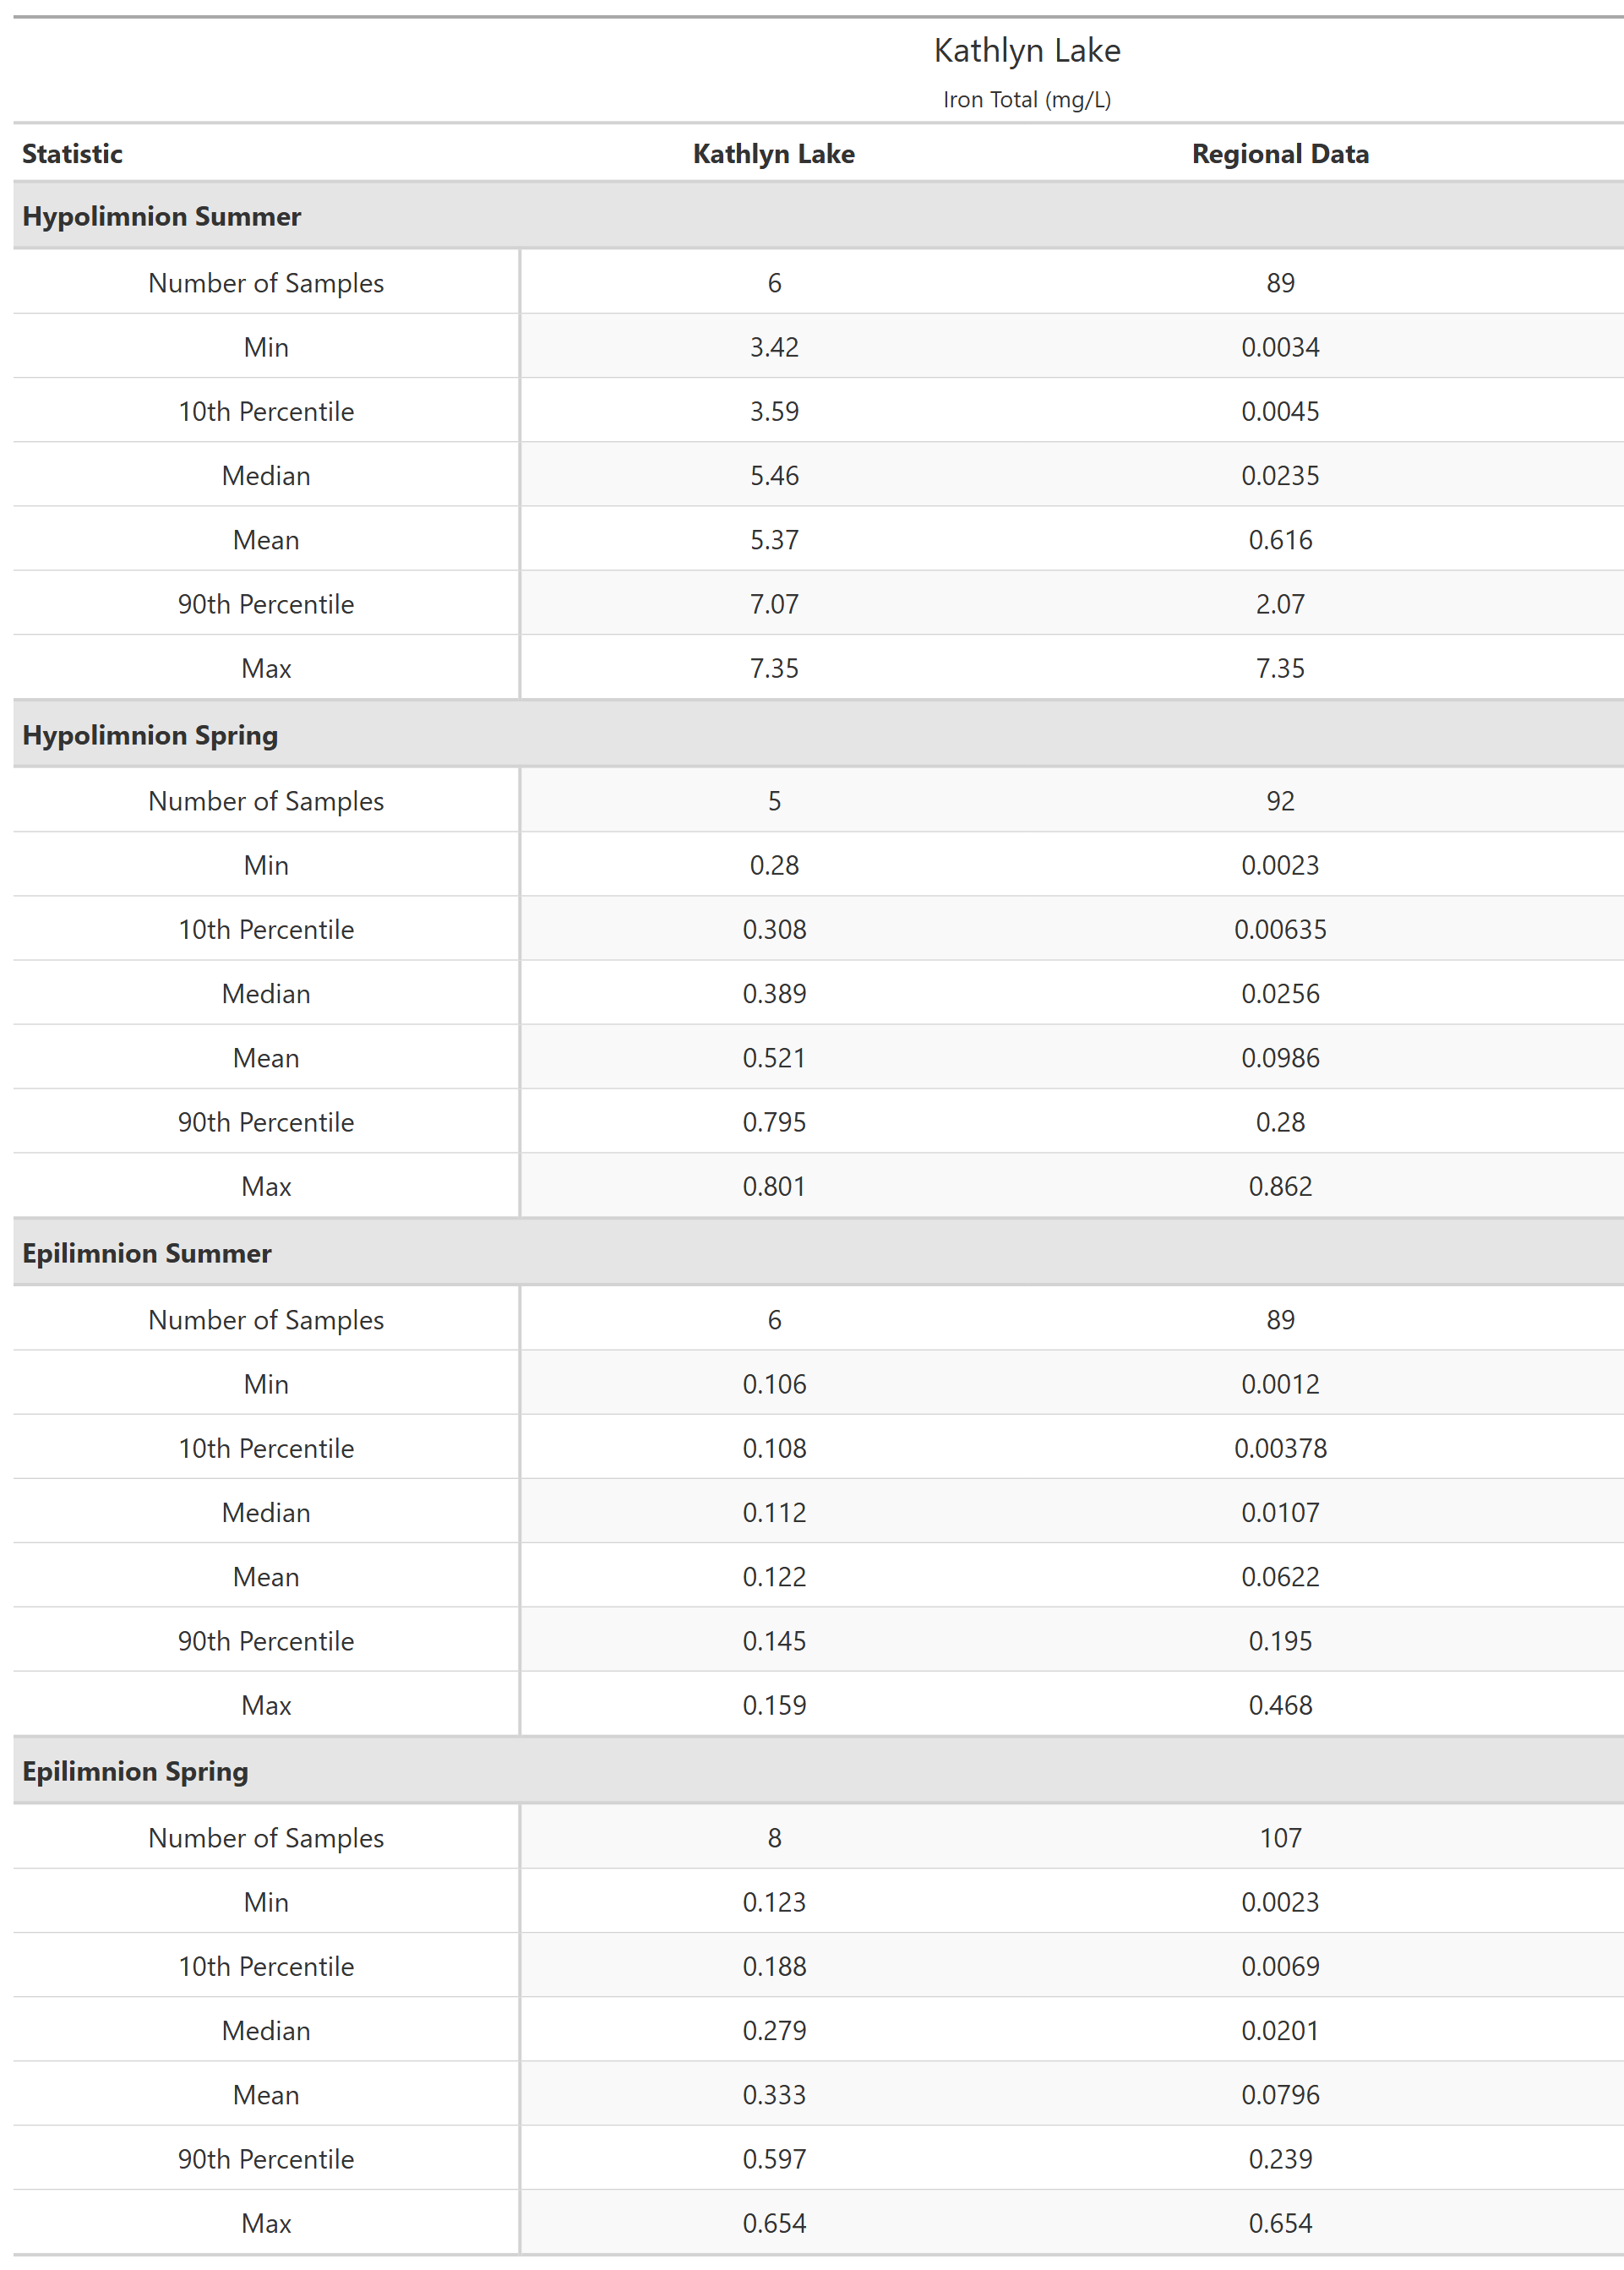
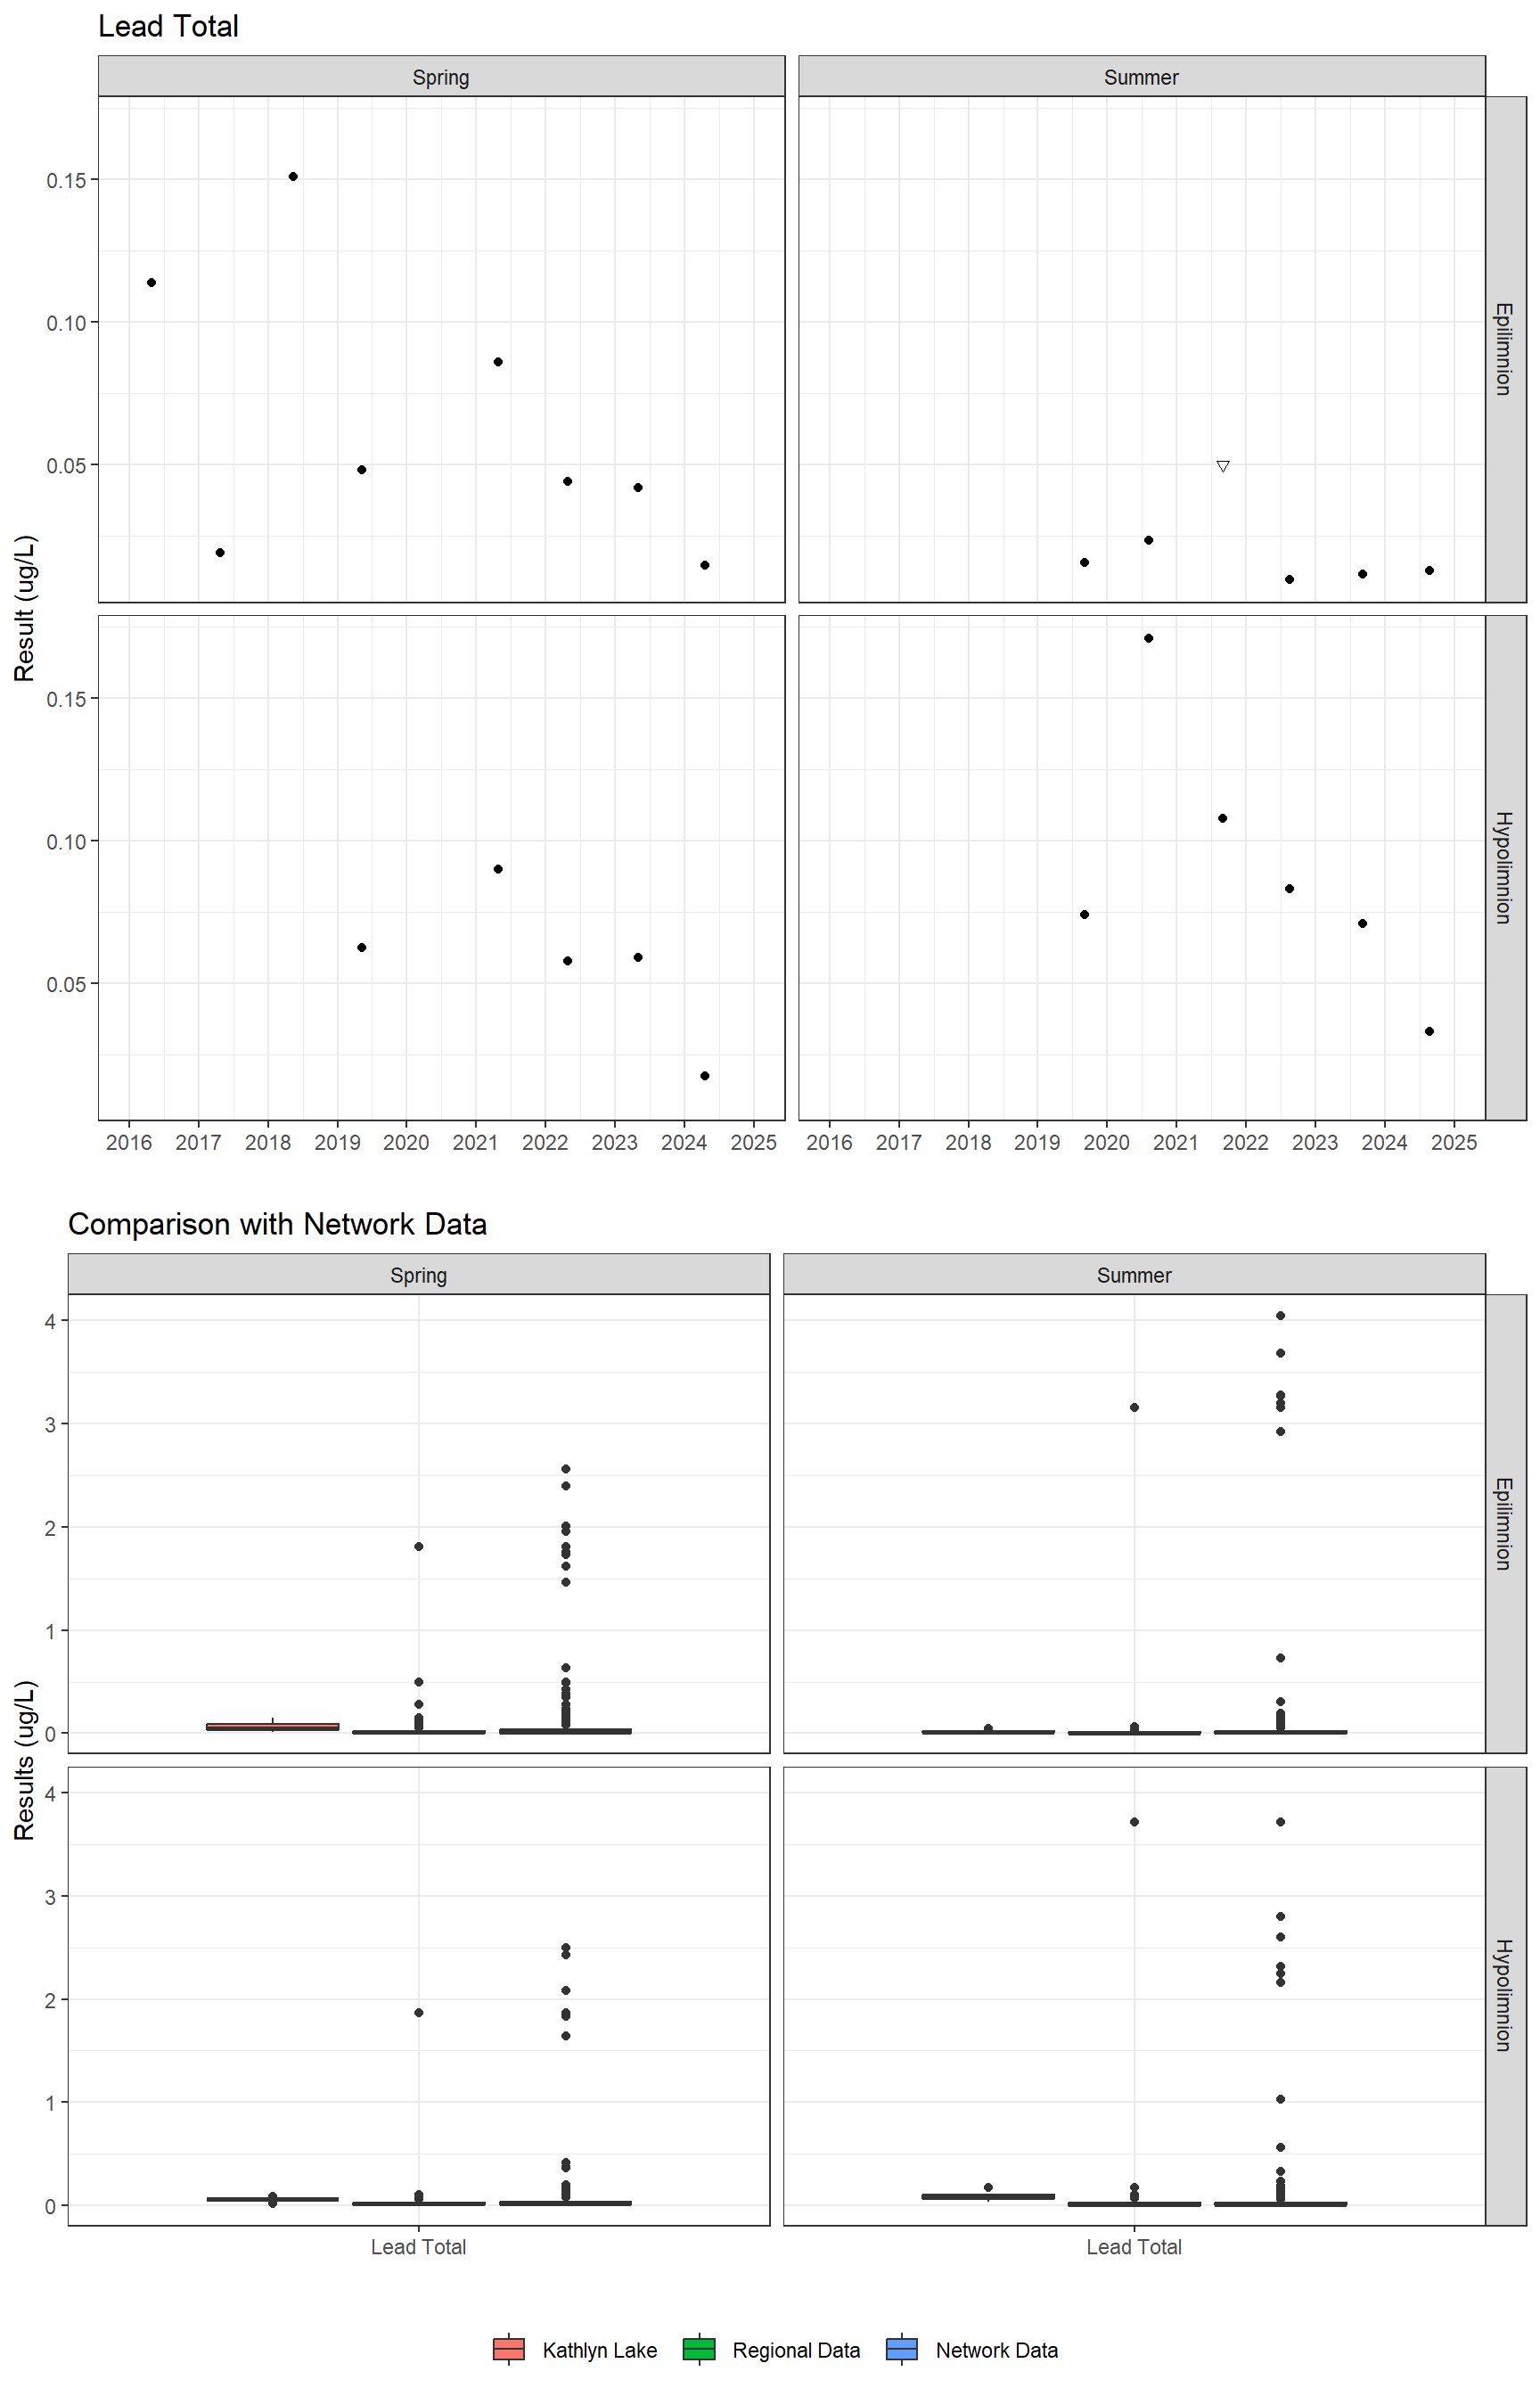
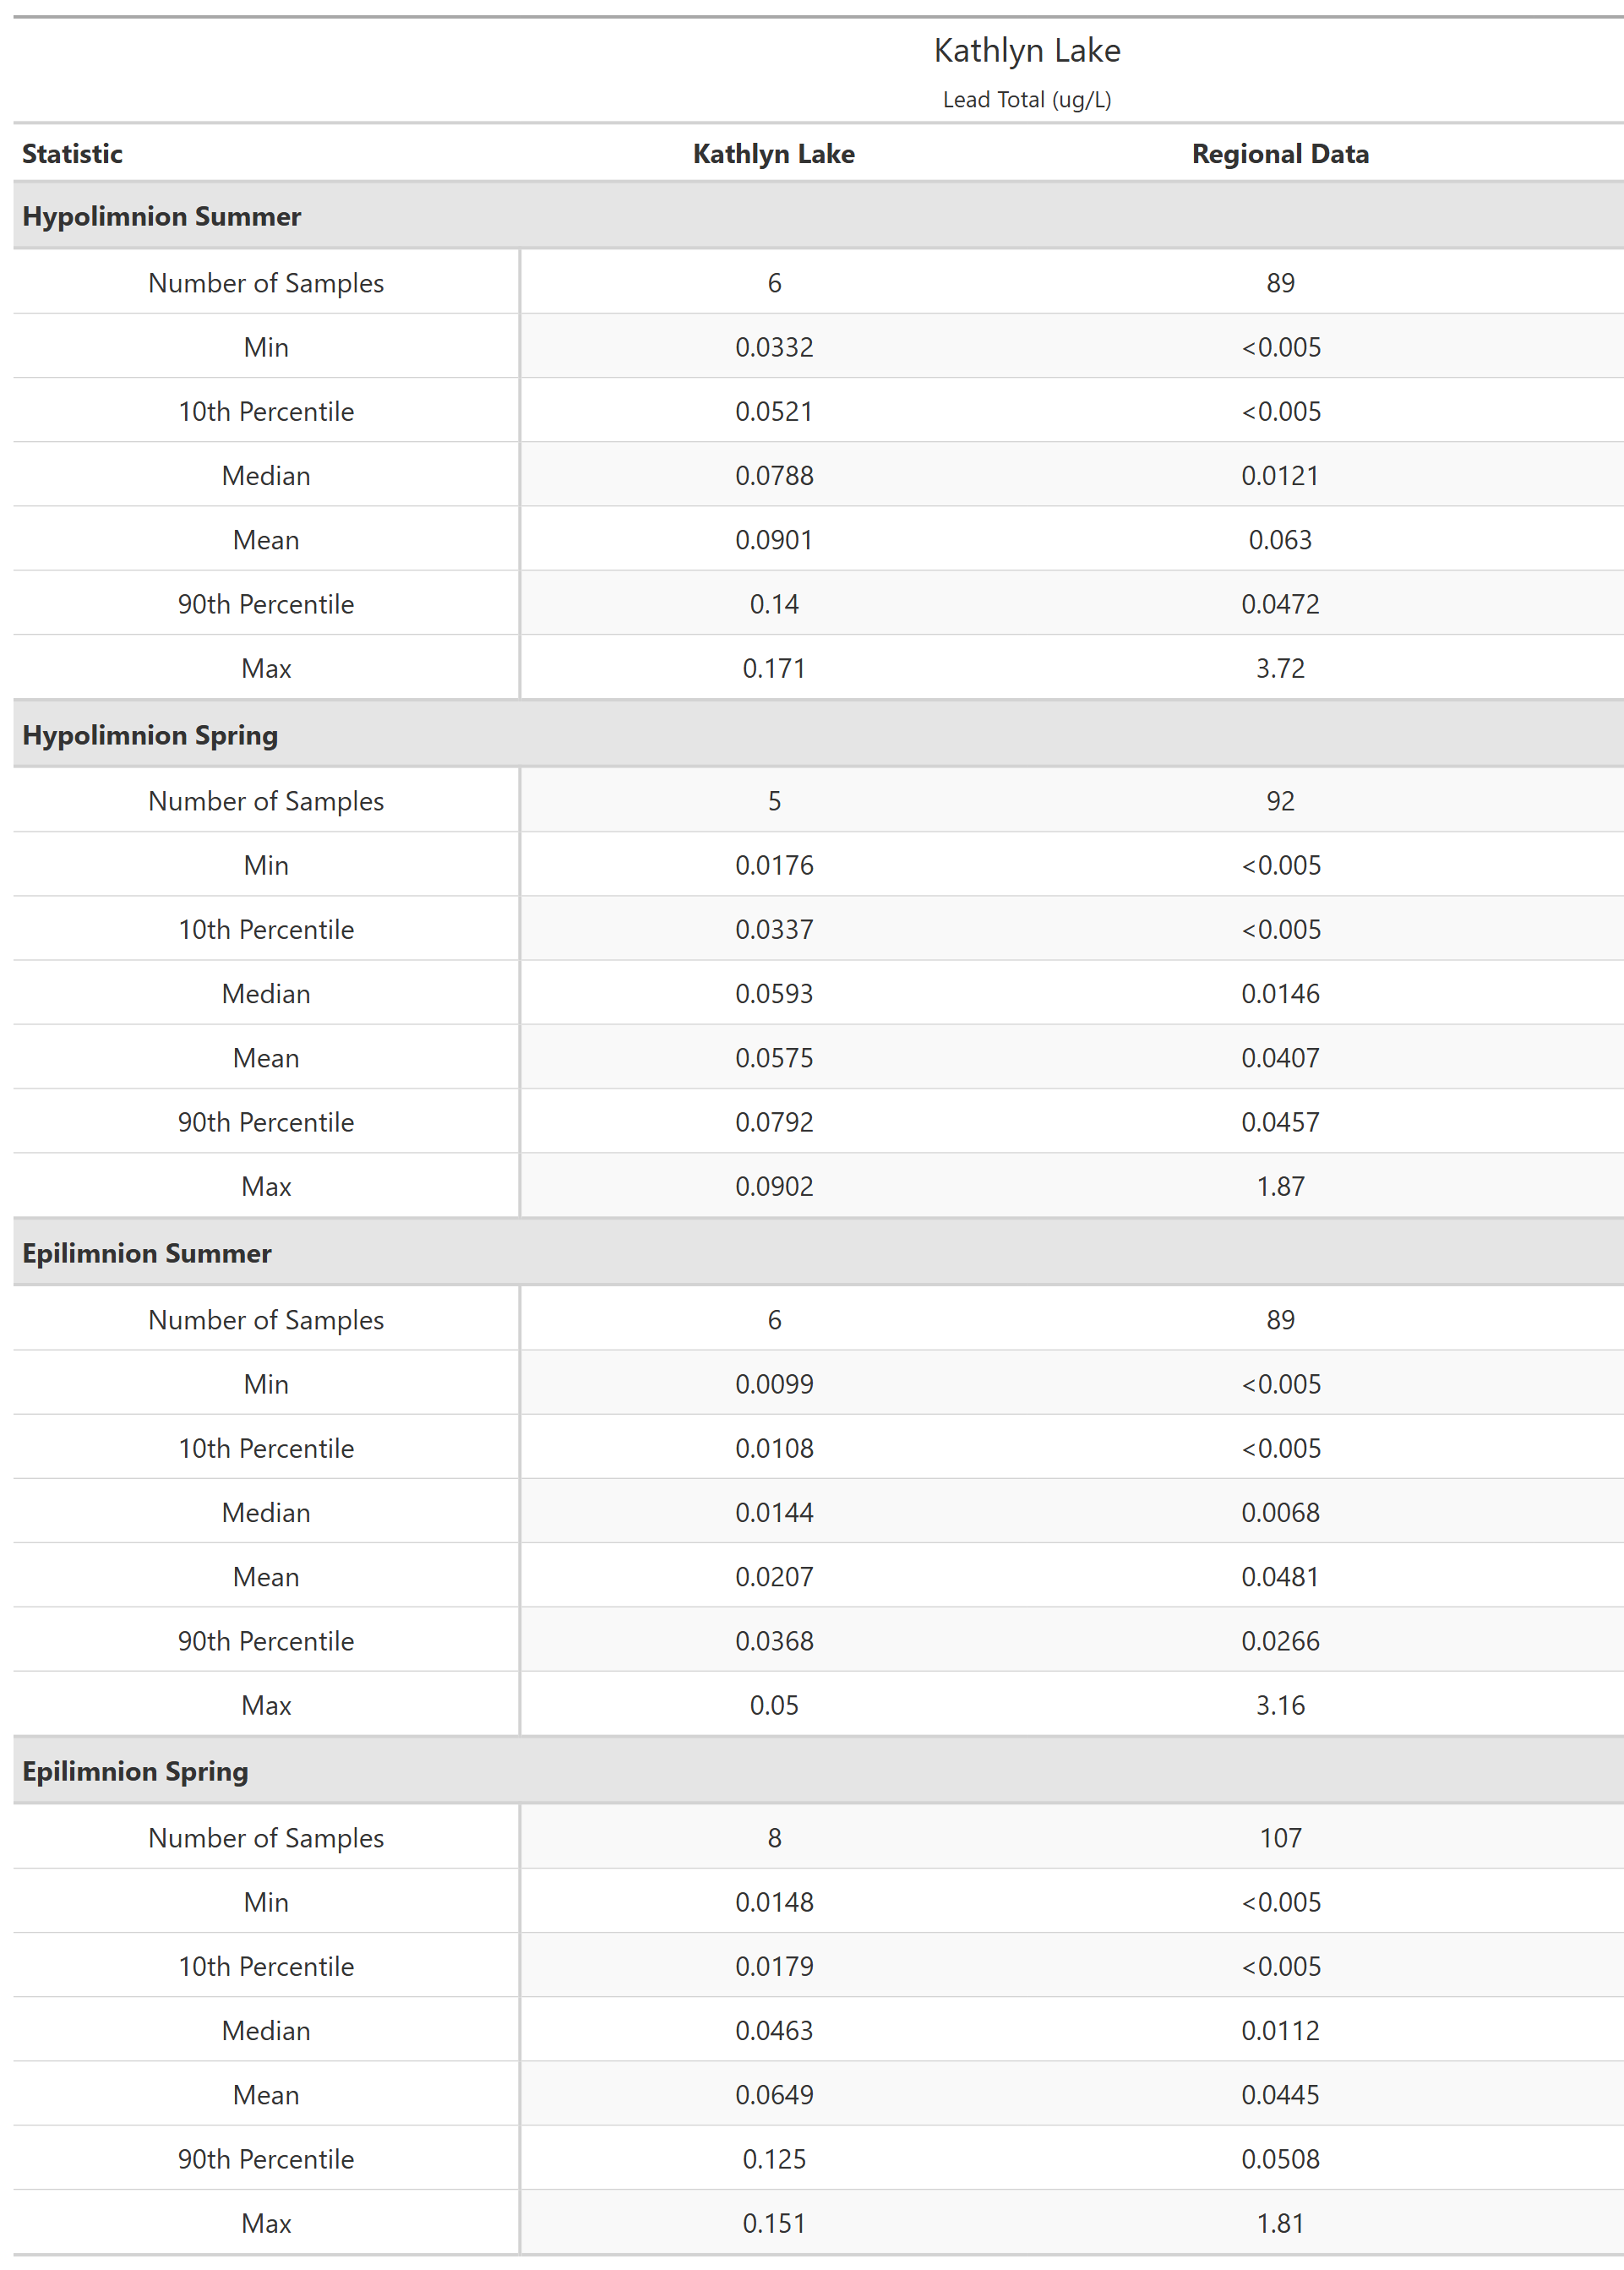
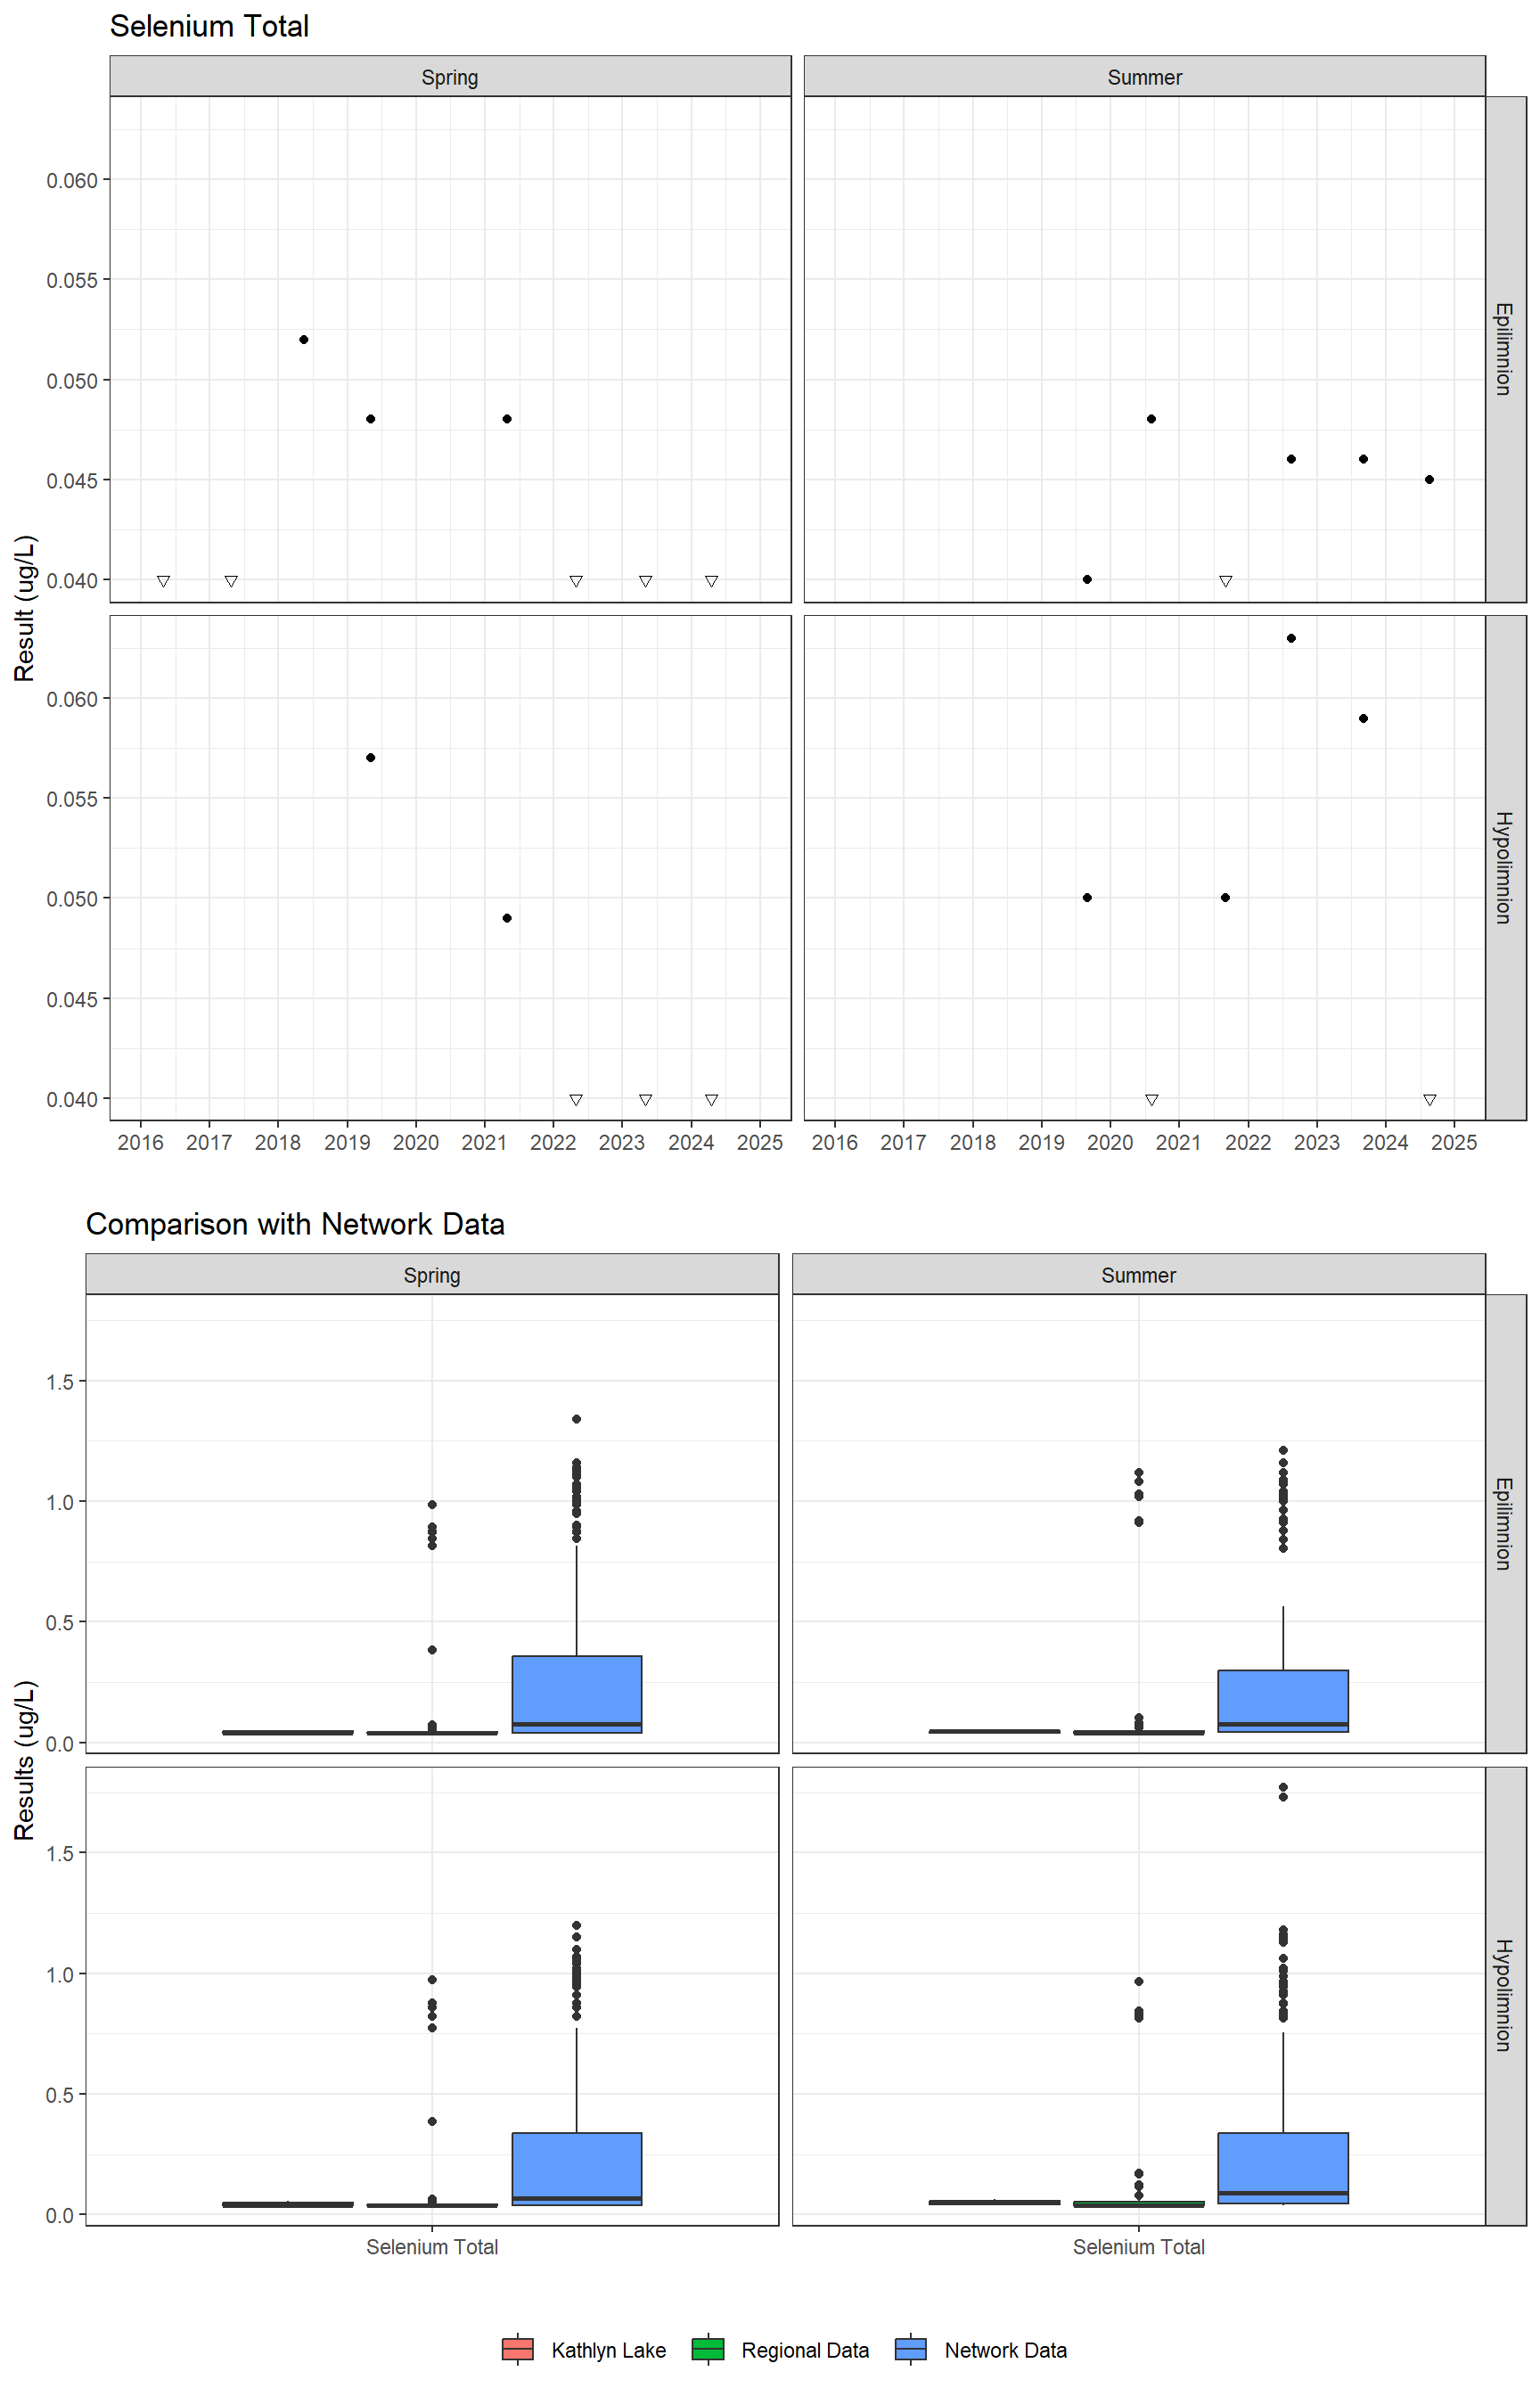
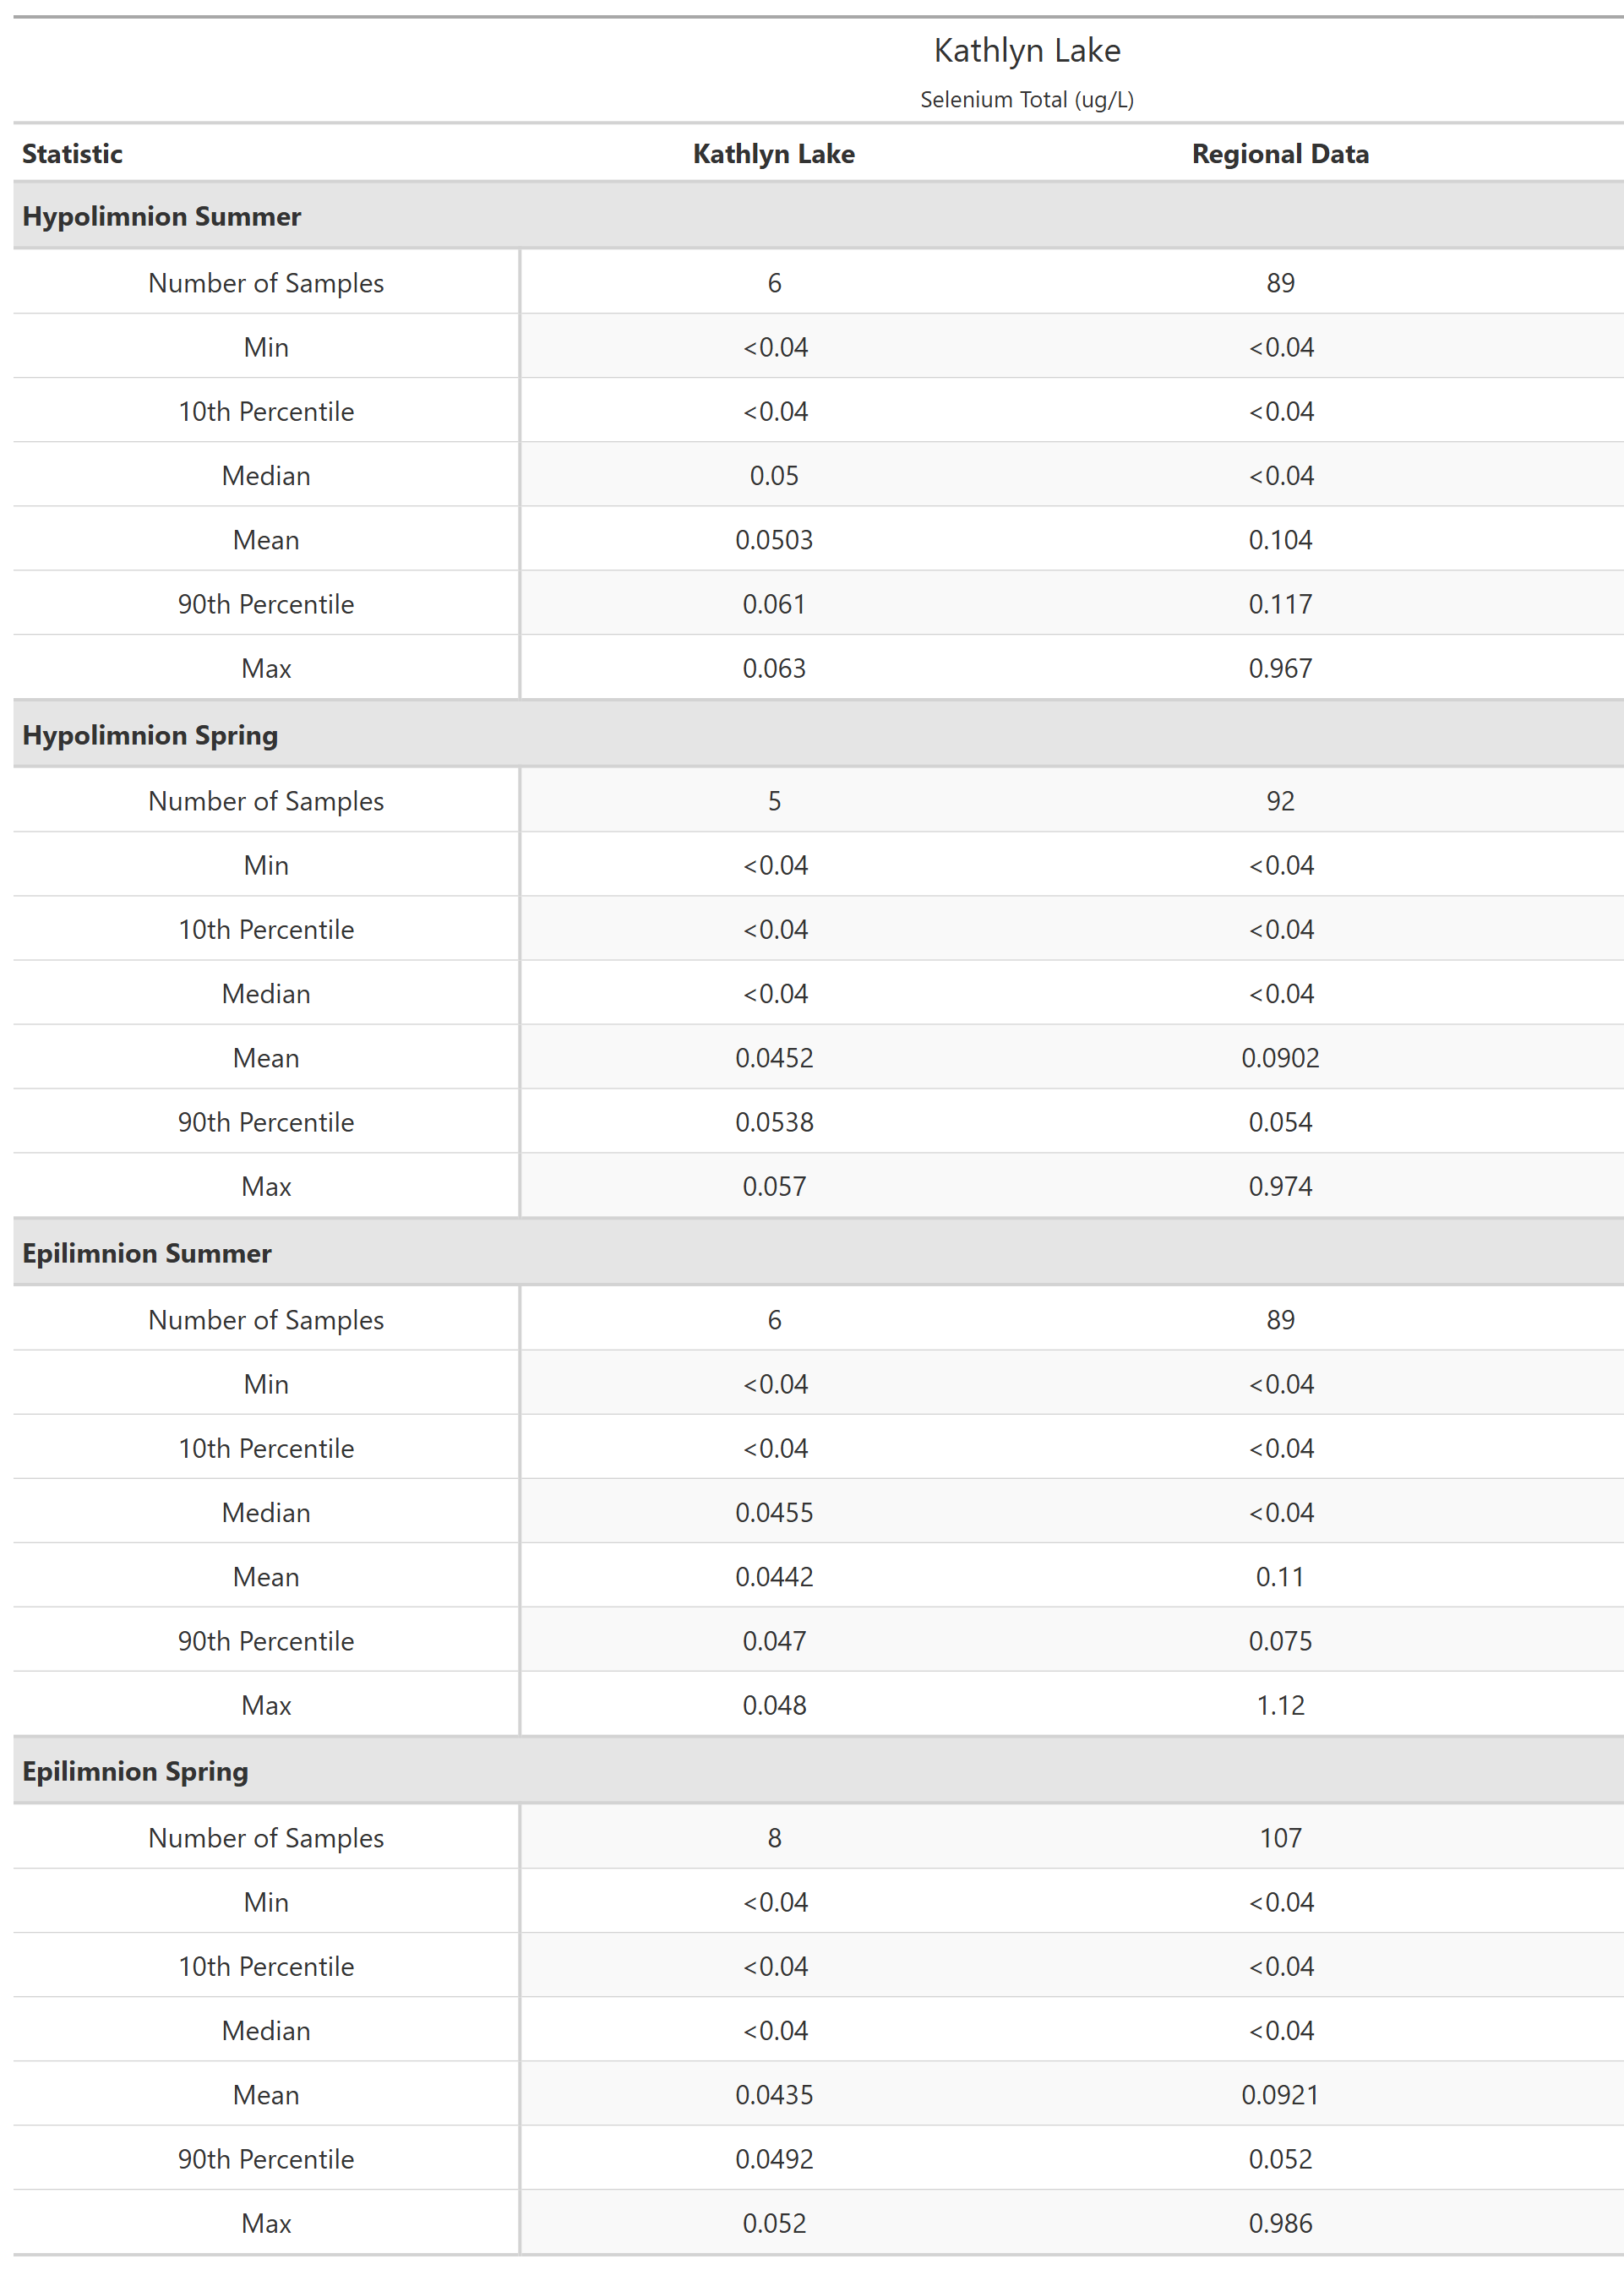
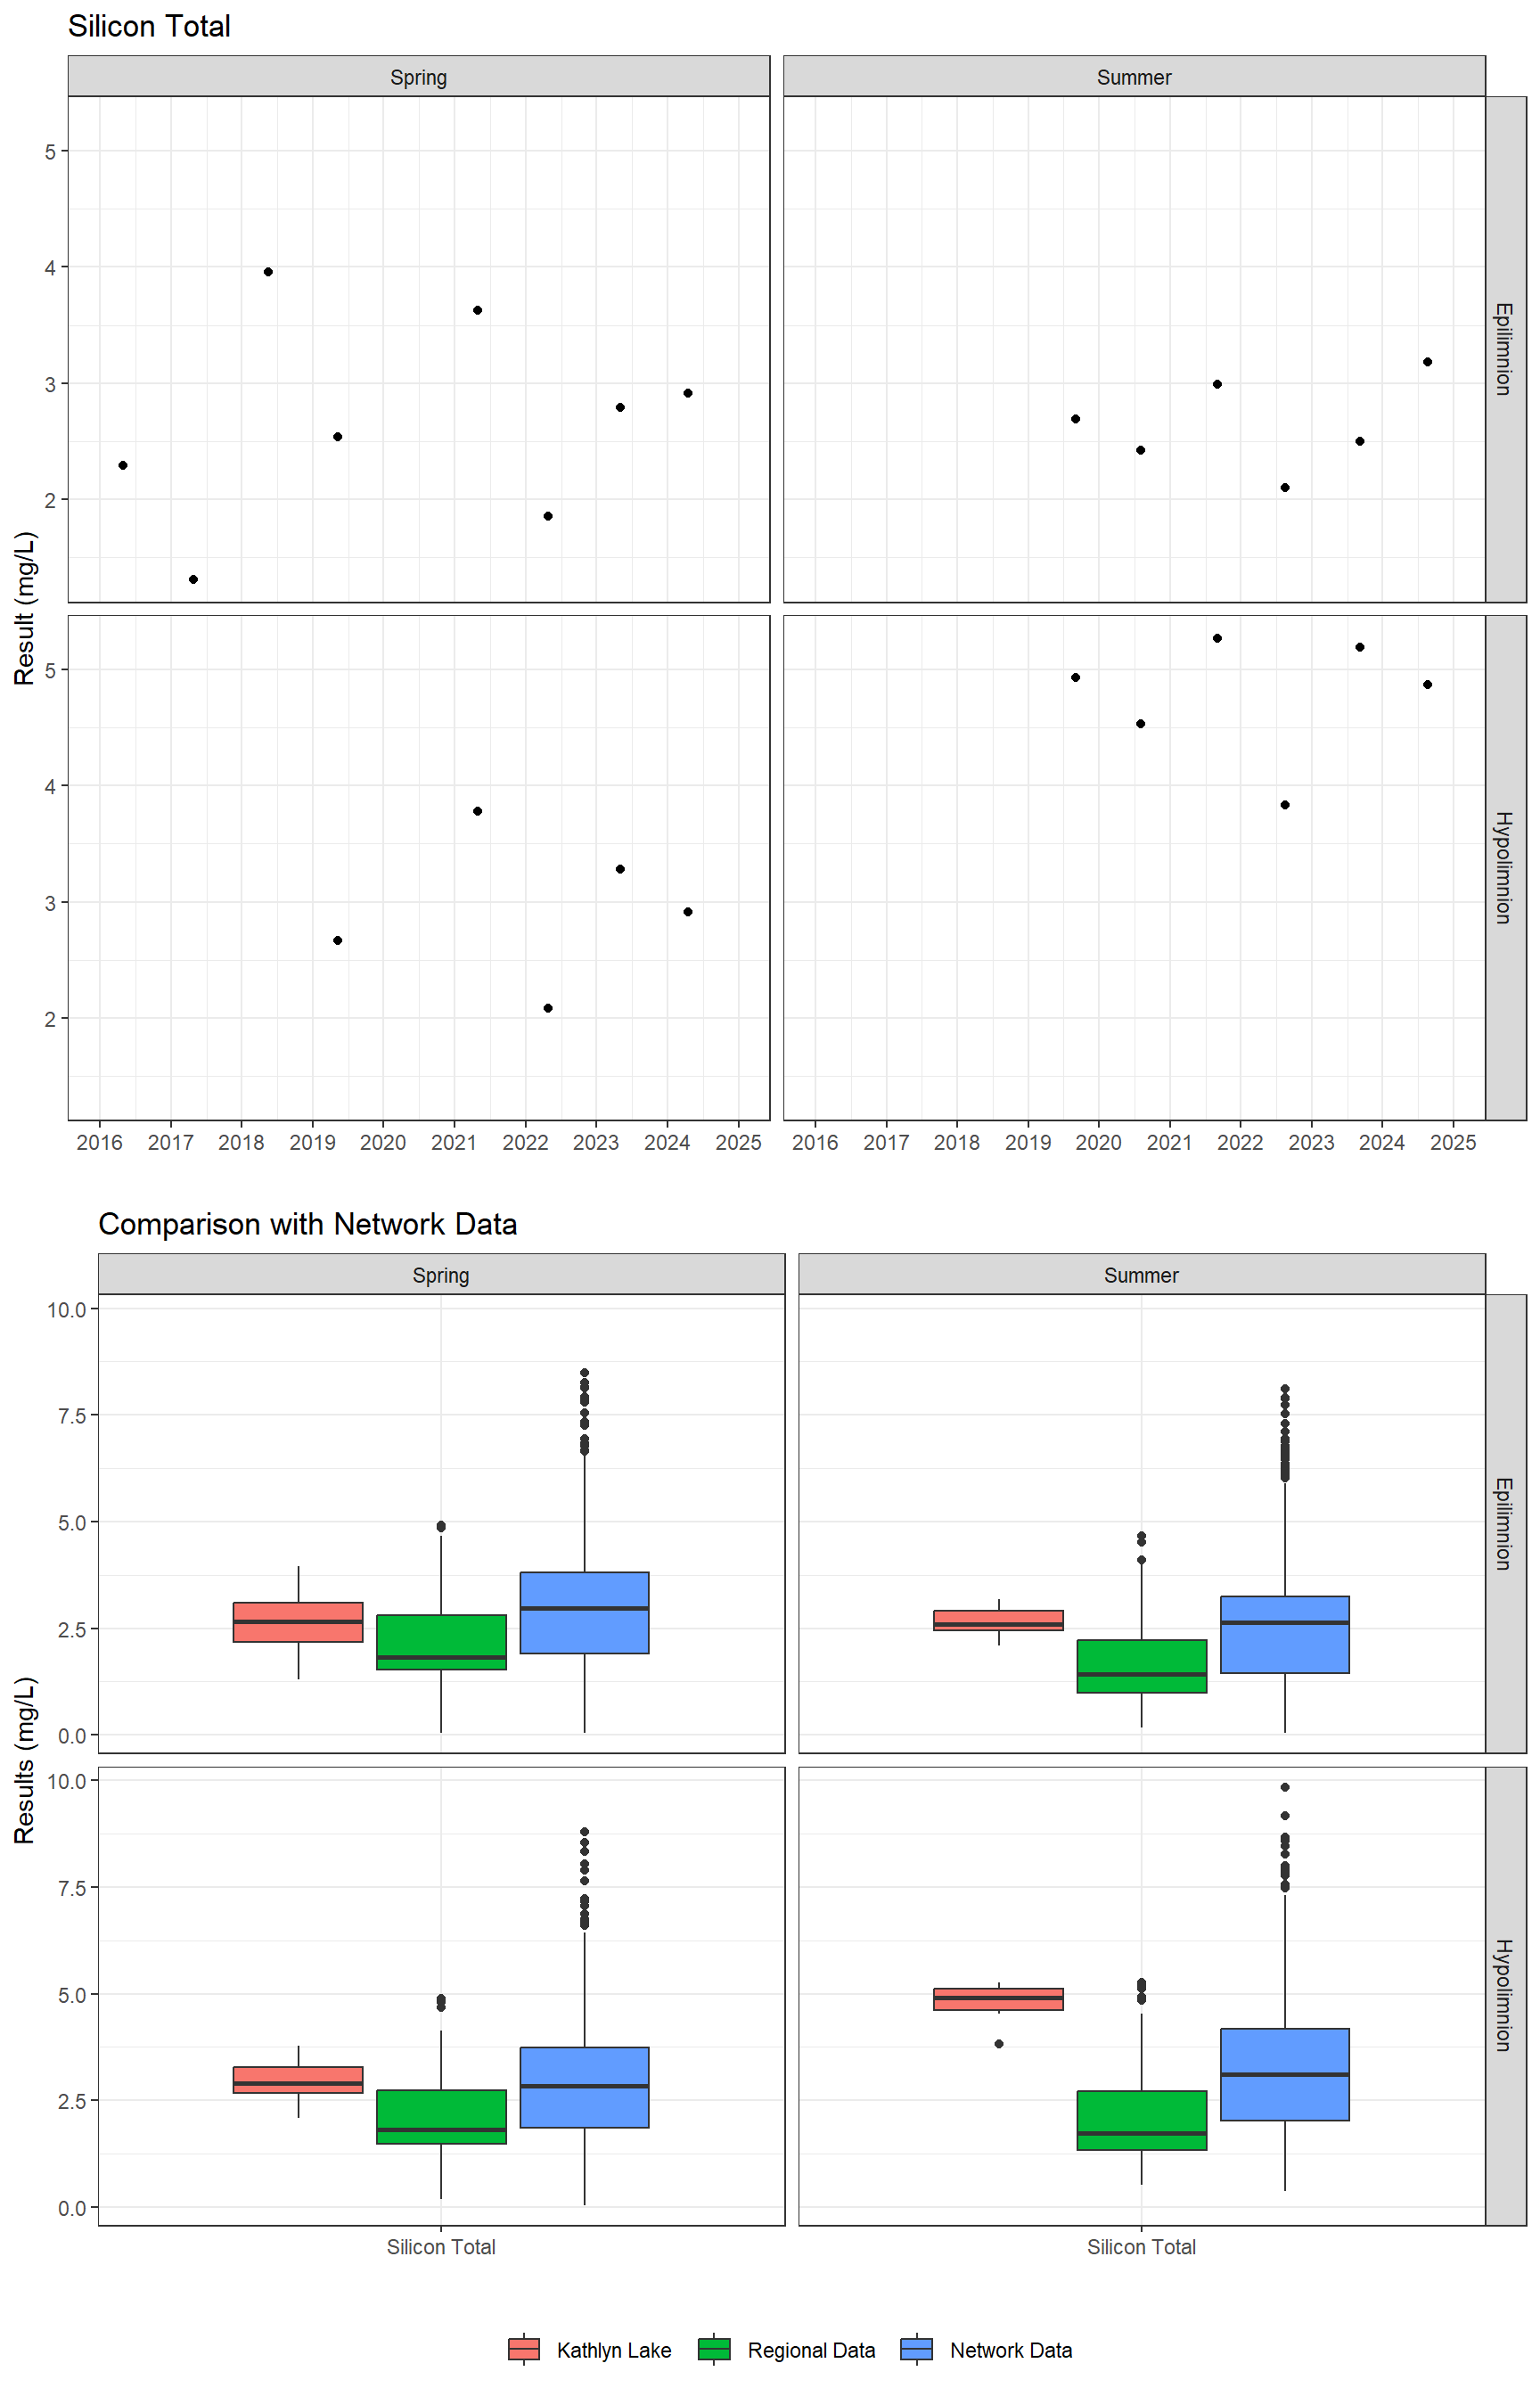
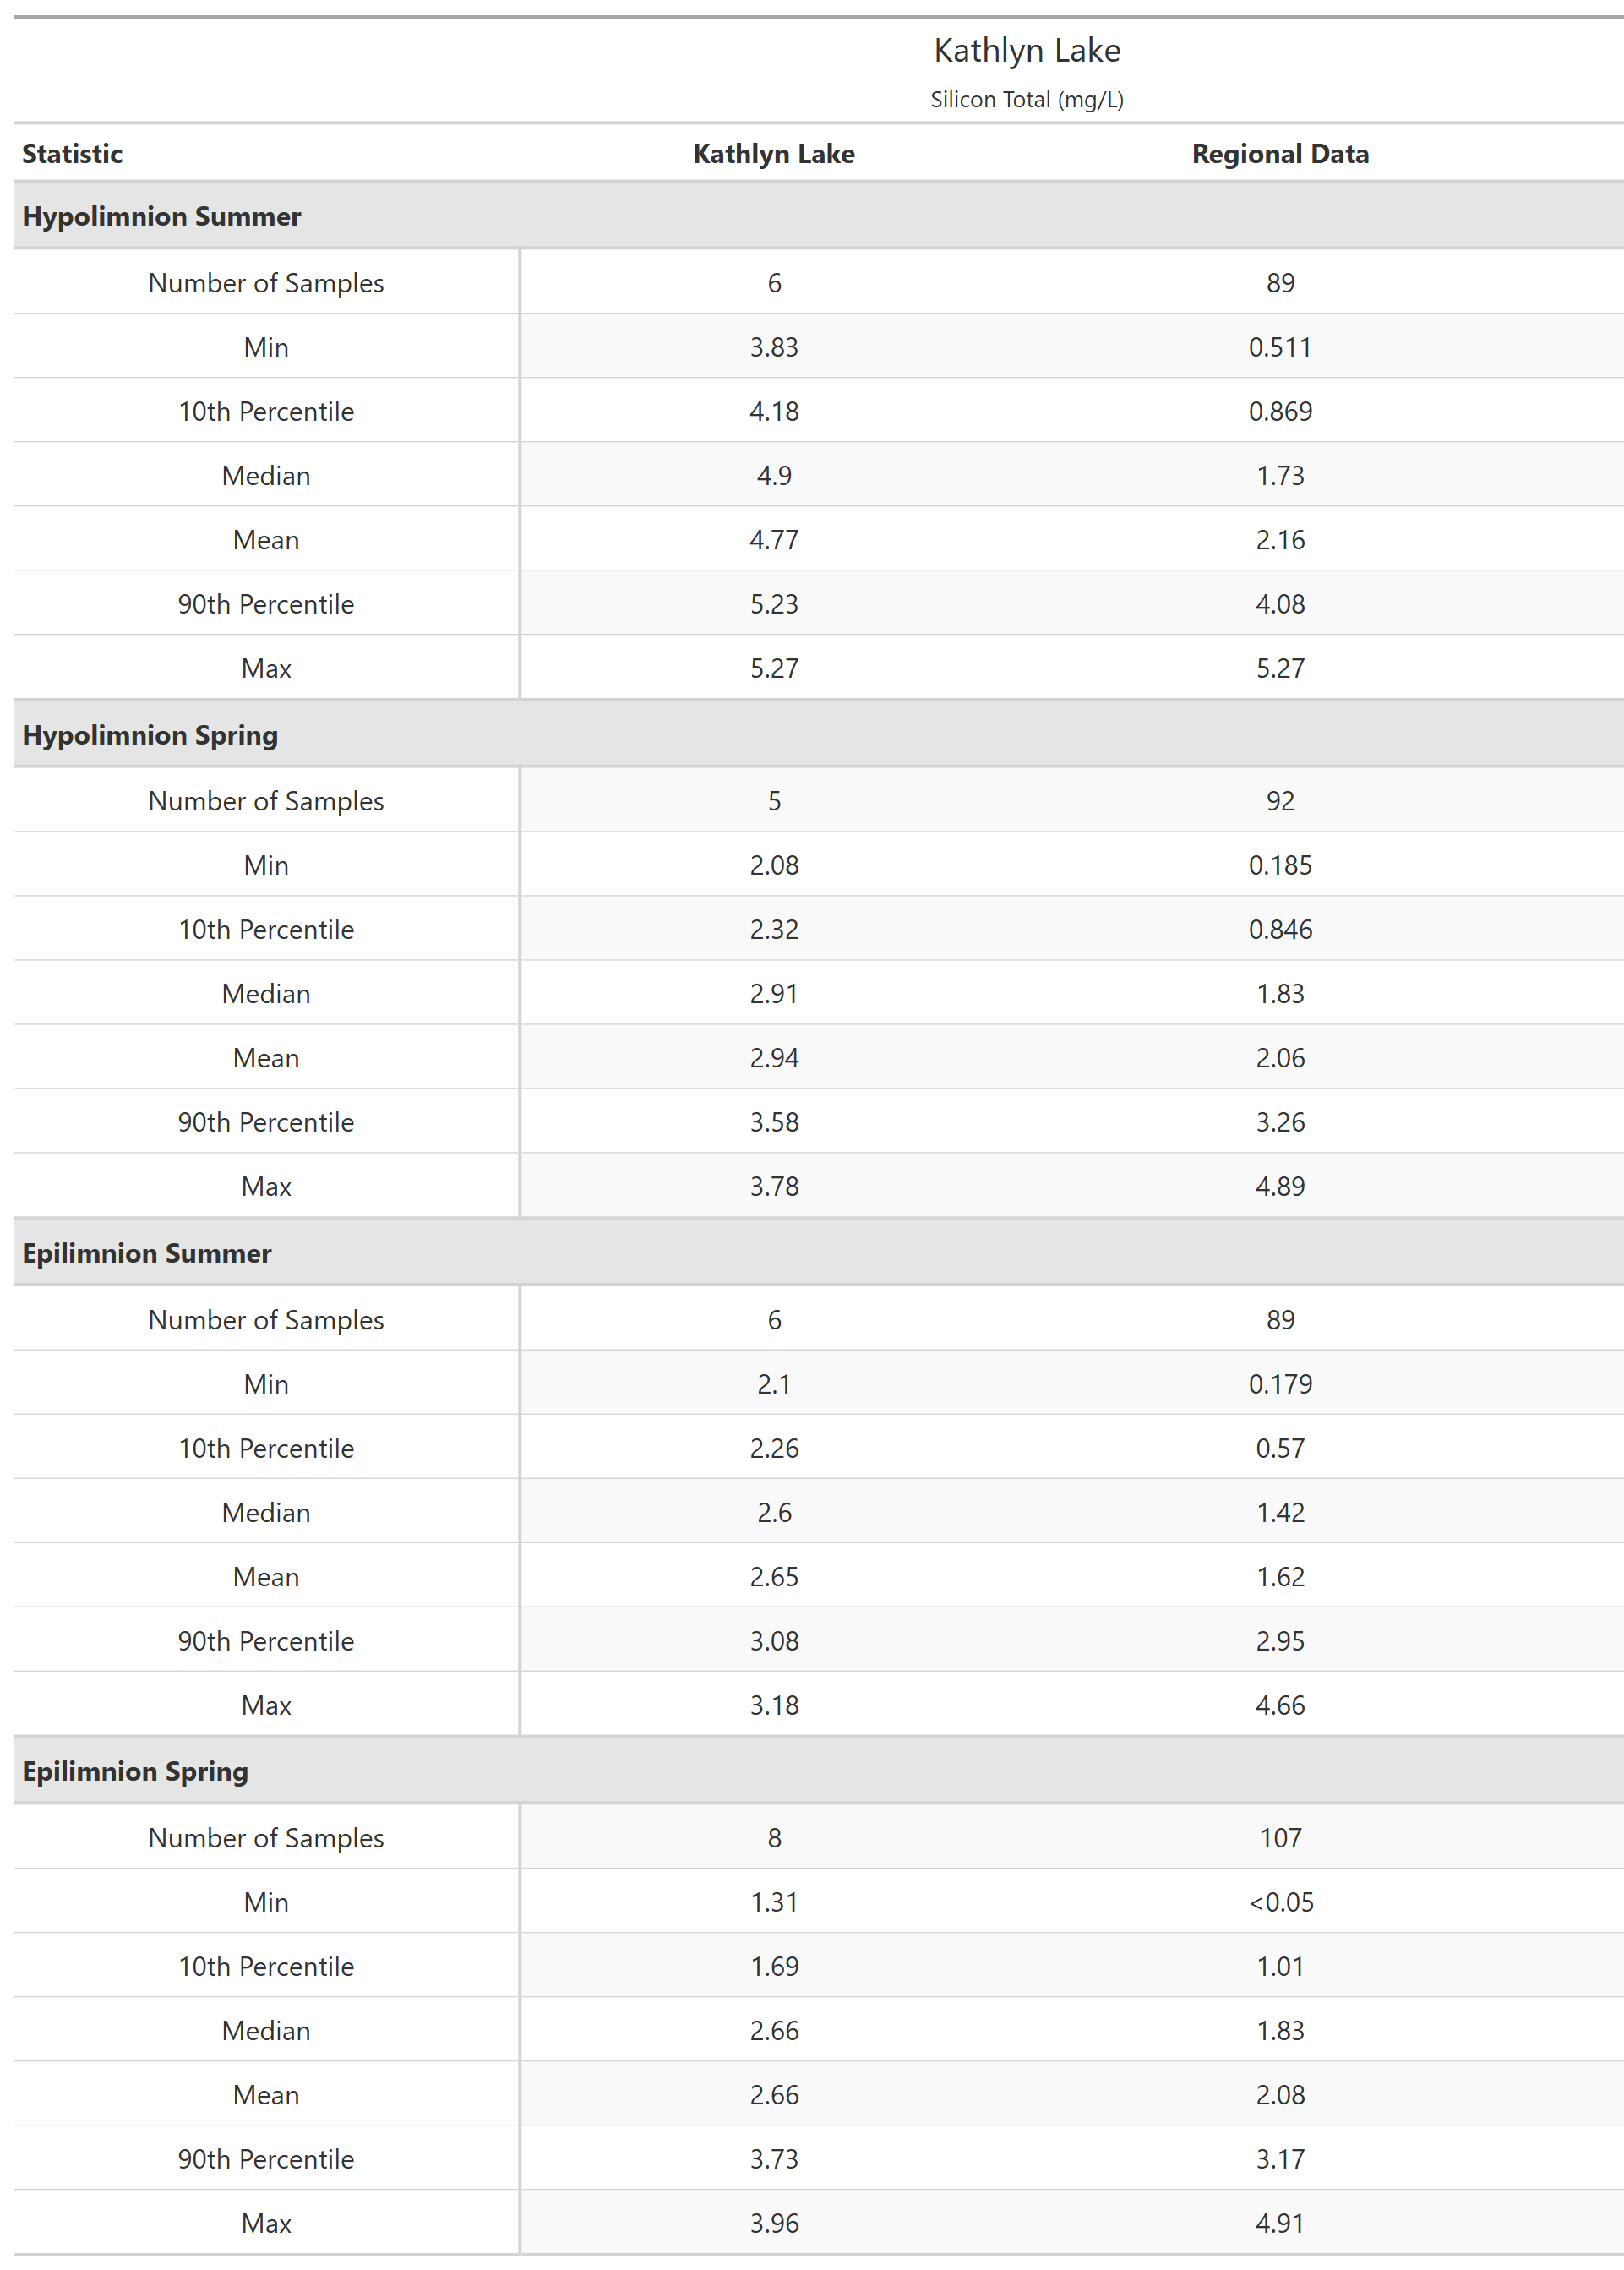
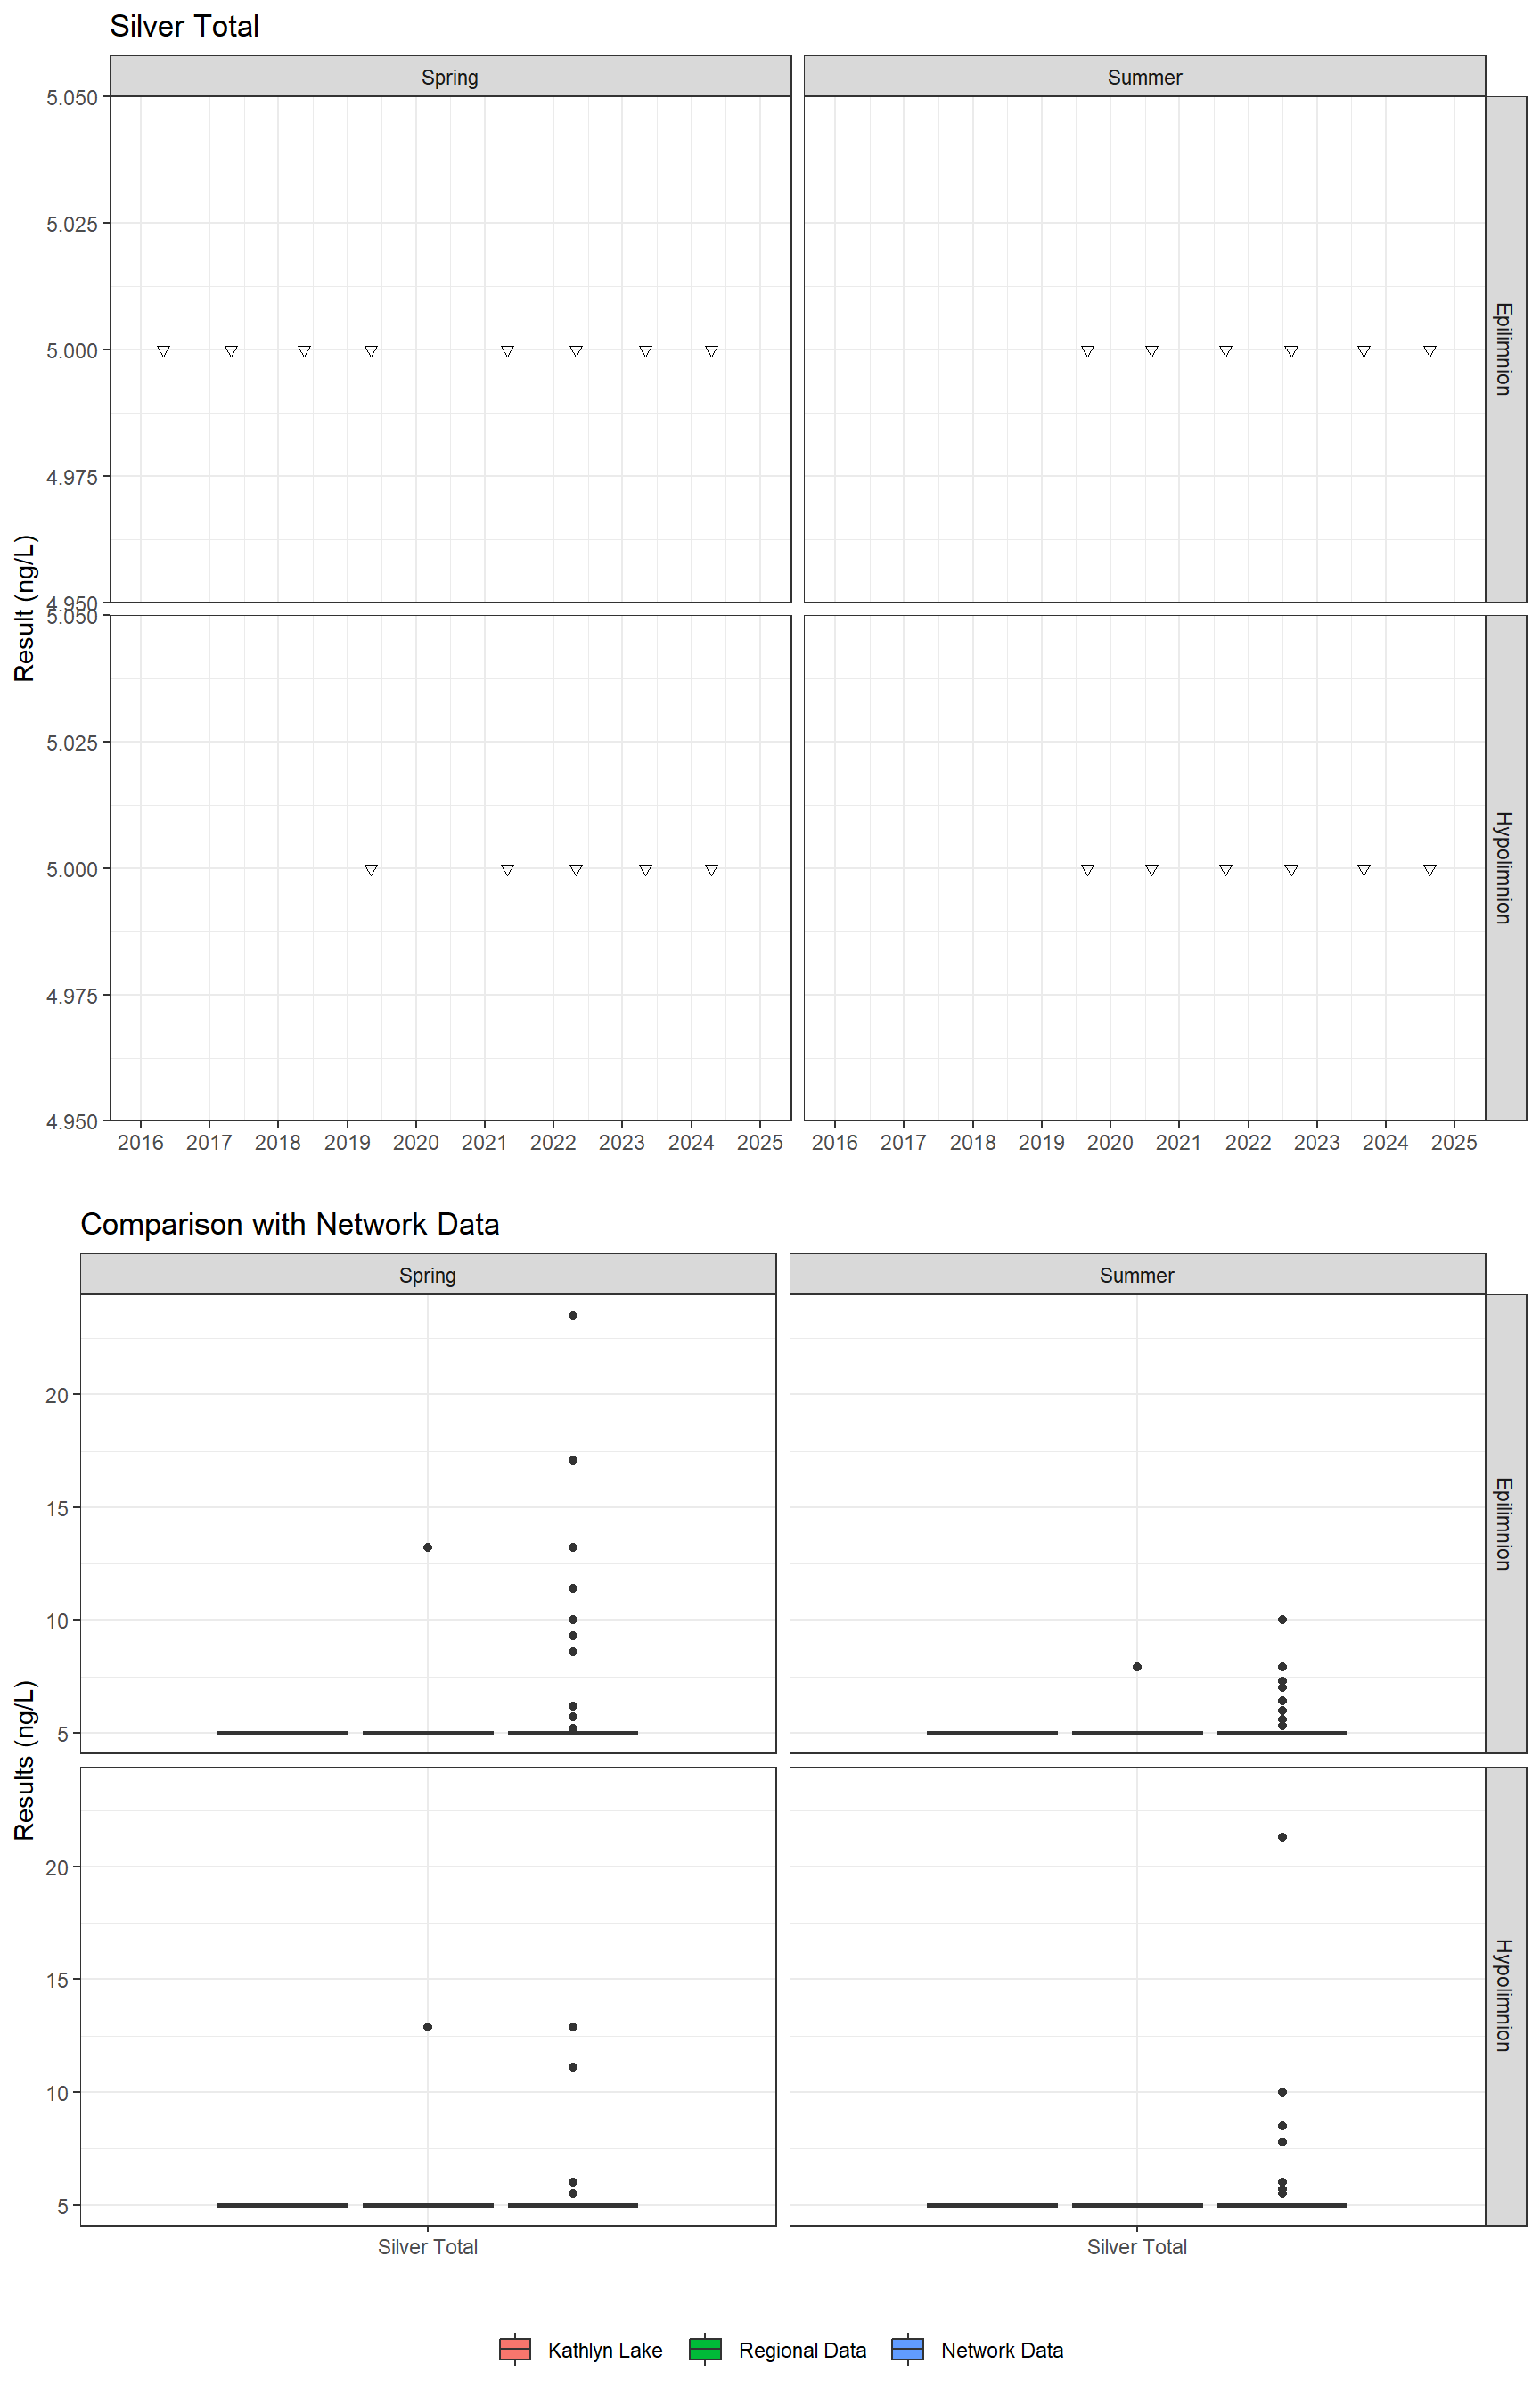
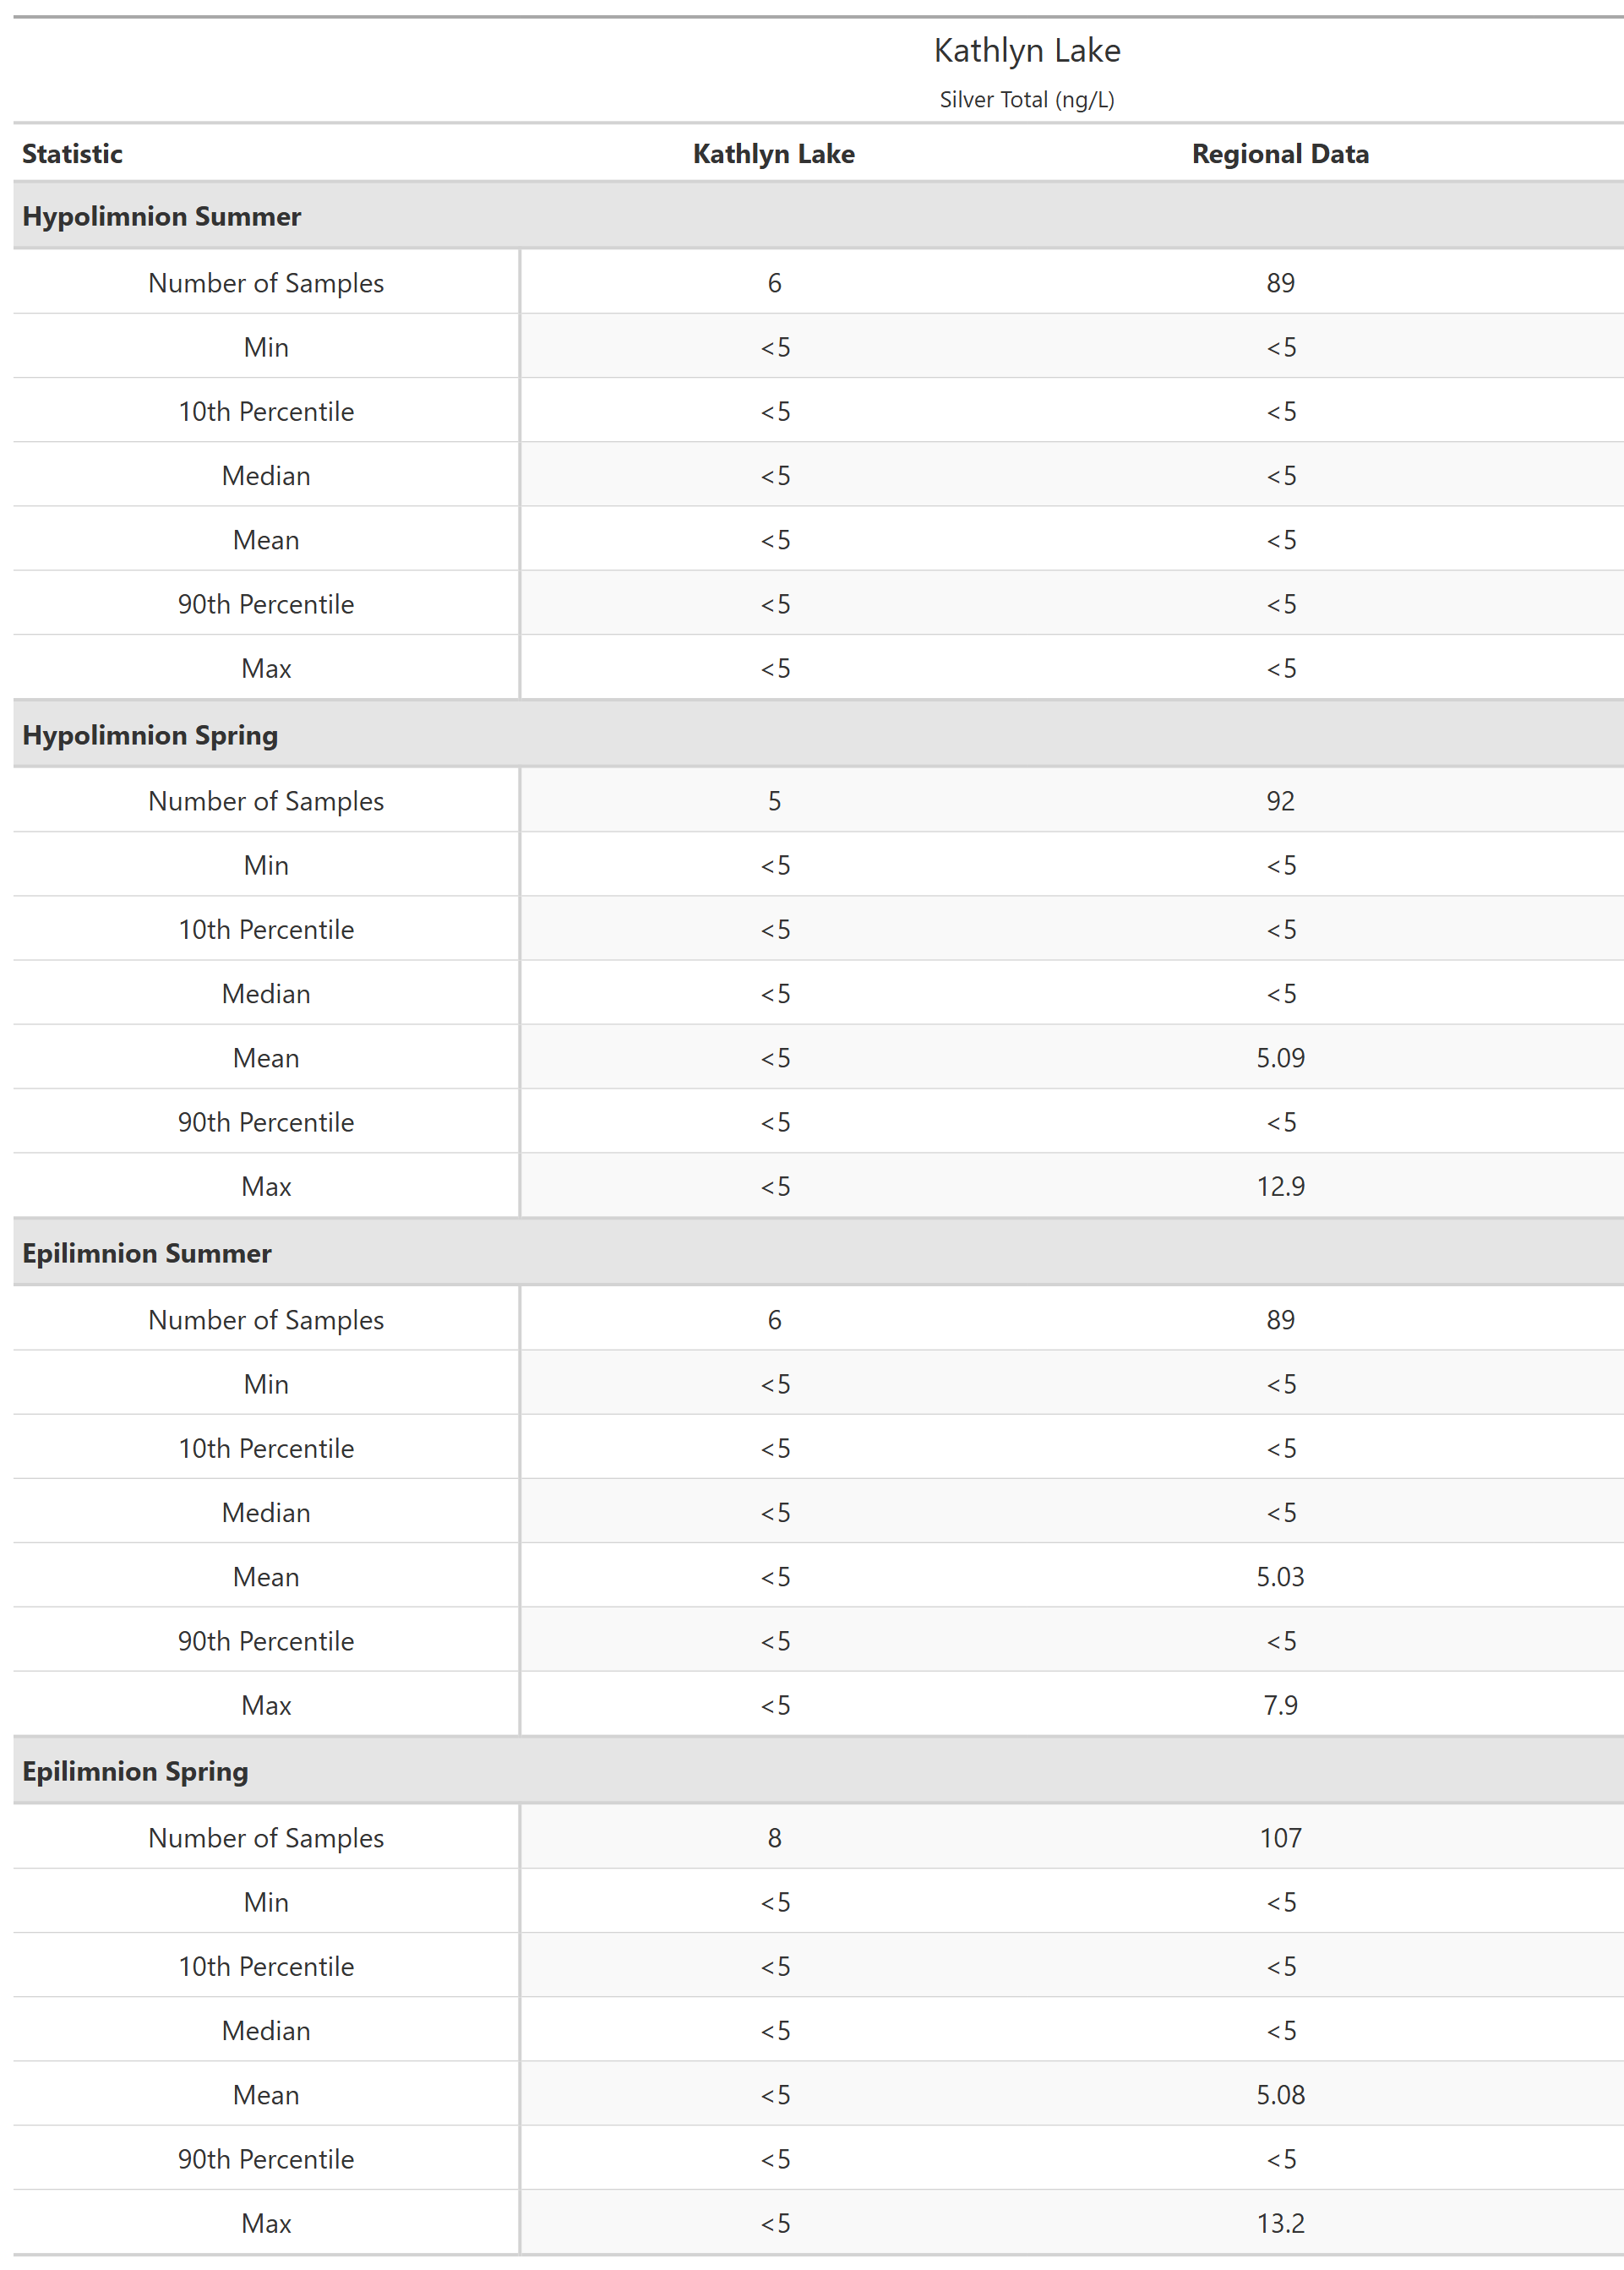
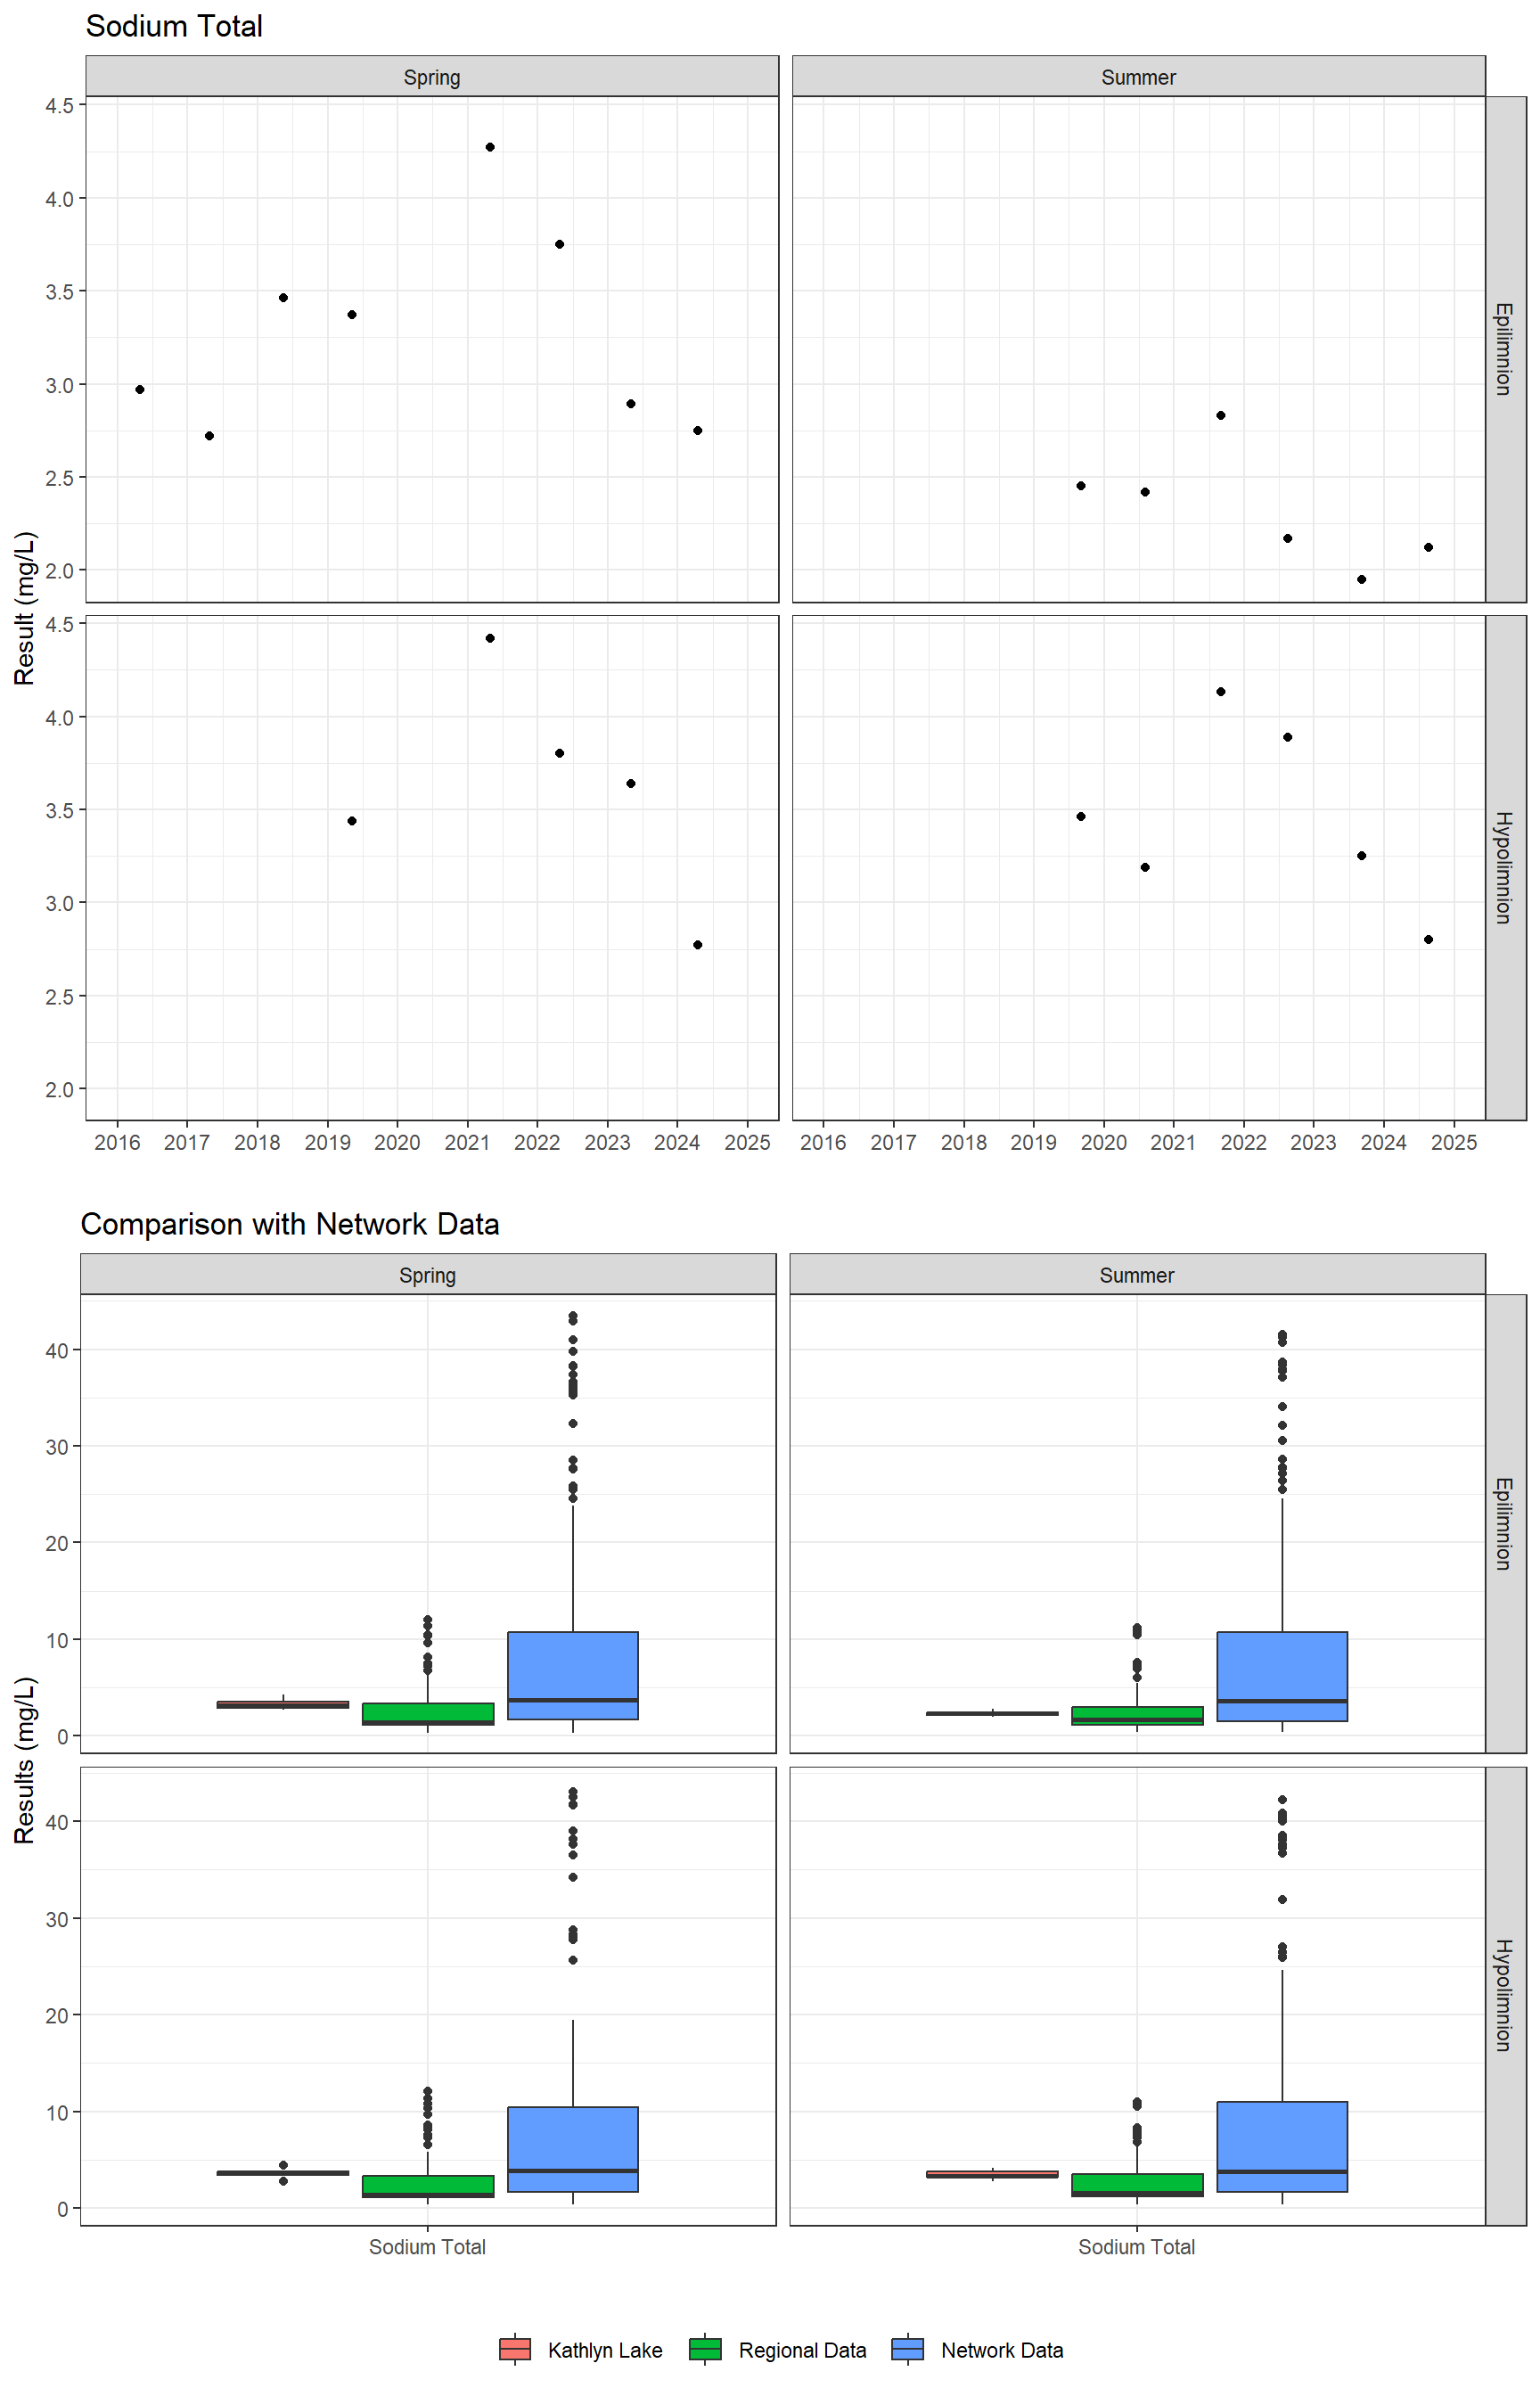
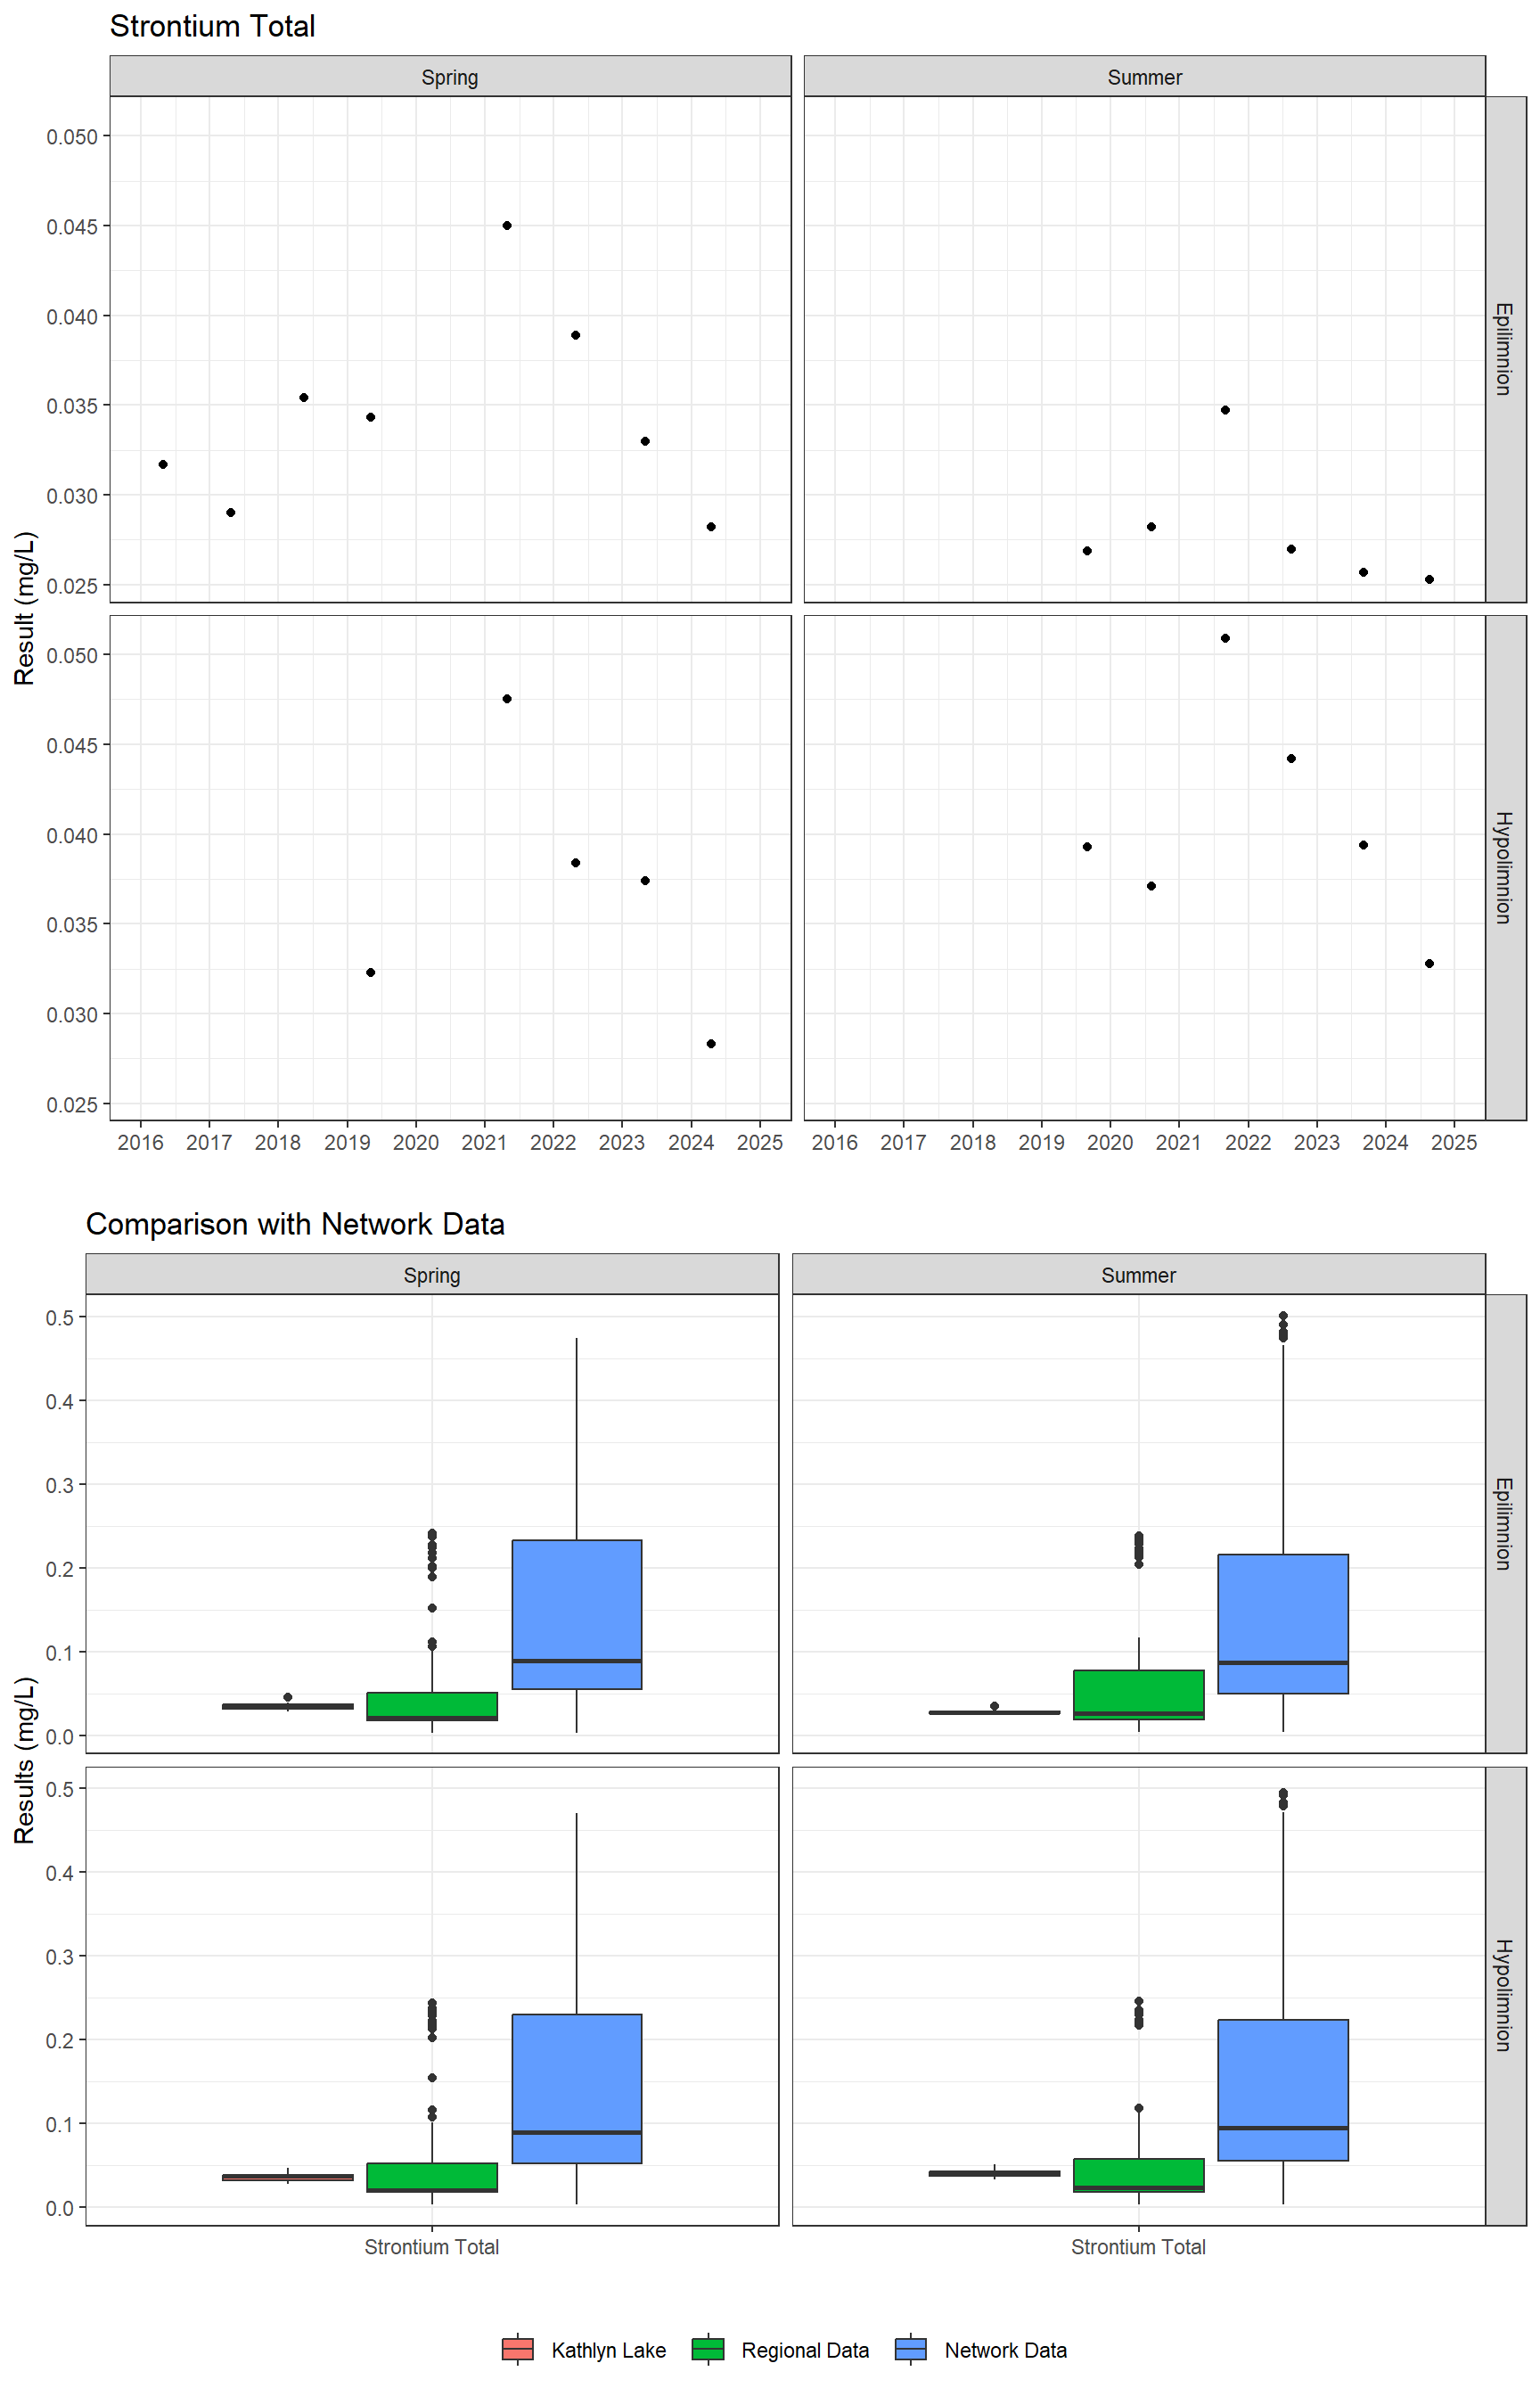
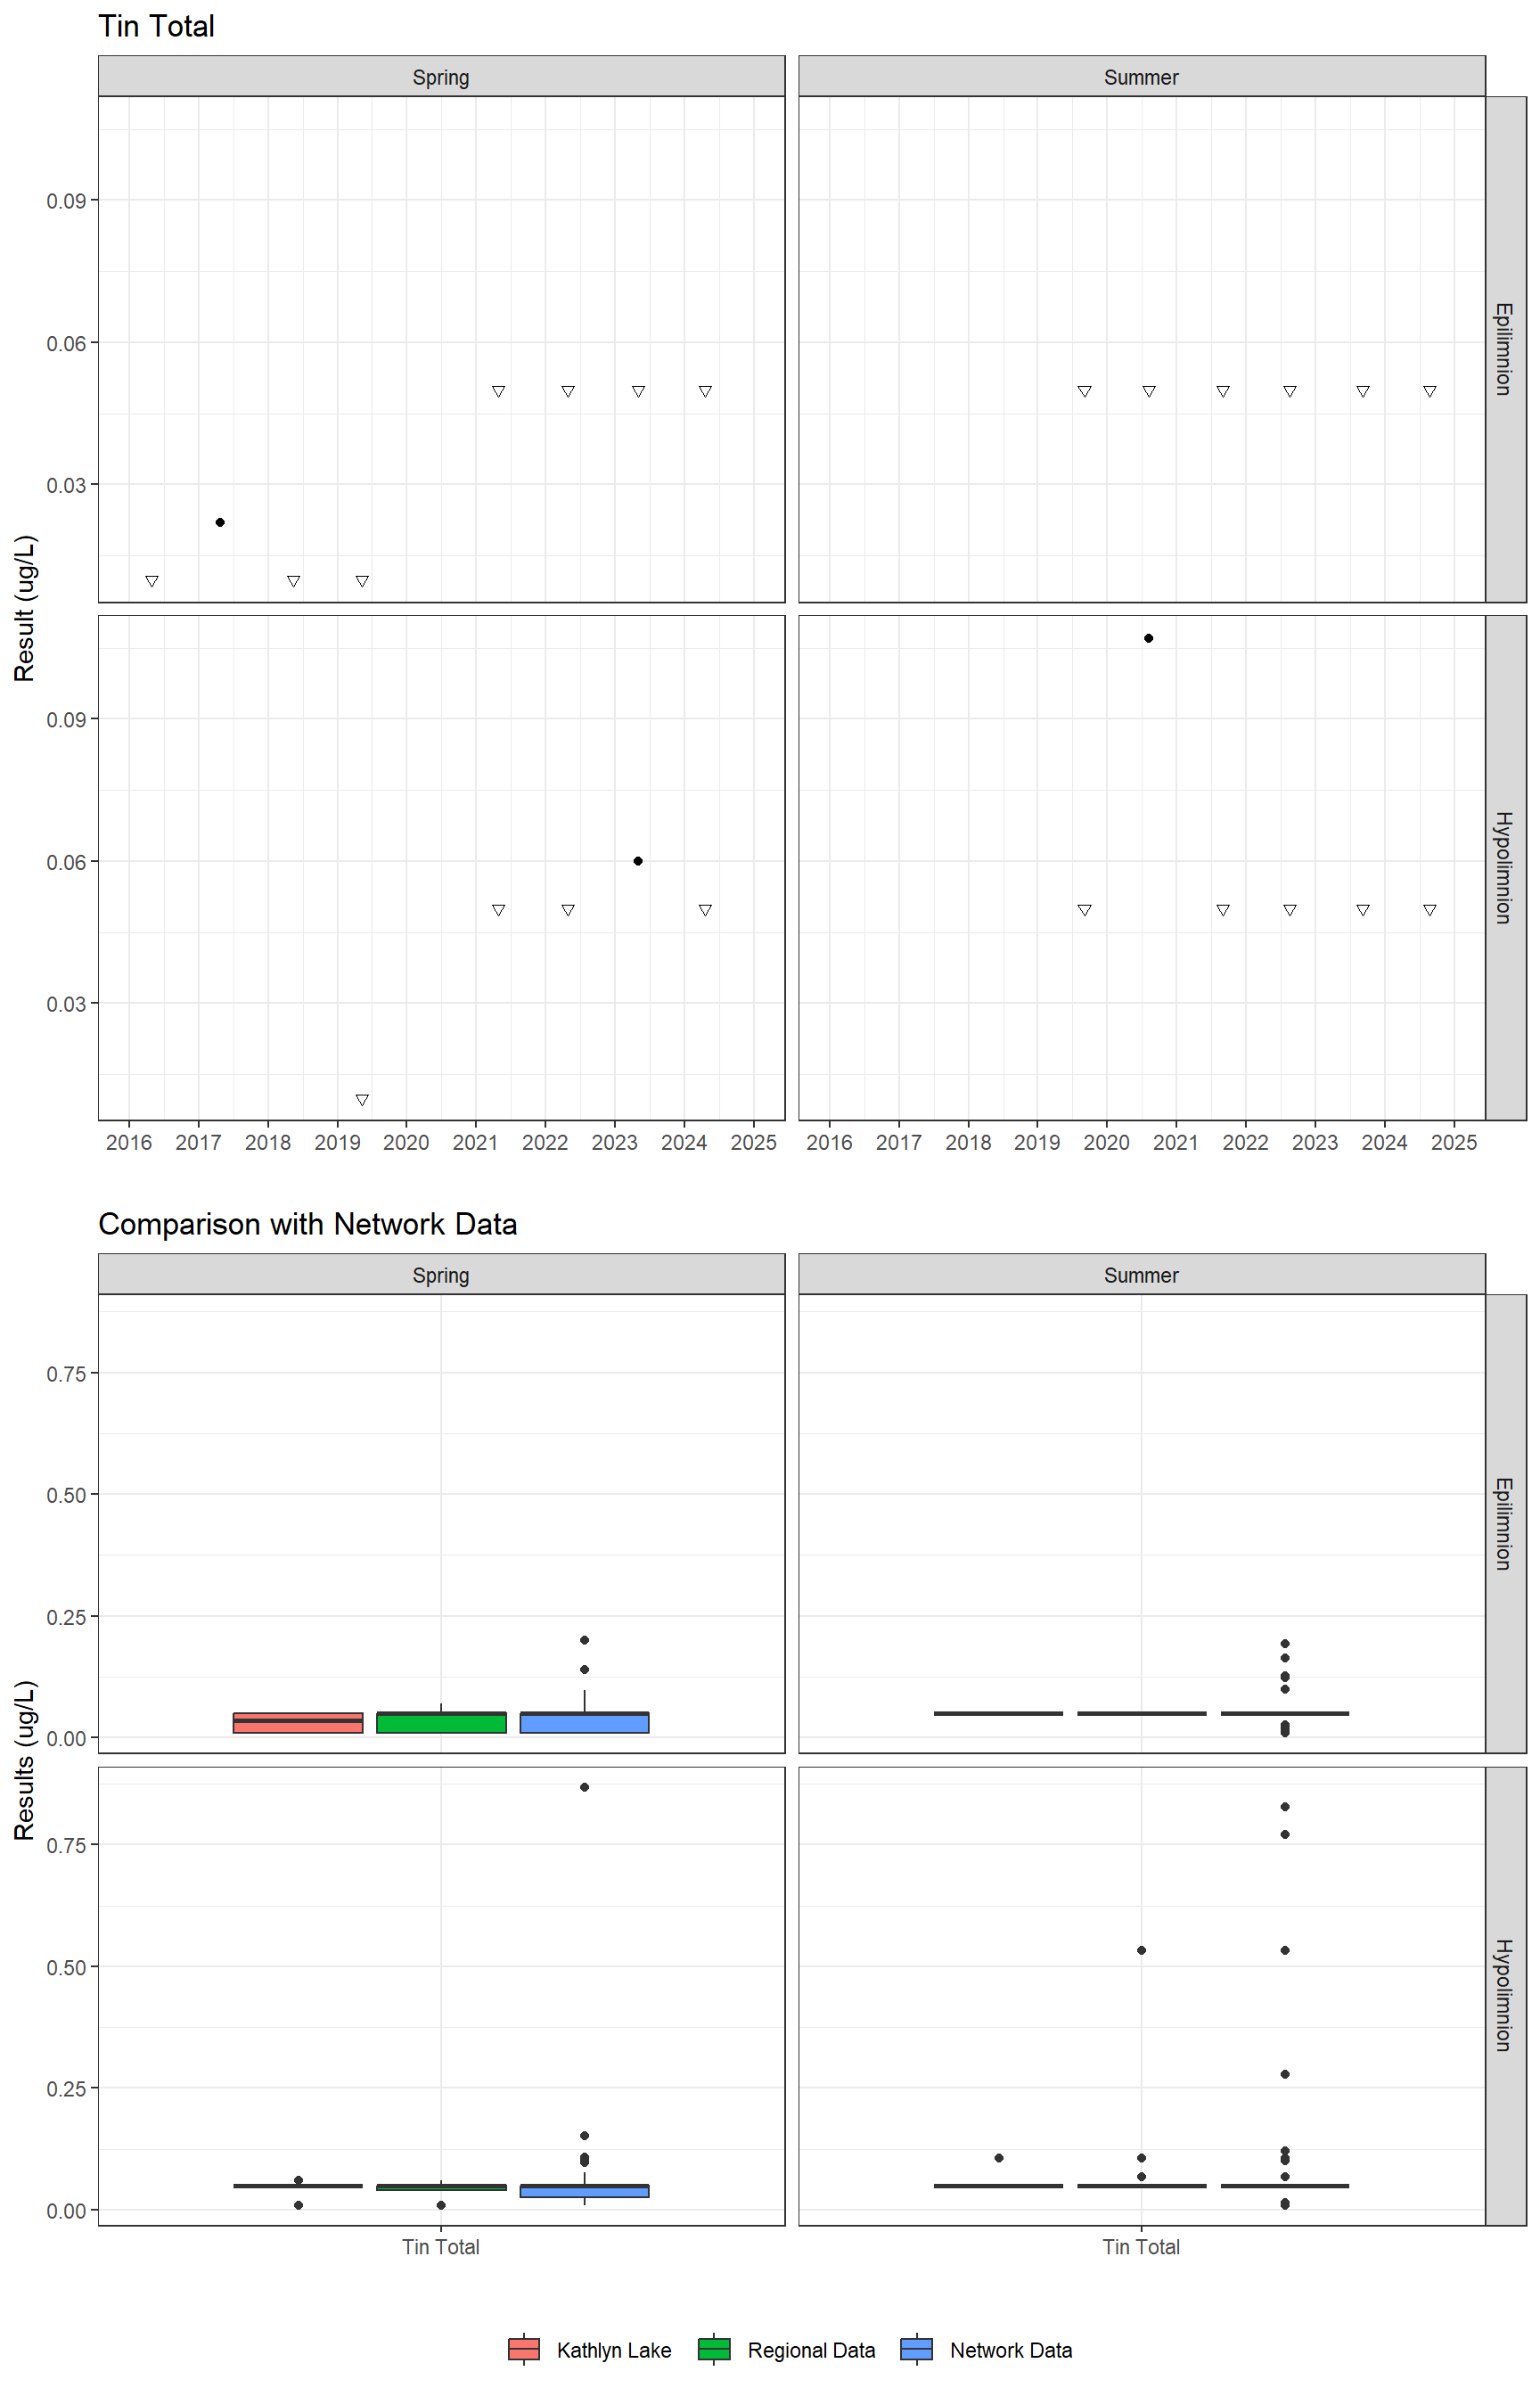
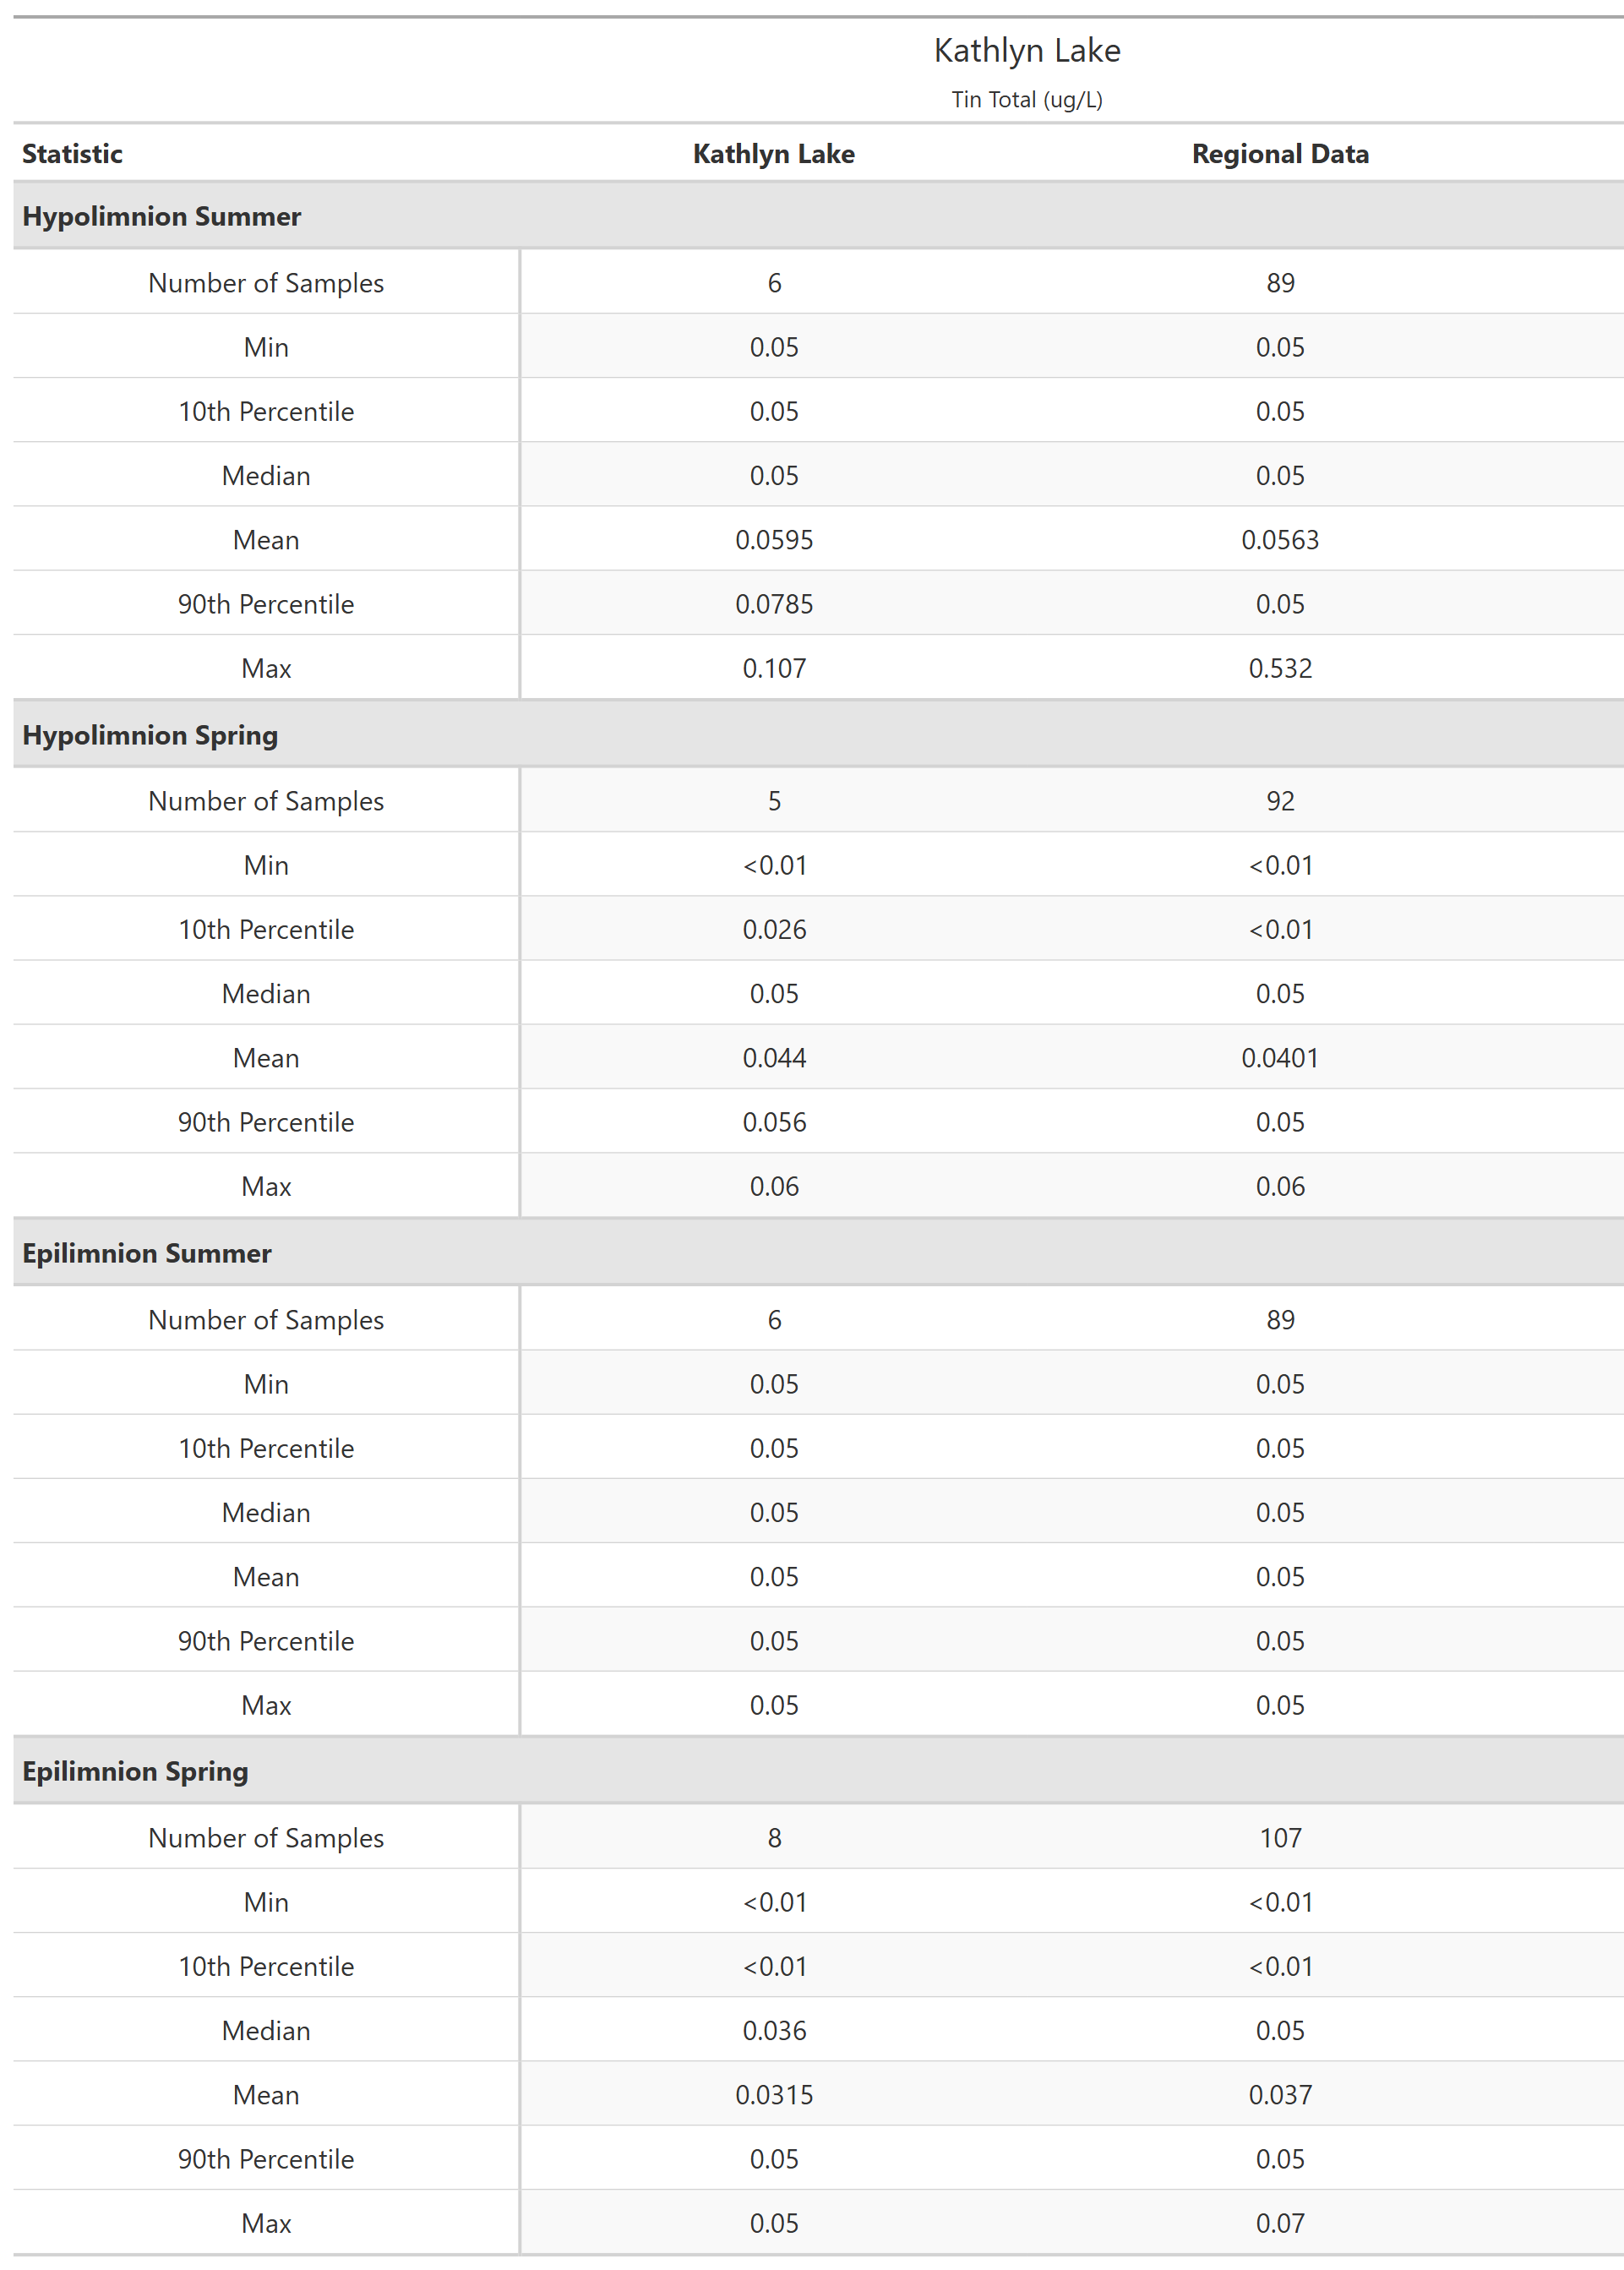
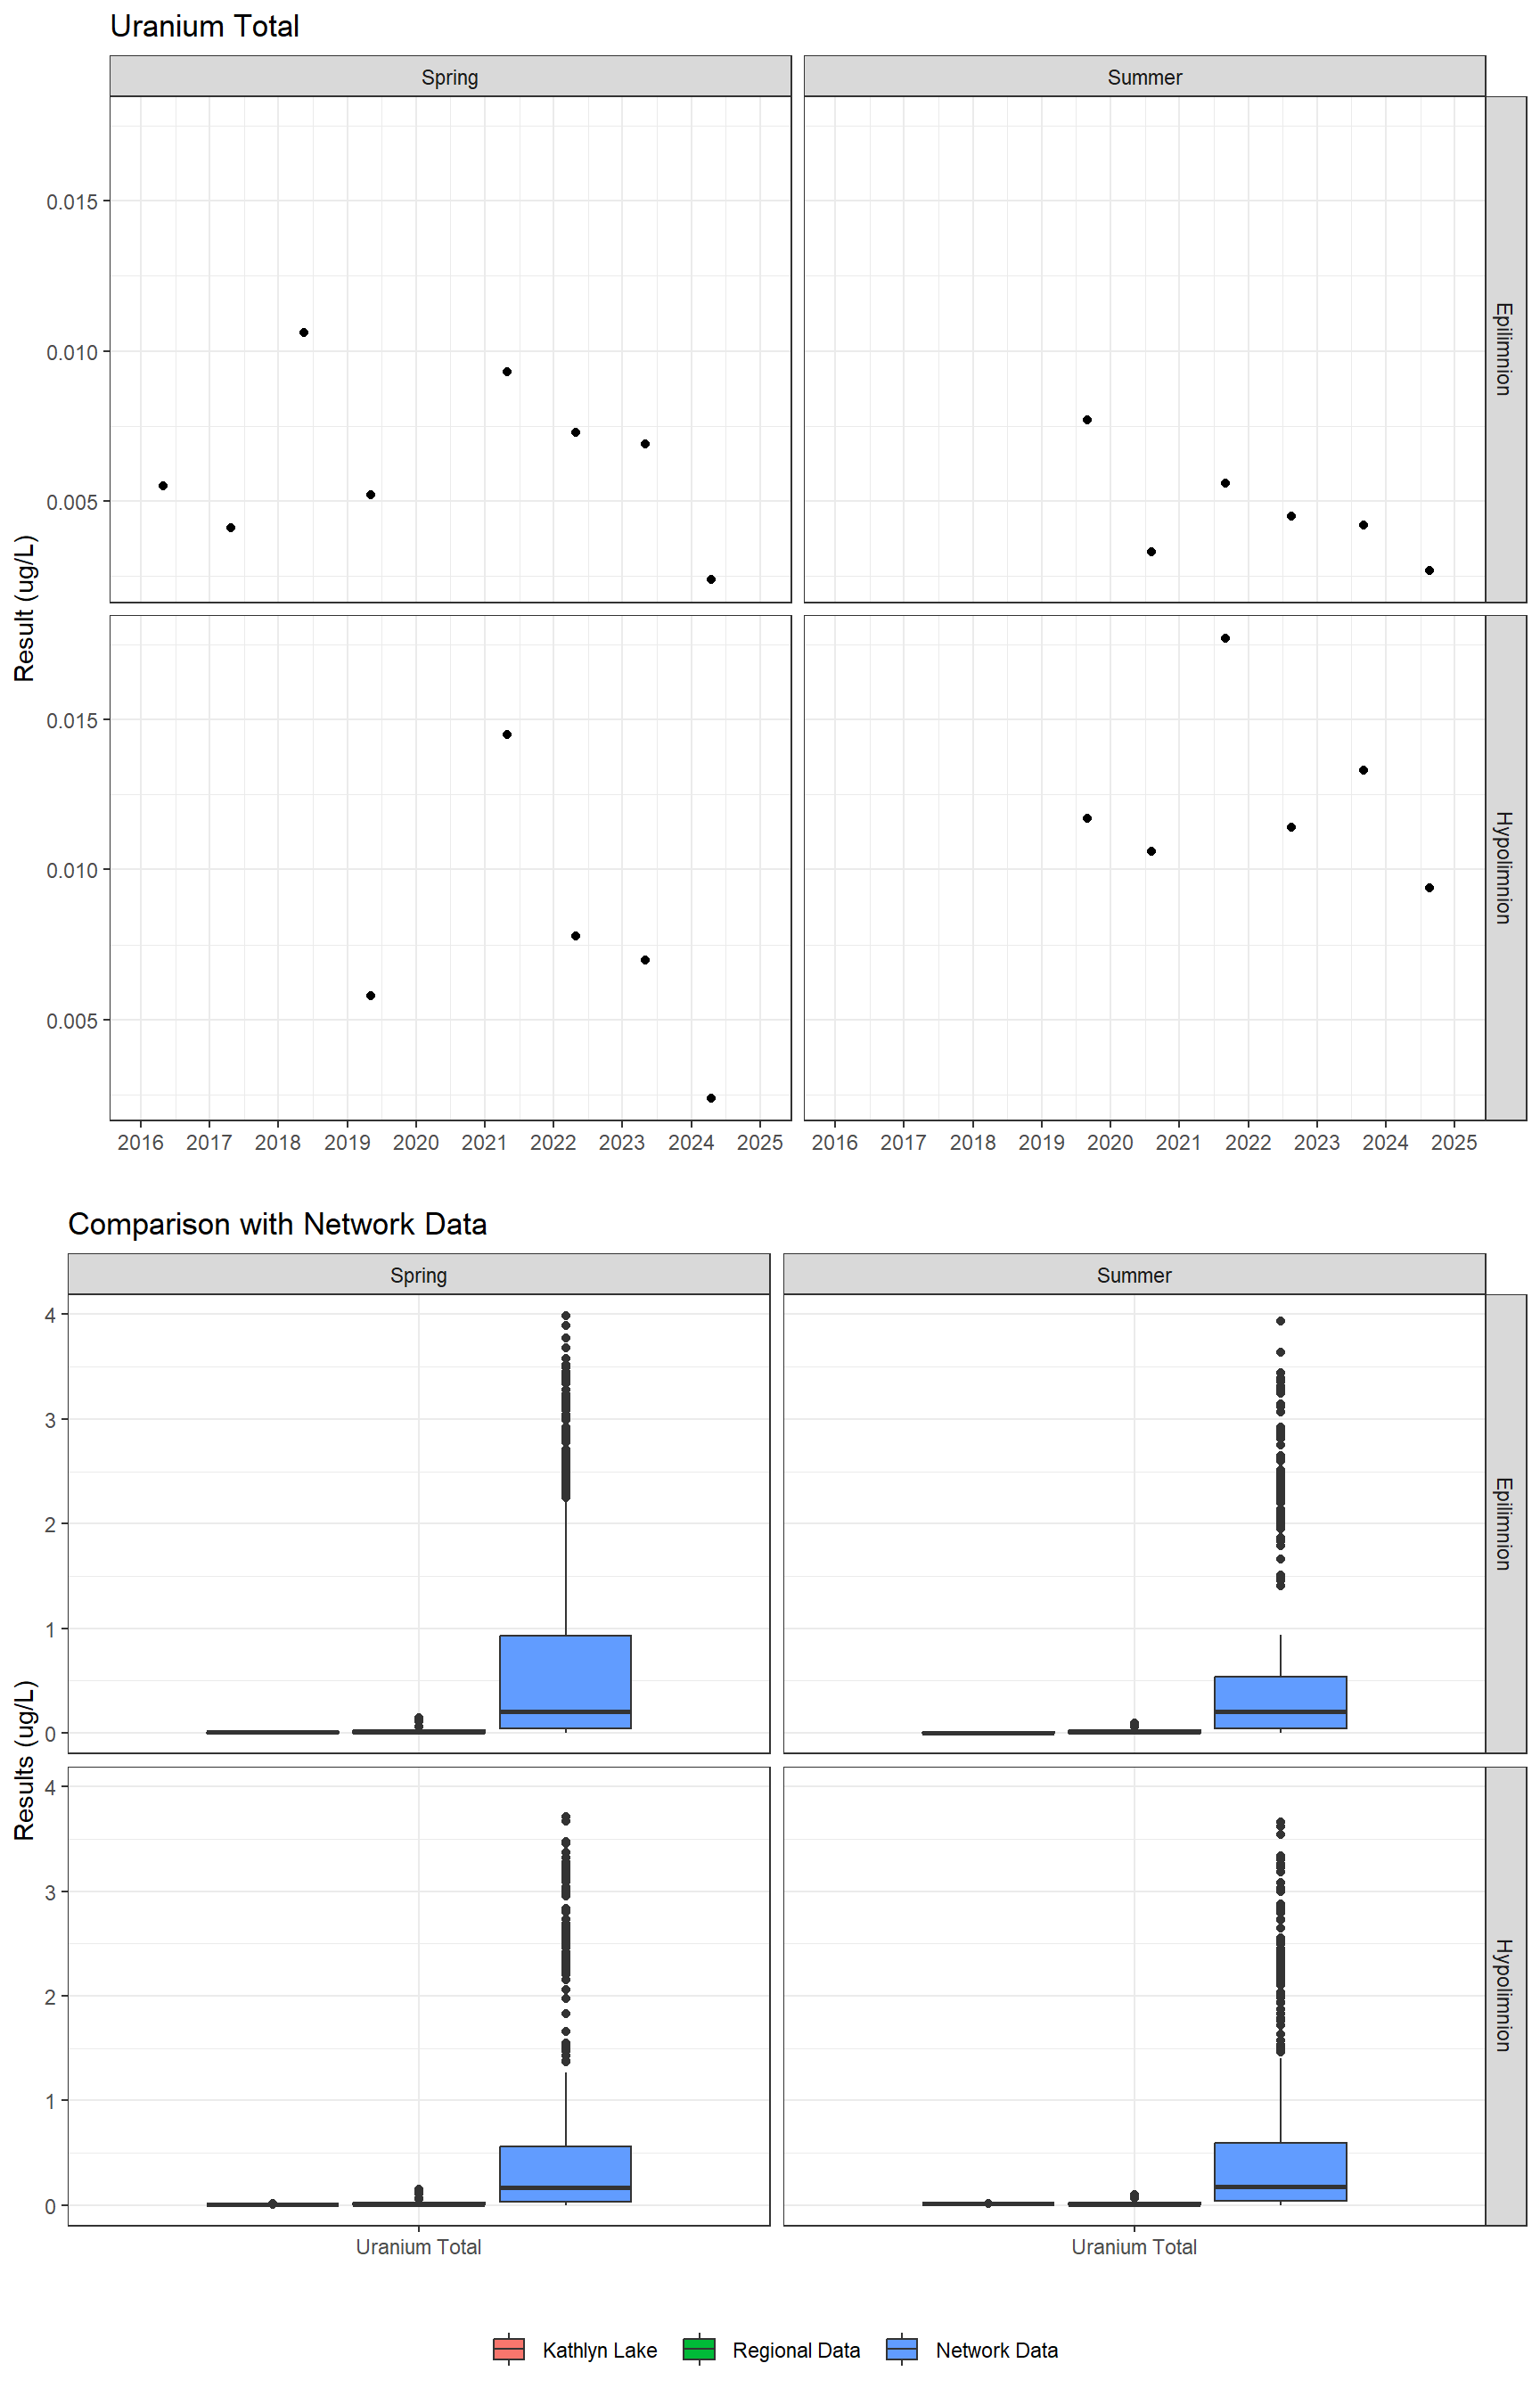
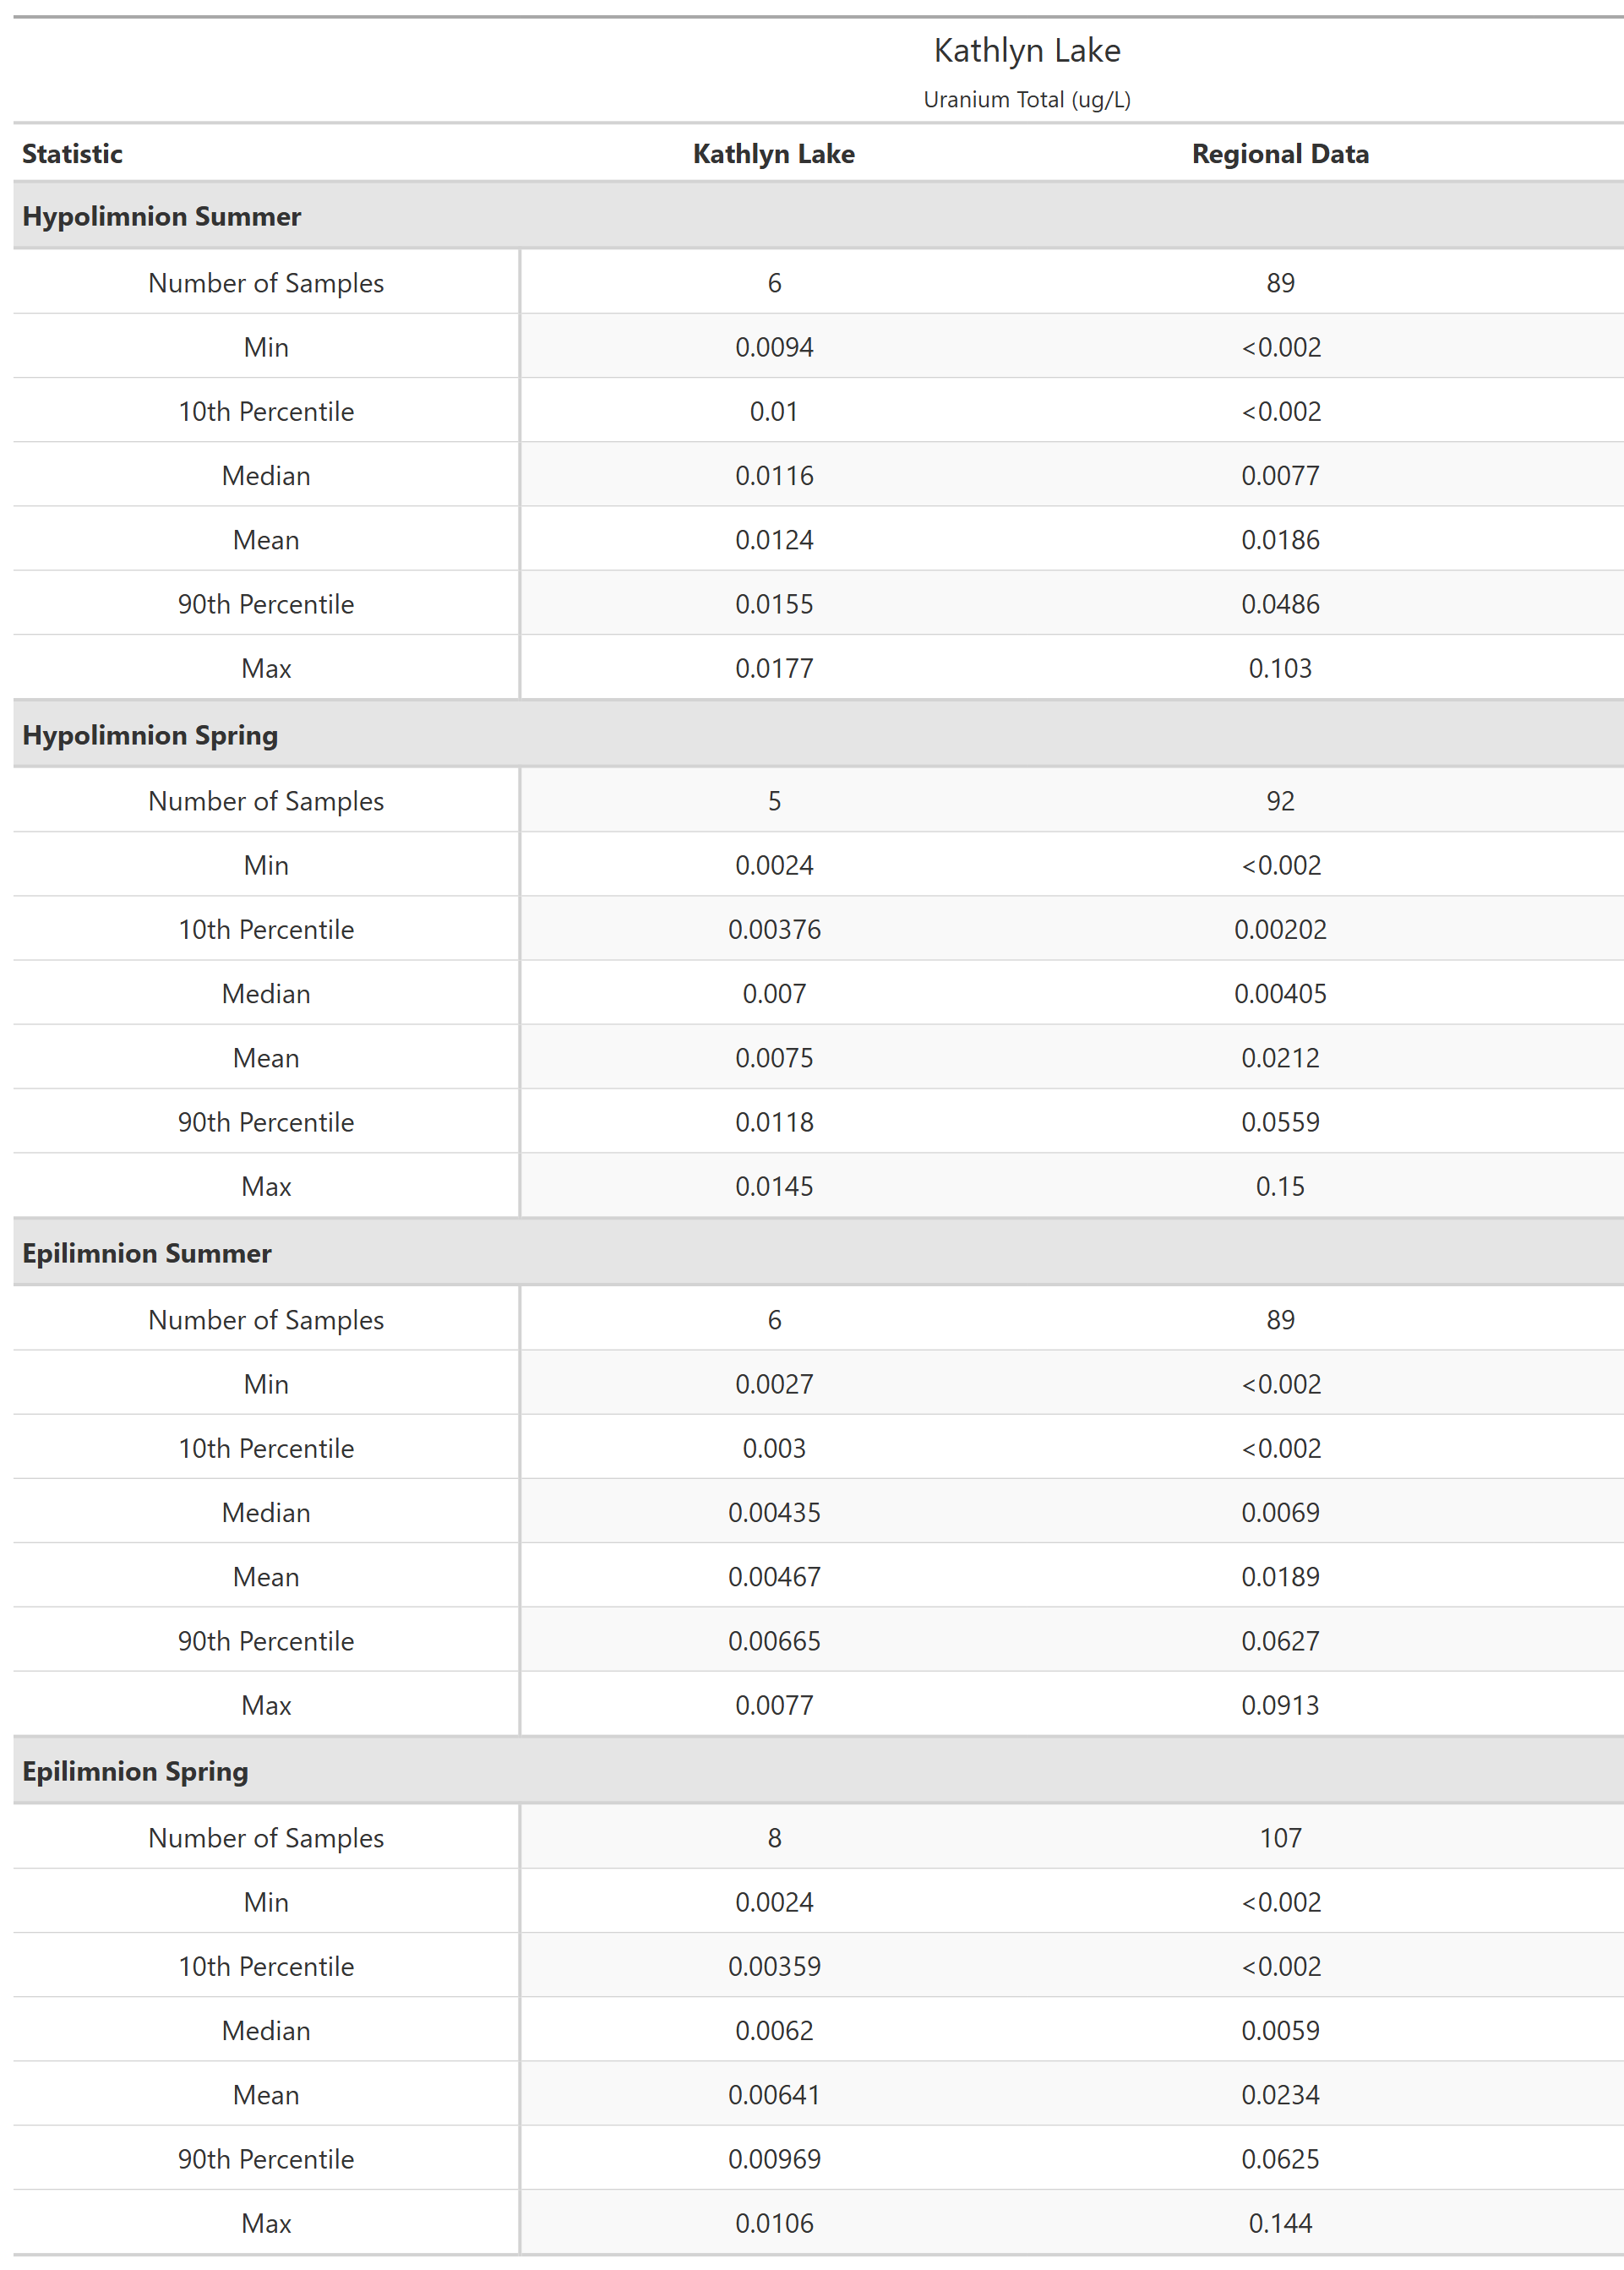
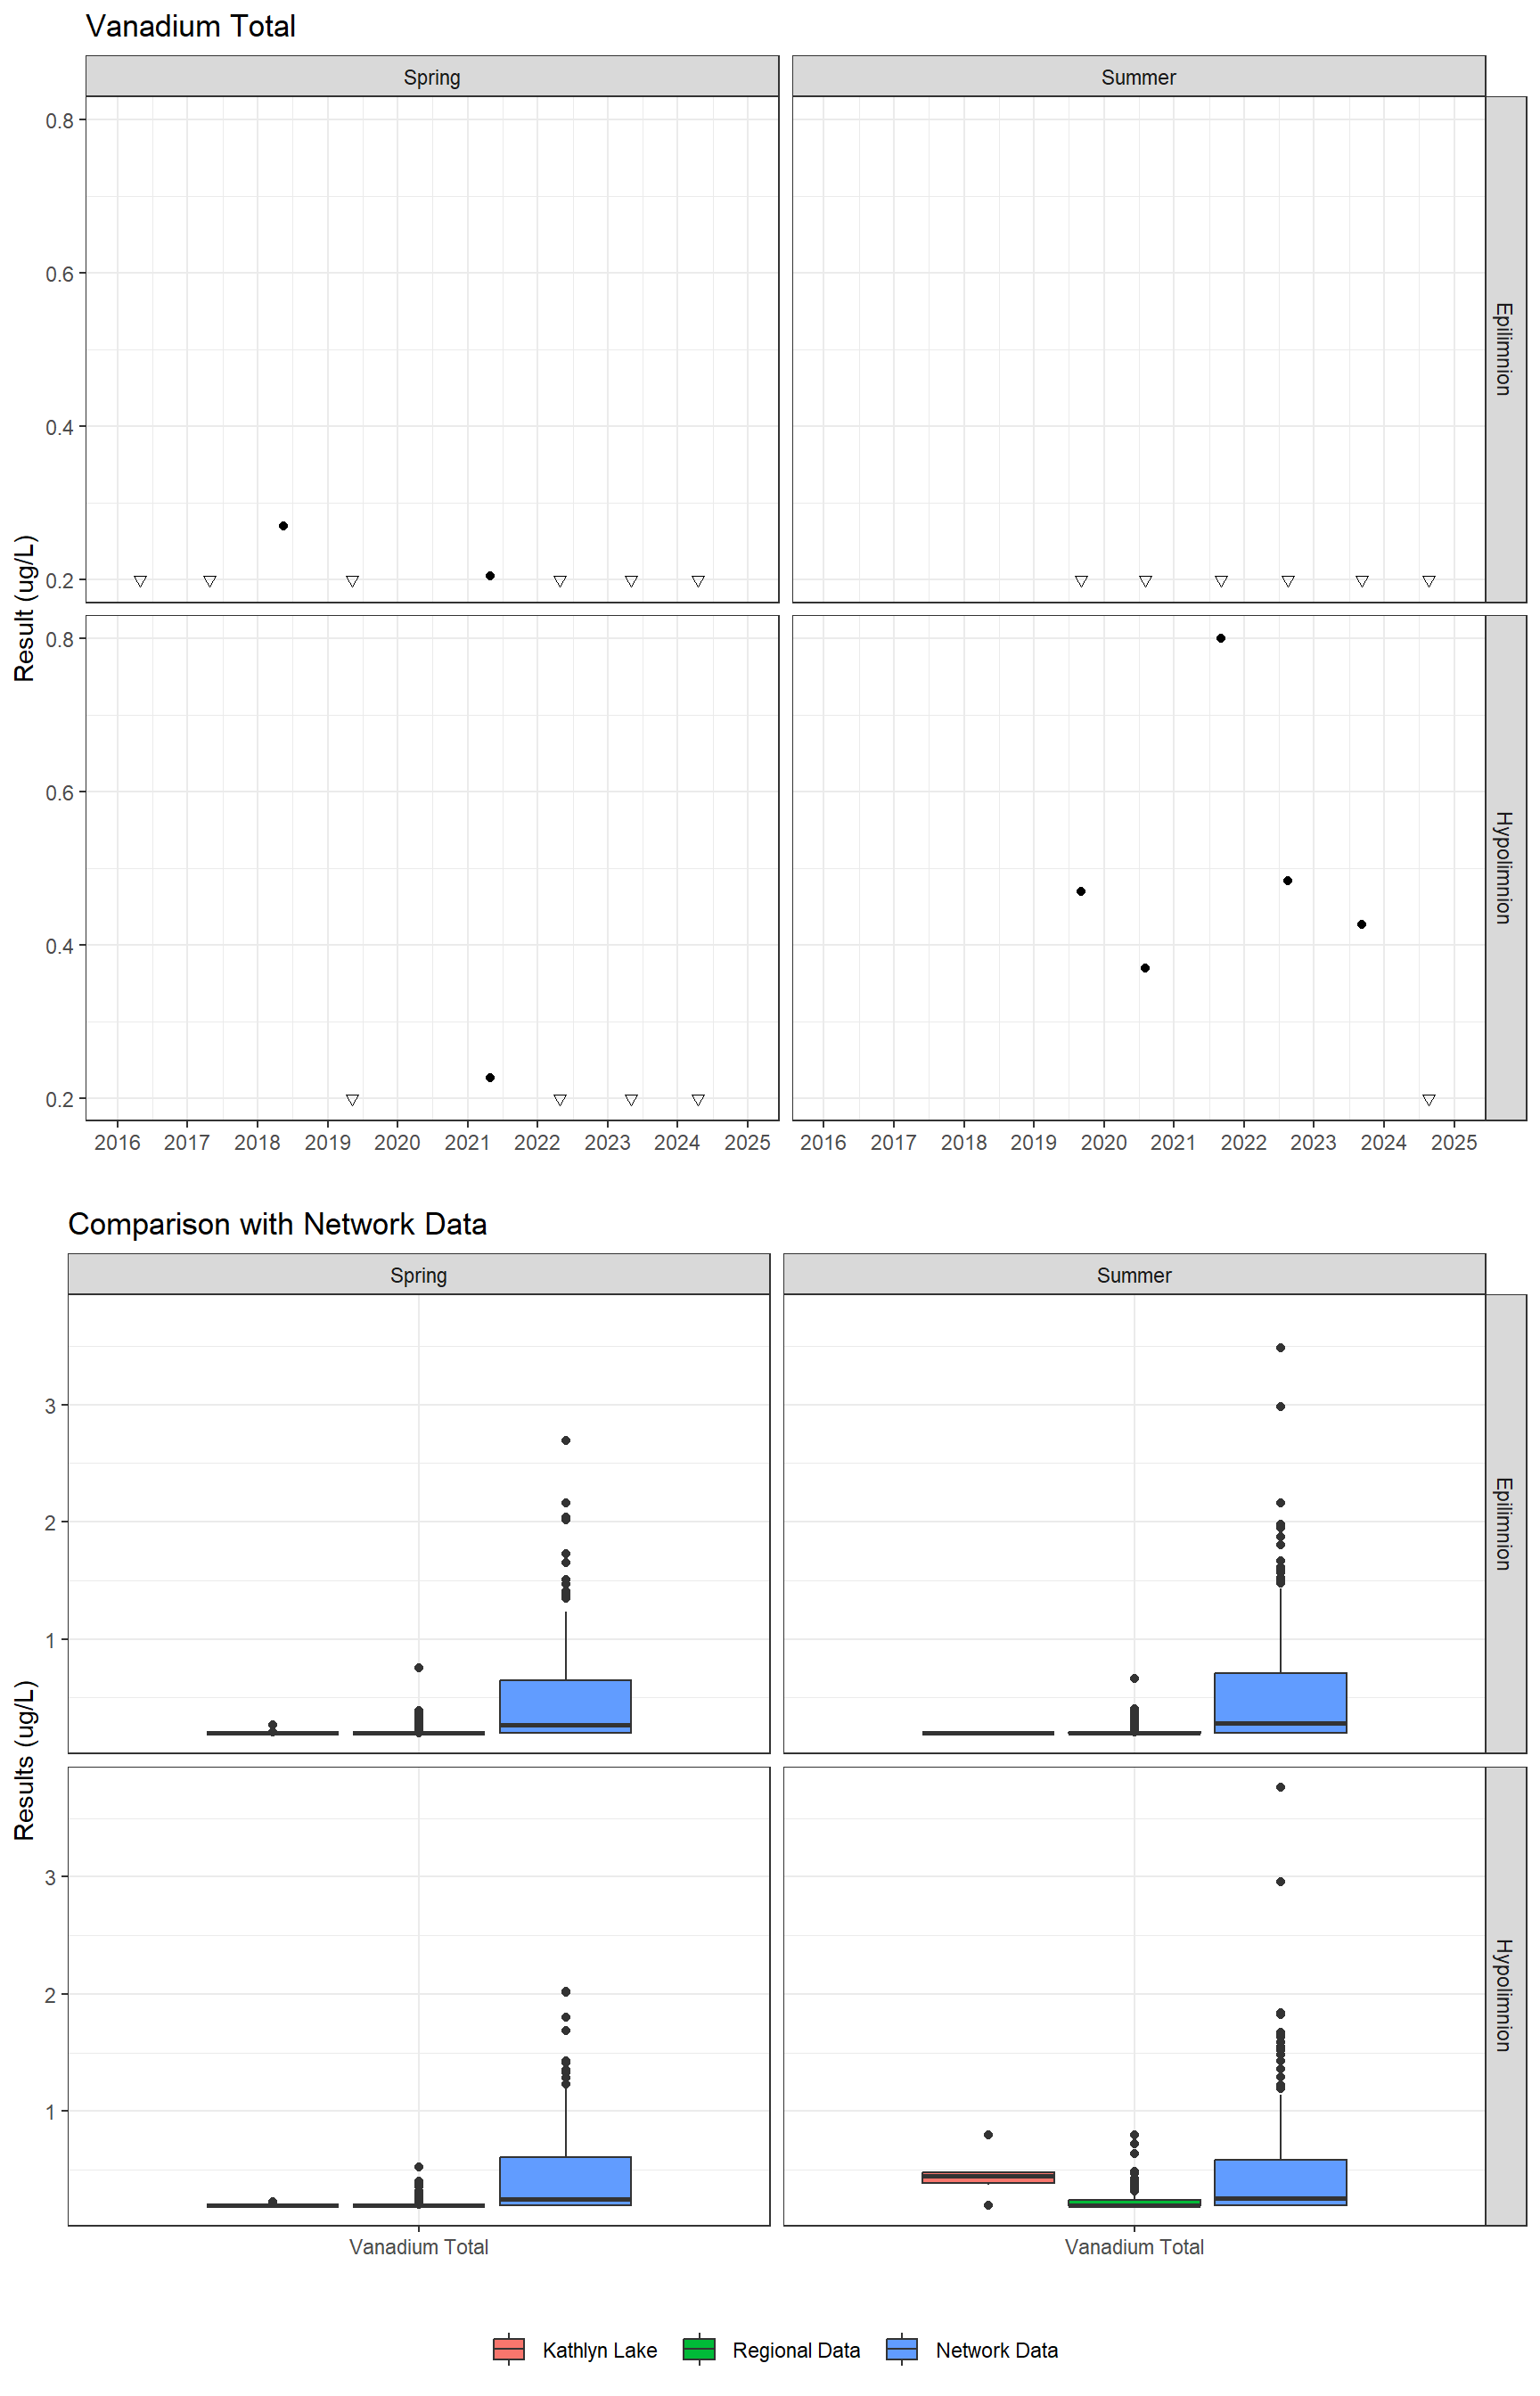
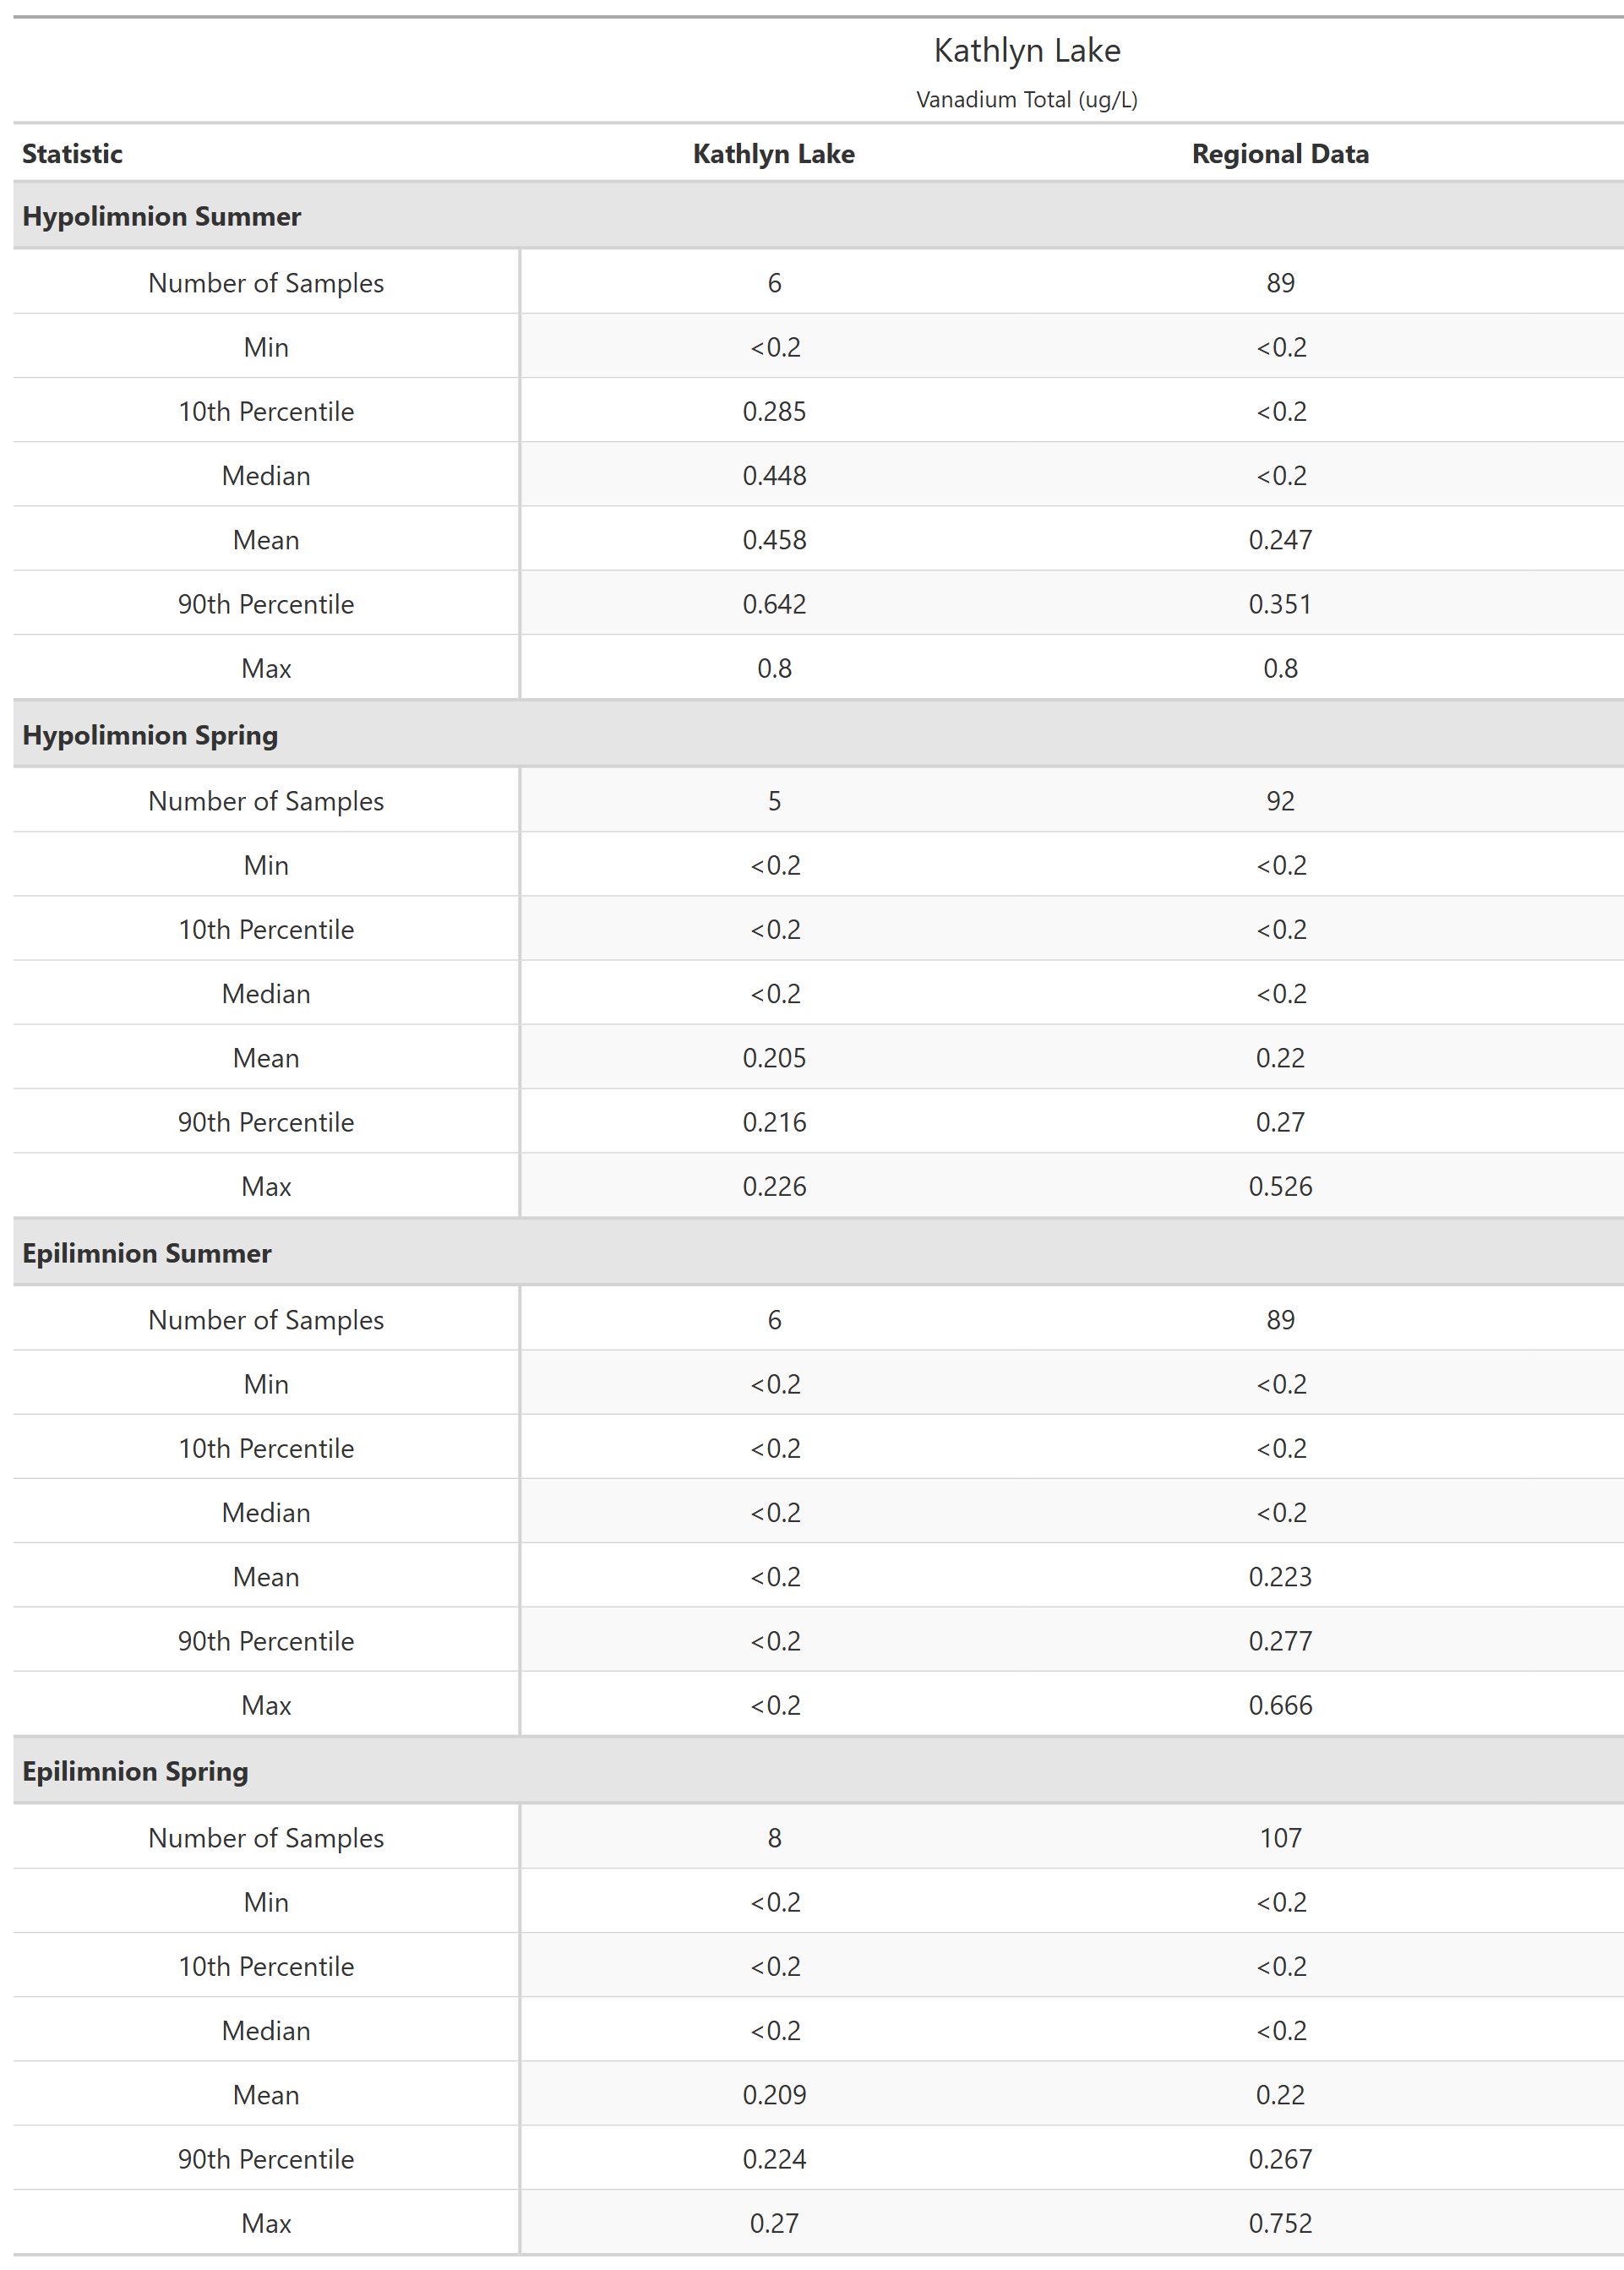
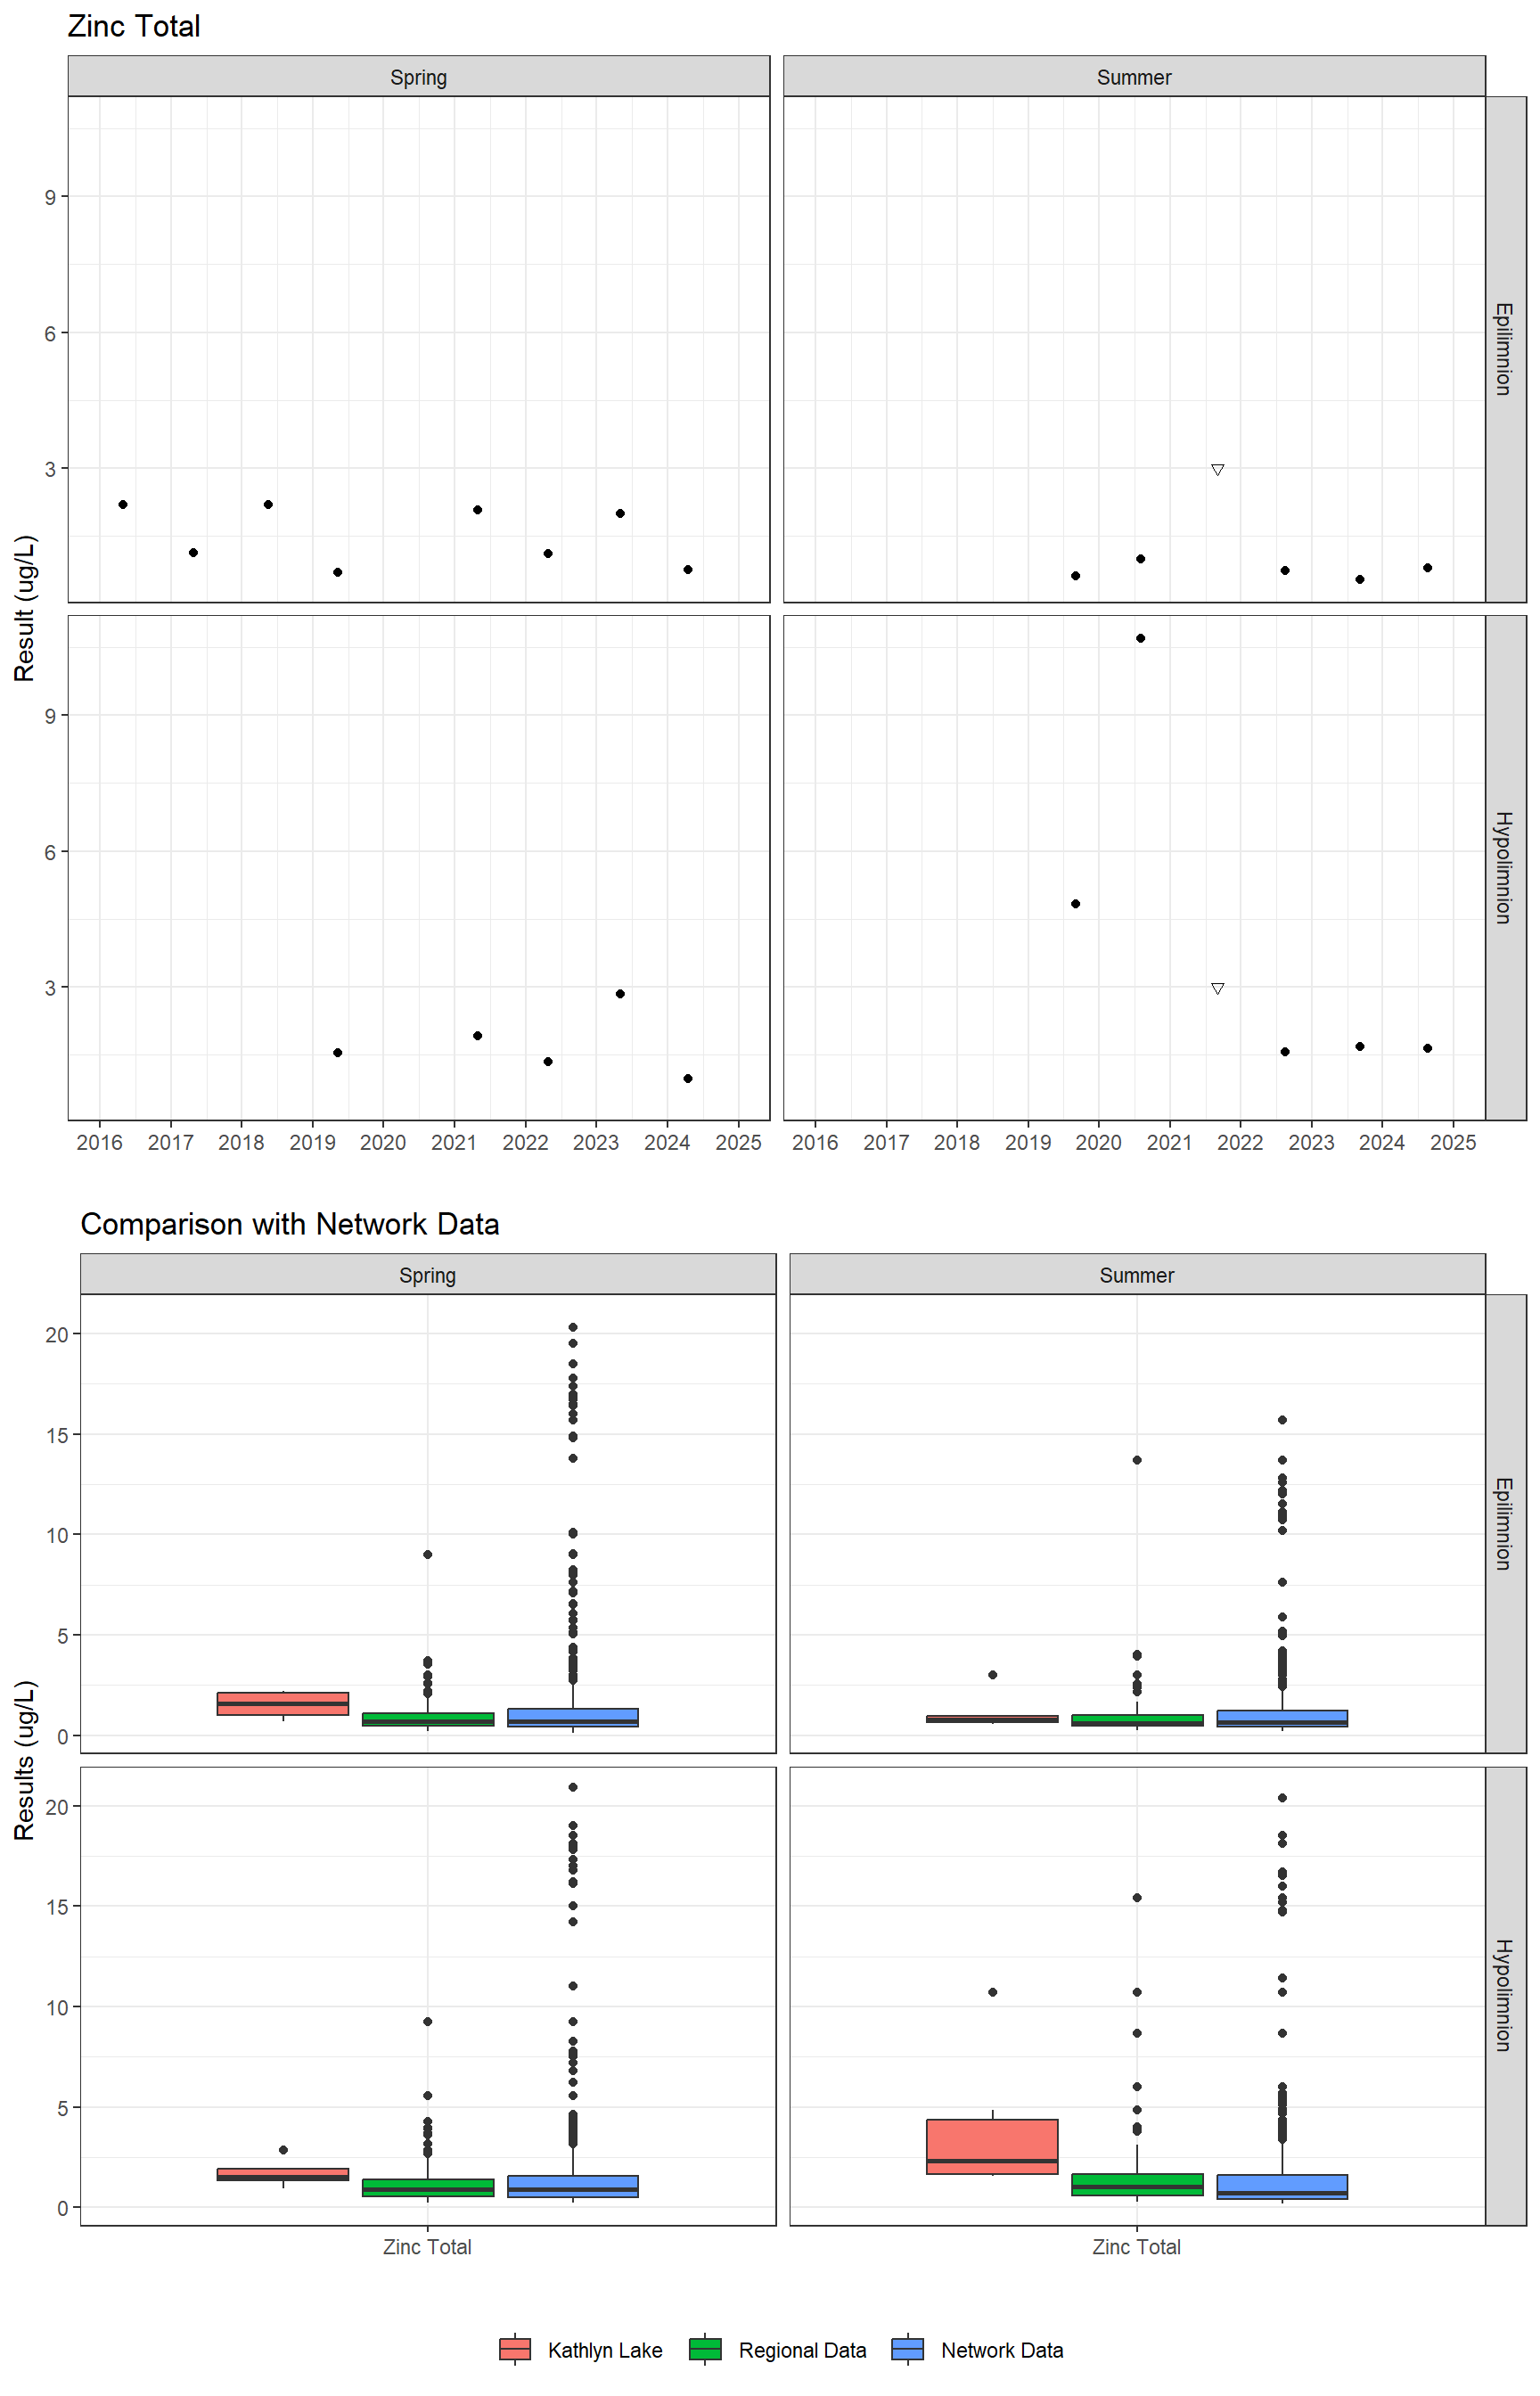
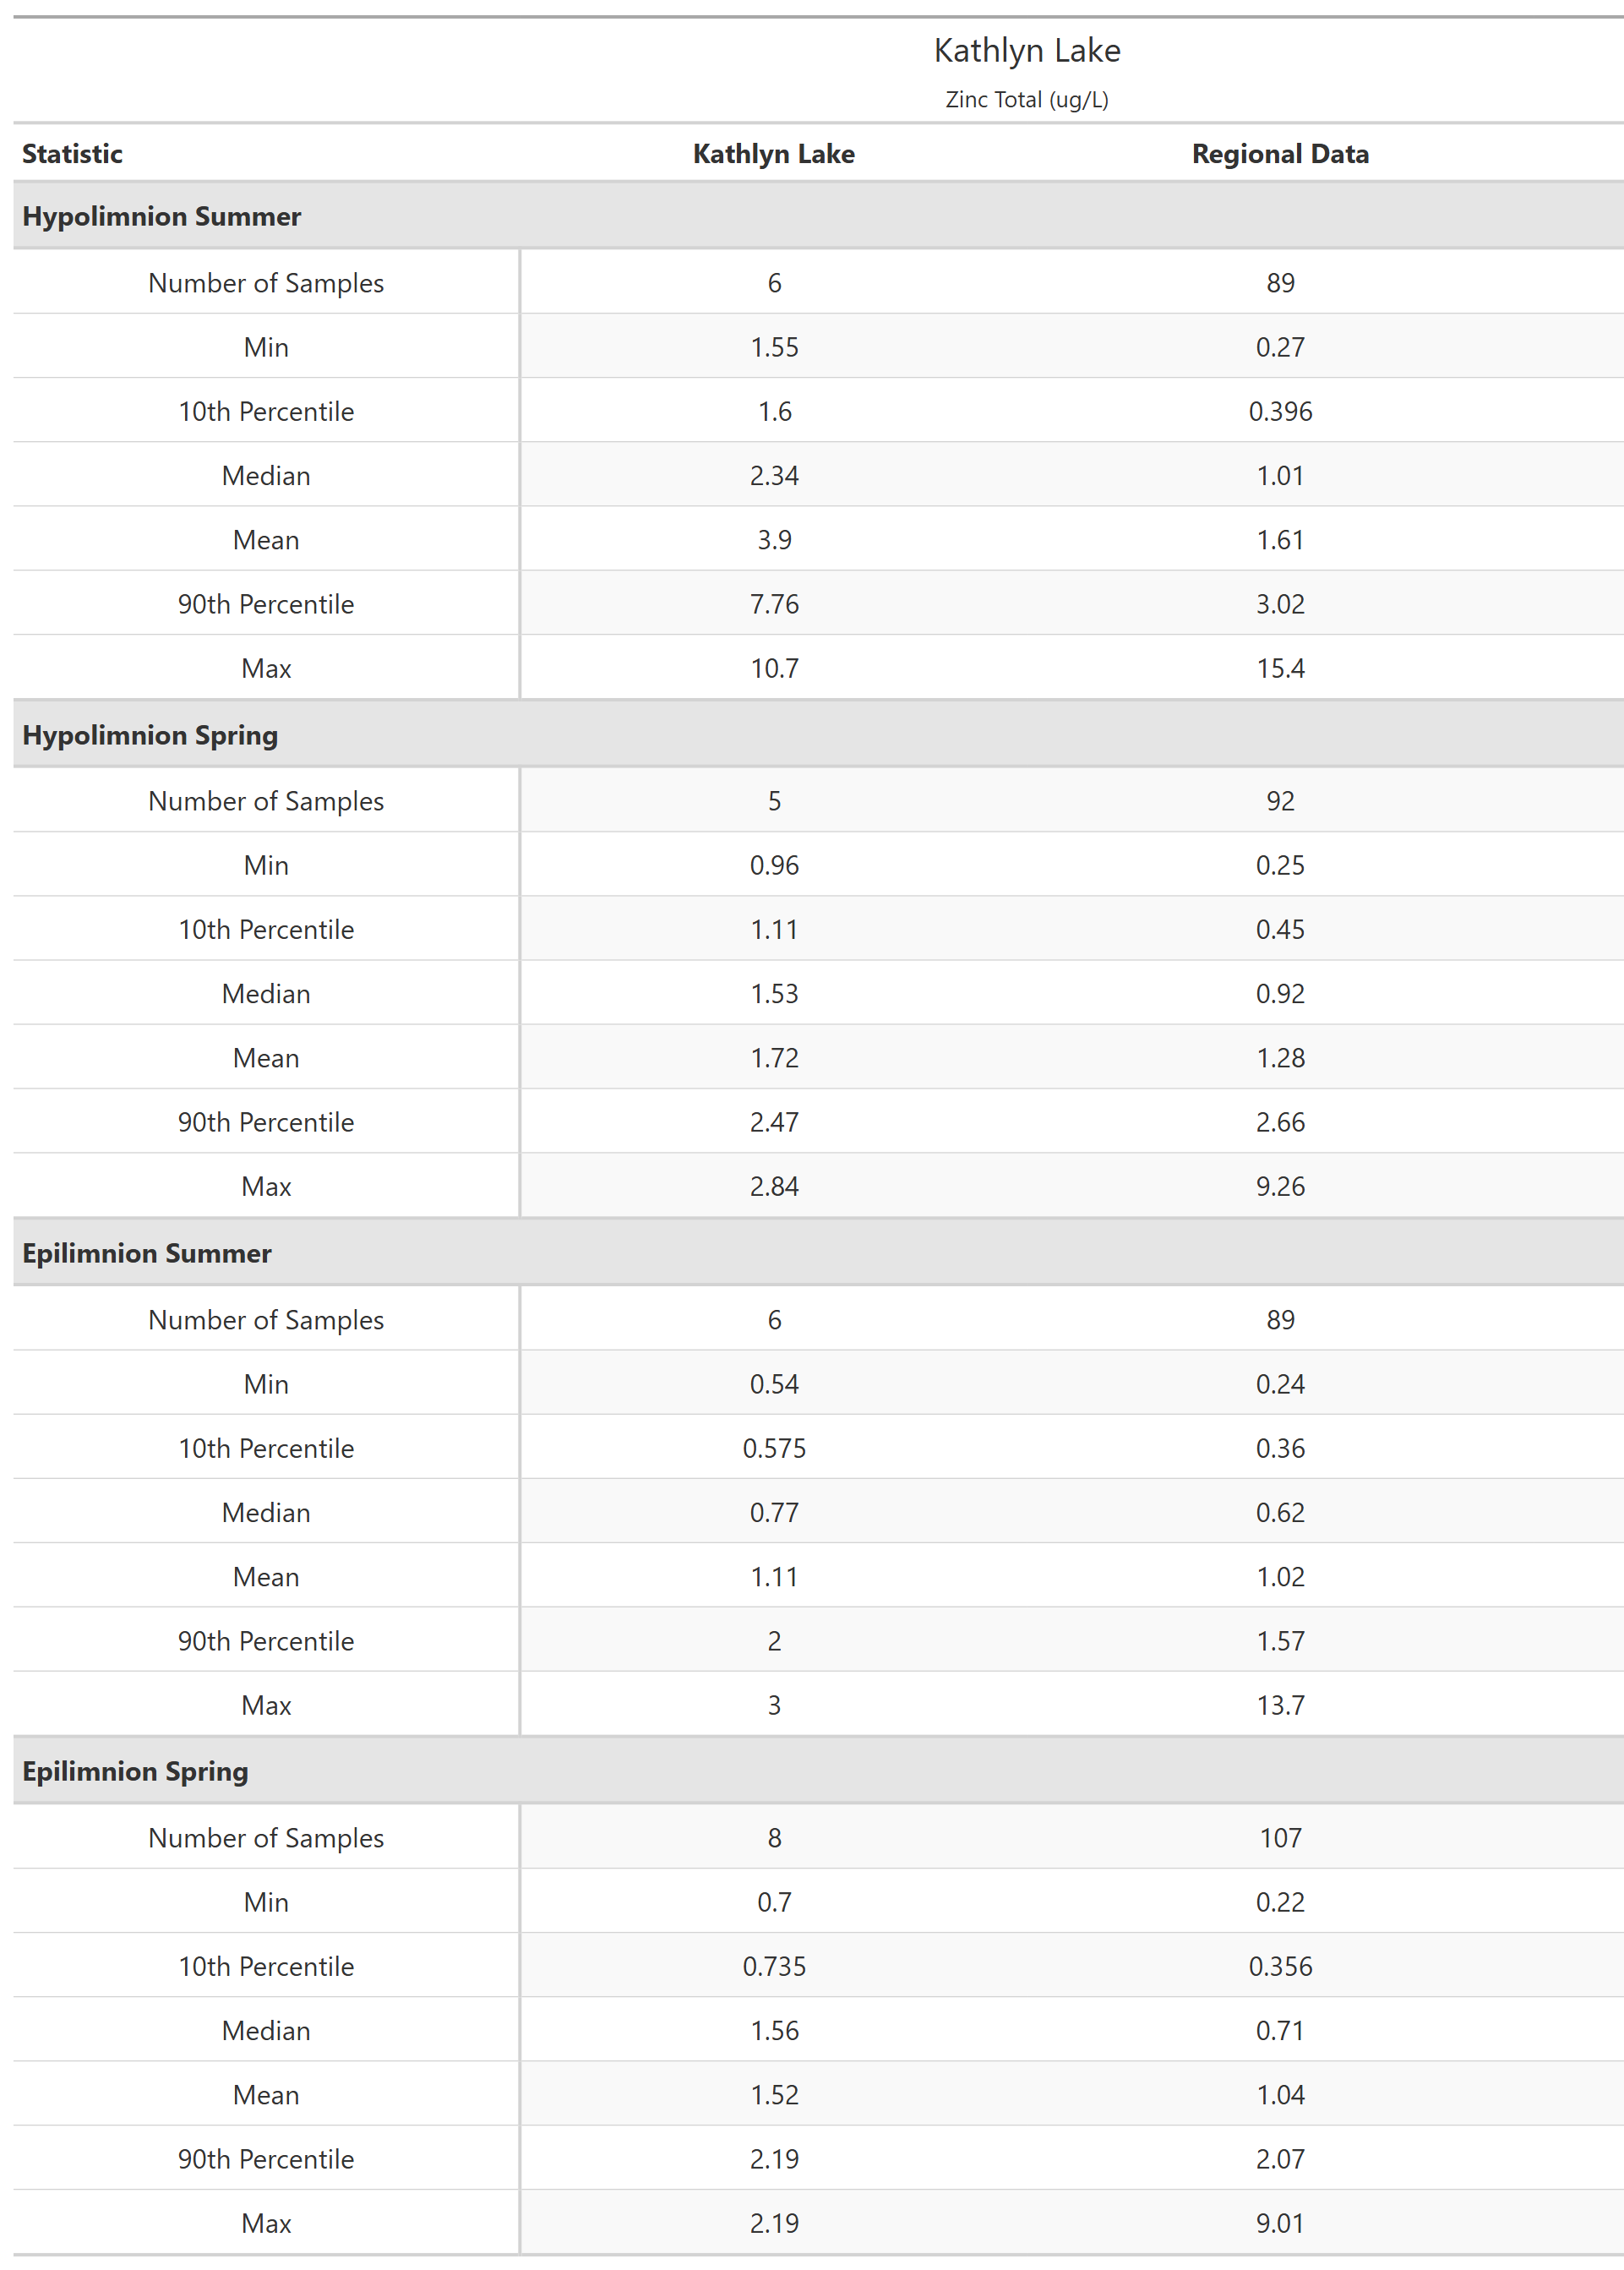
Kathlyn Lake
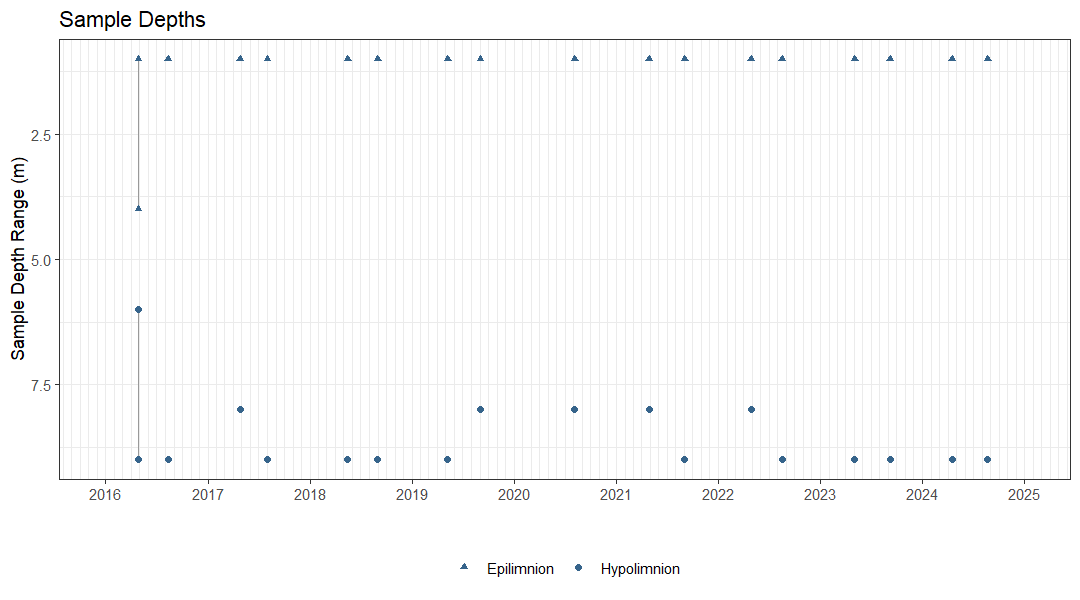
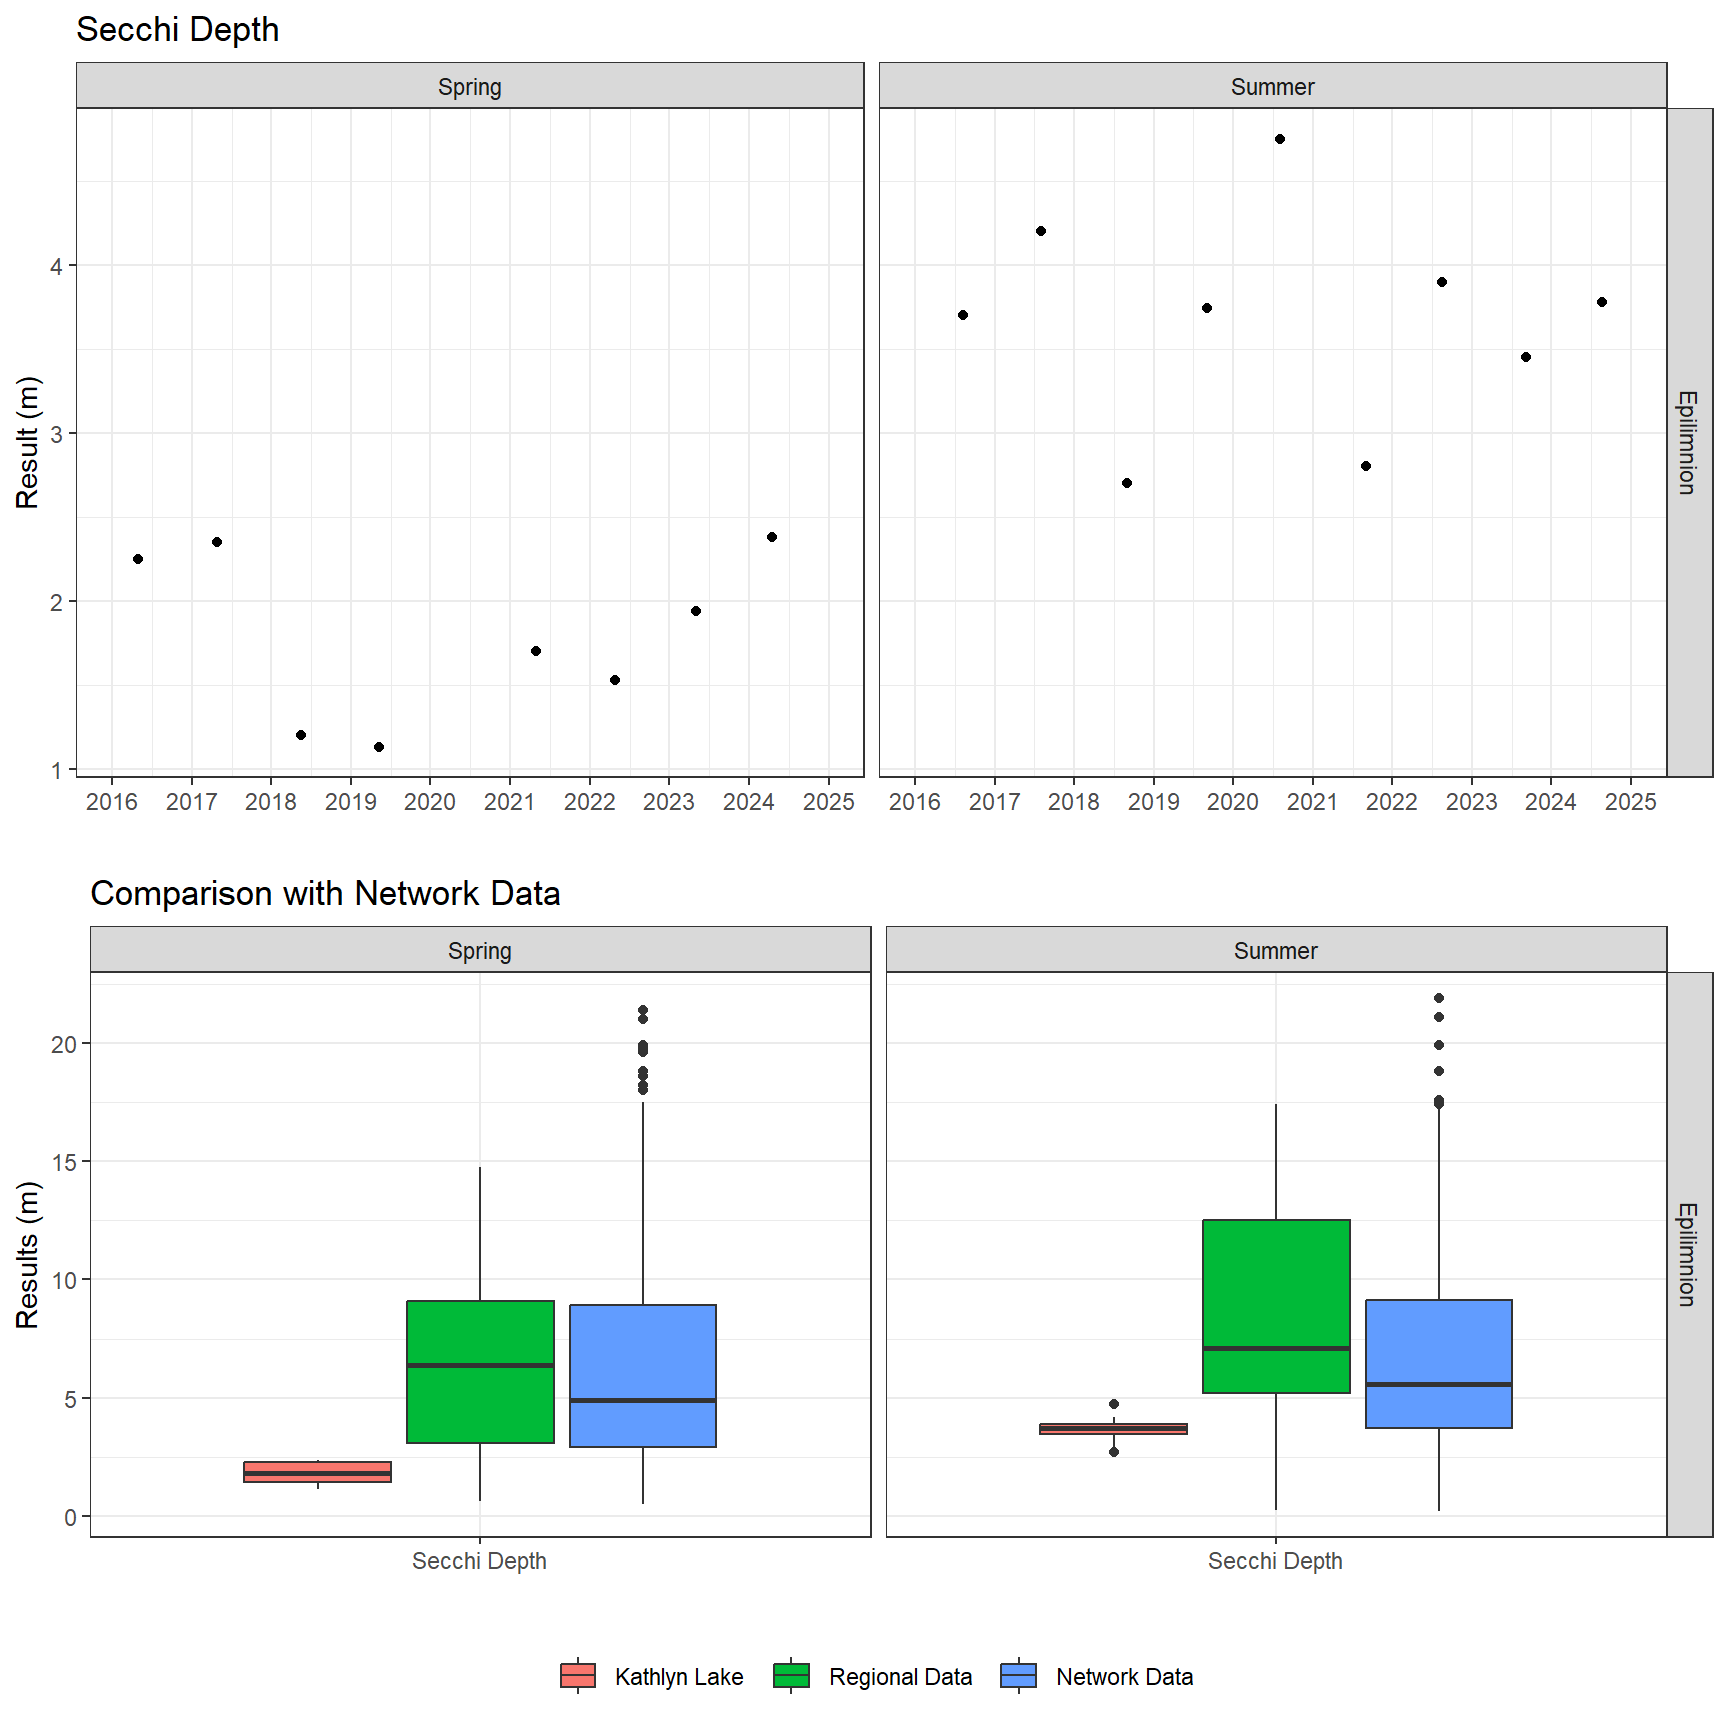
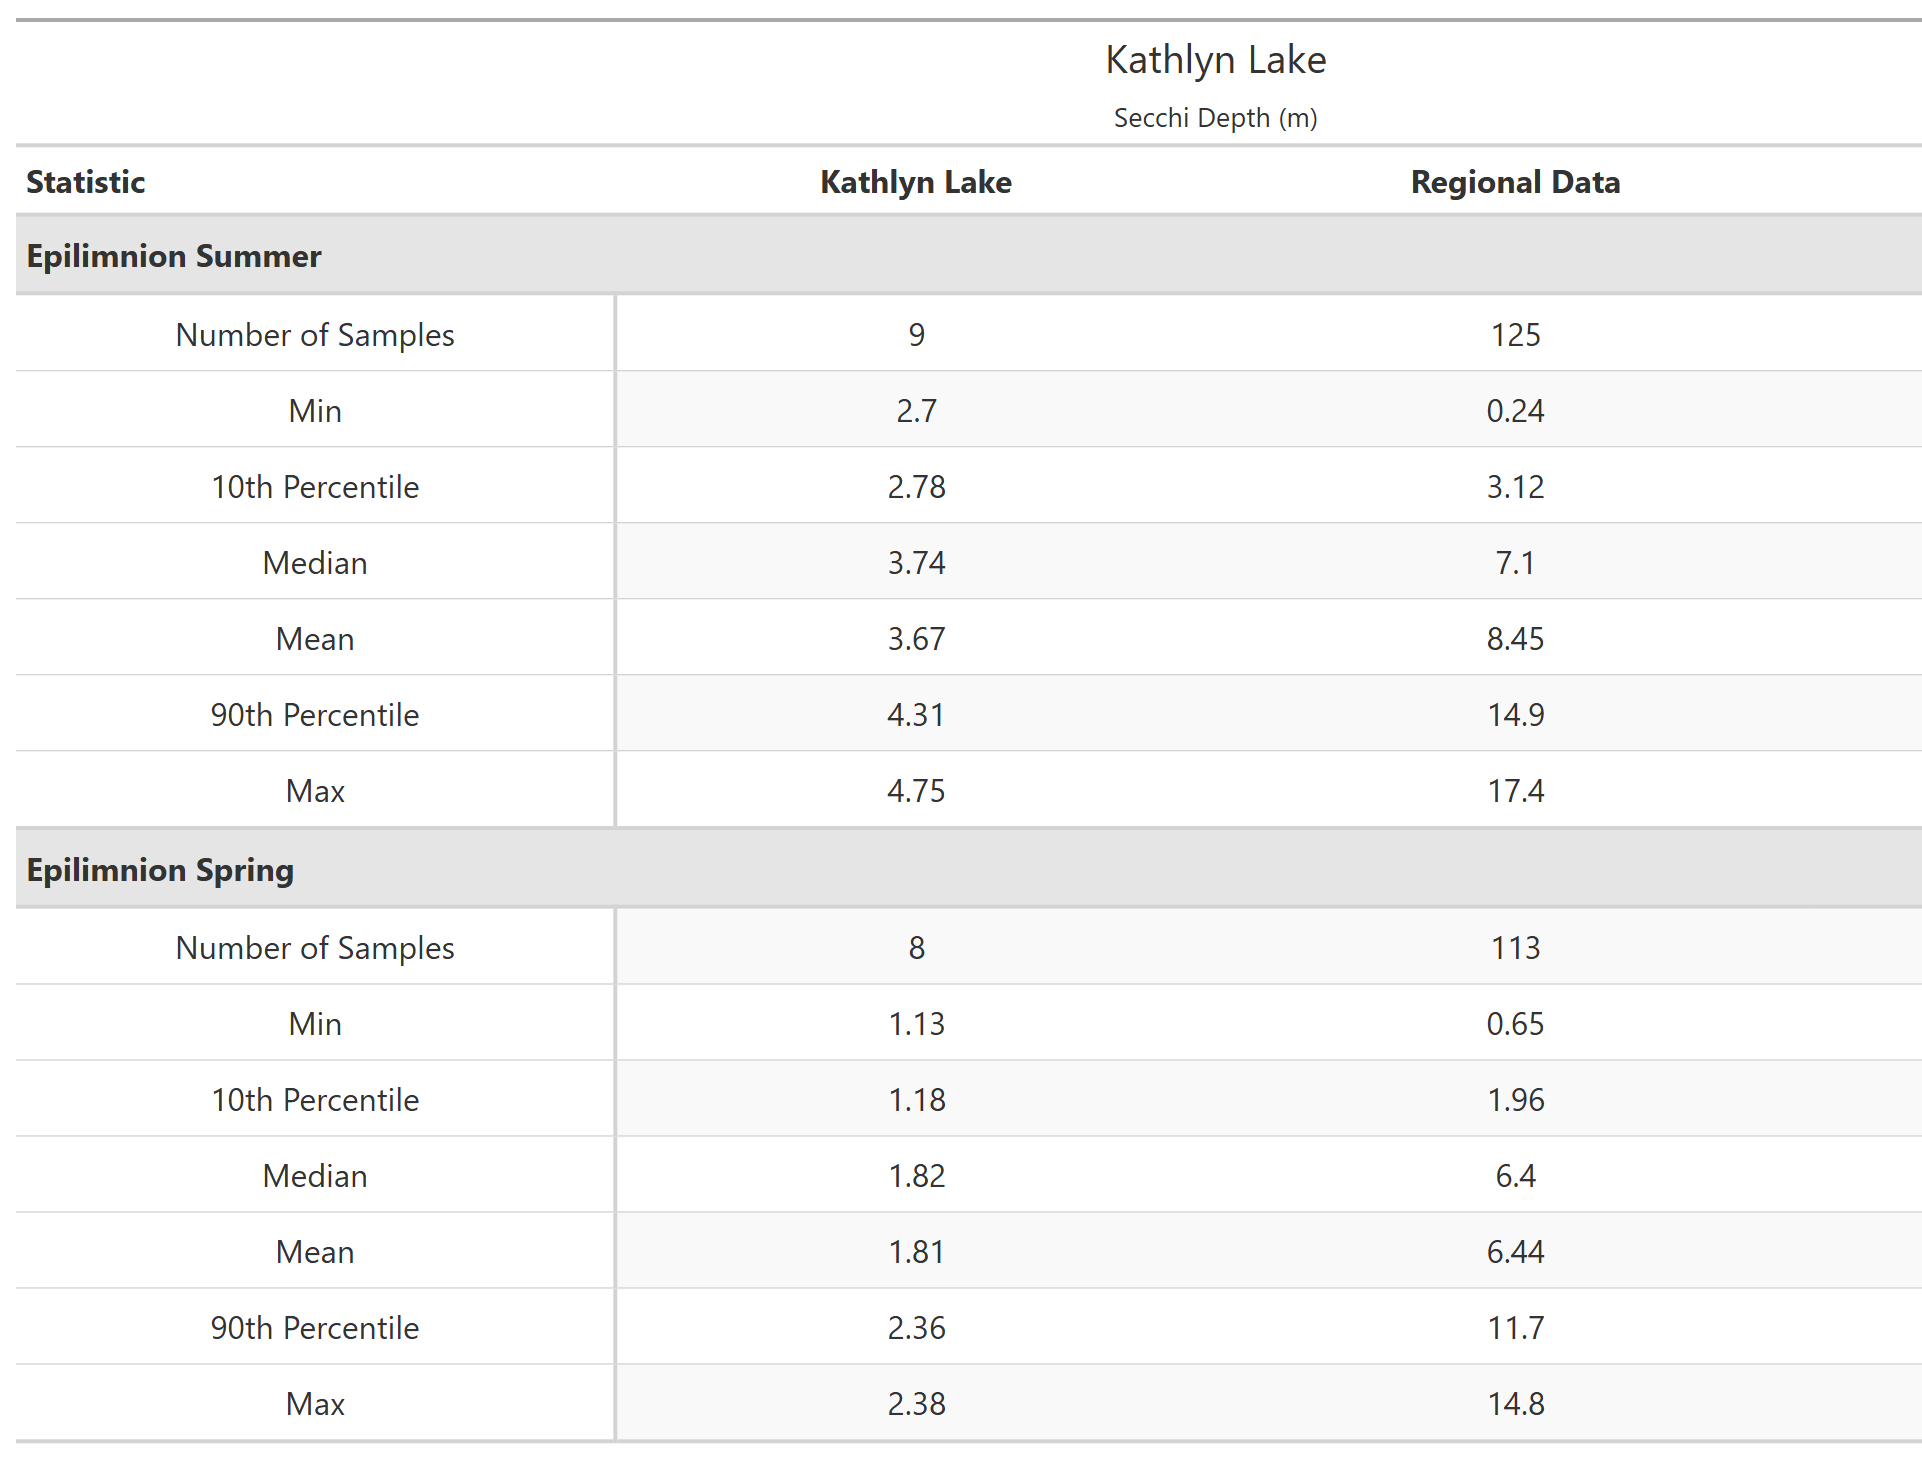
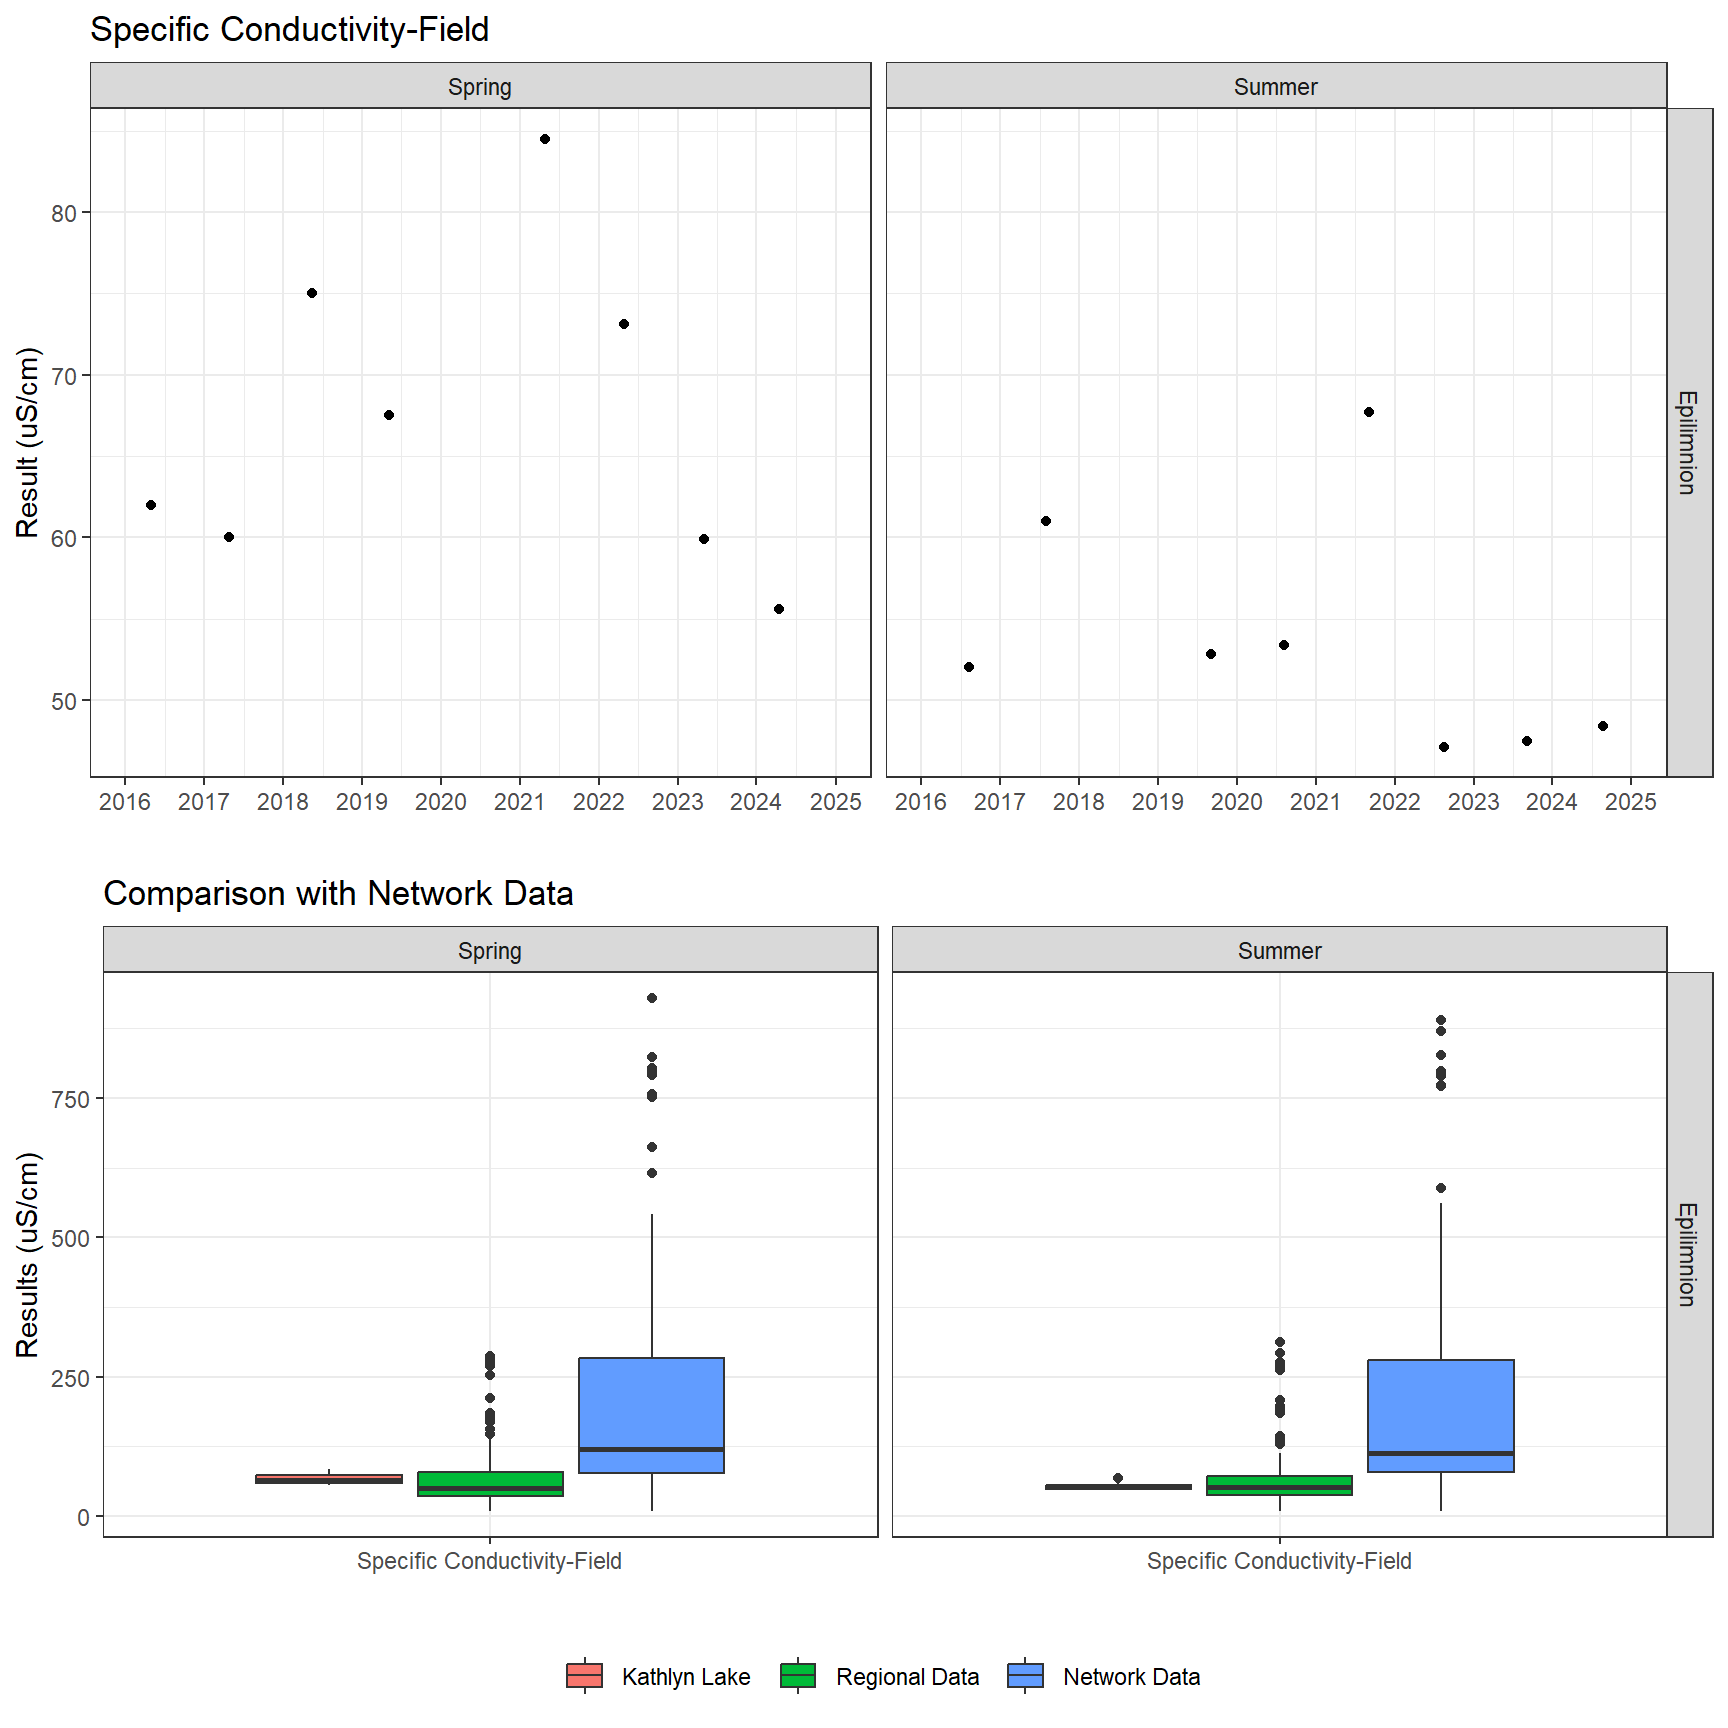
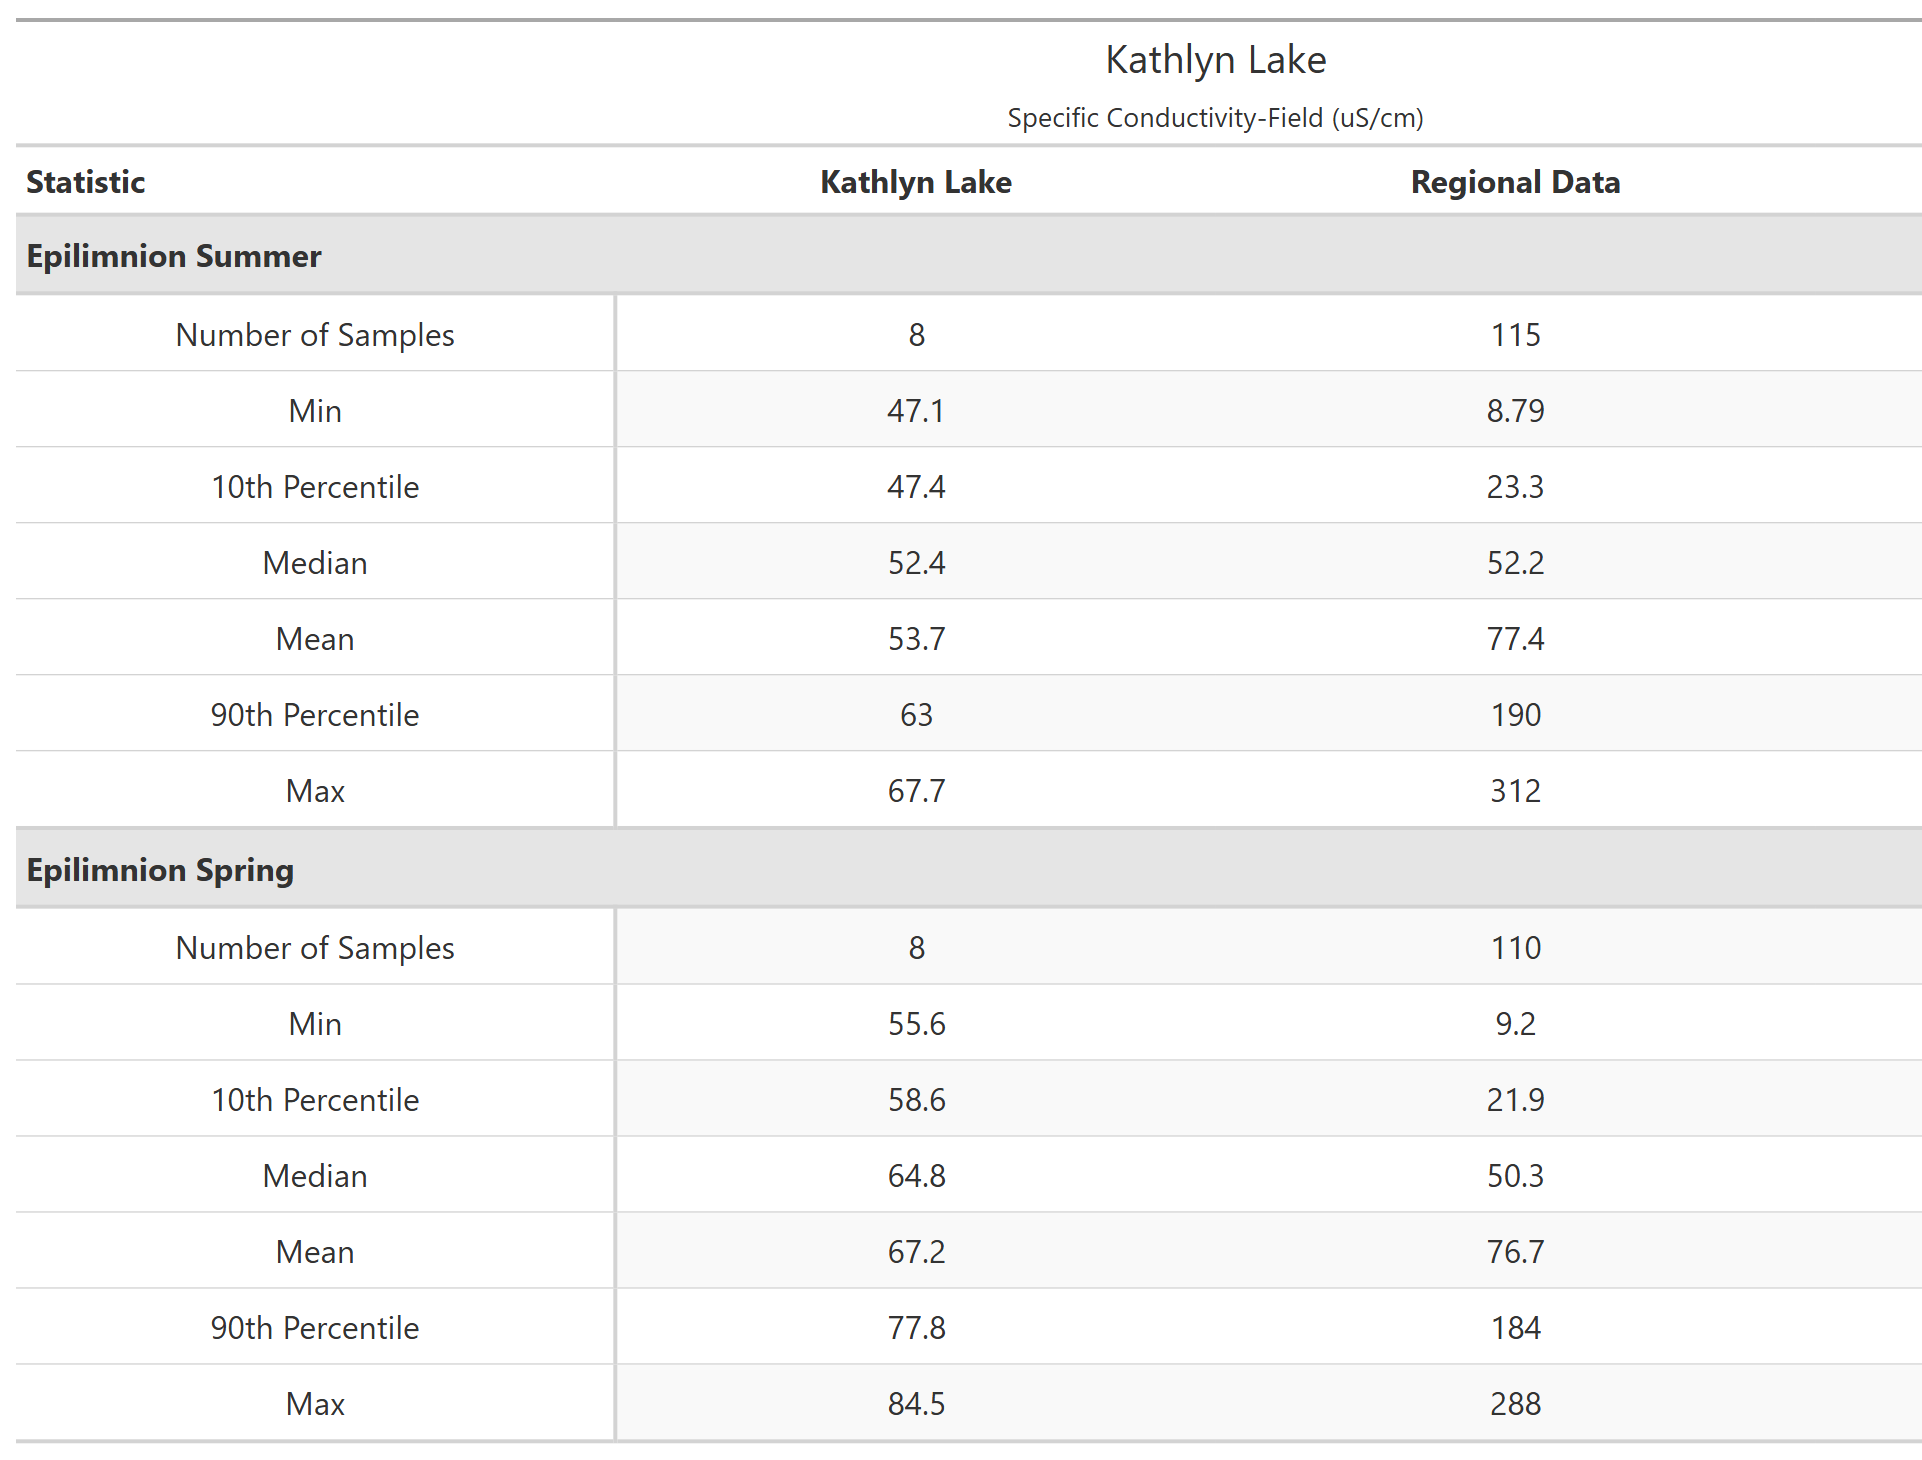
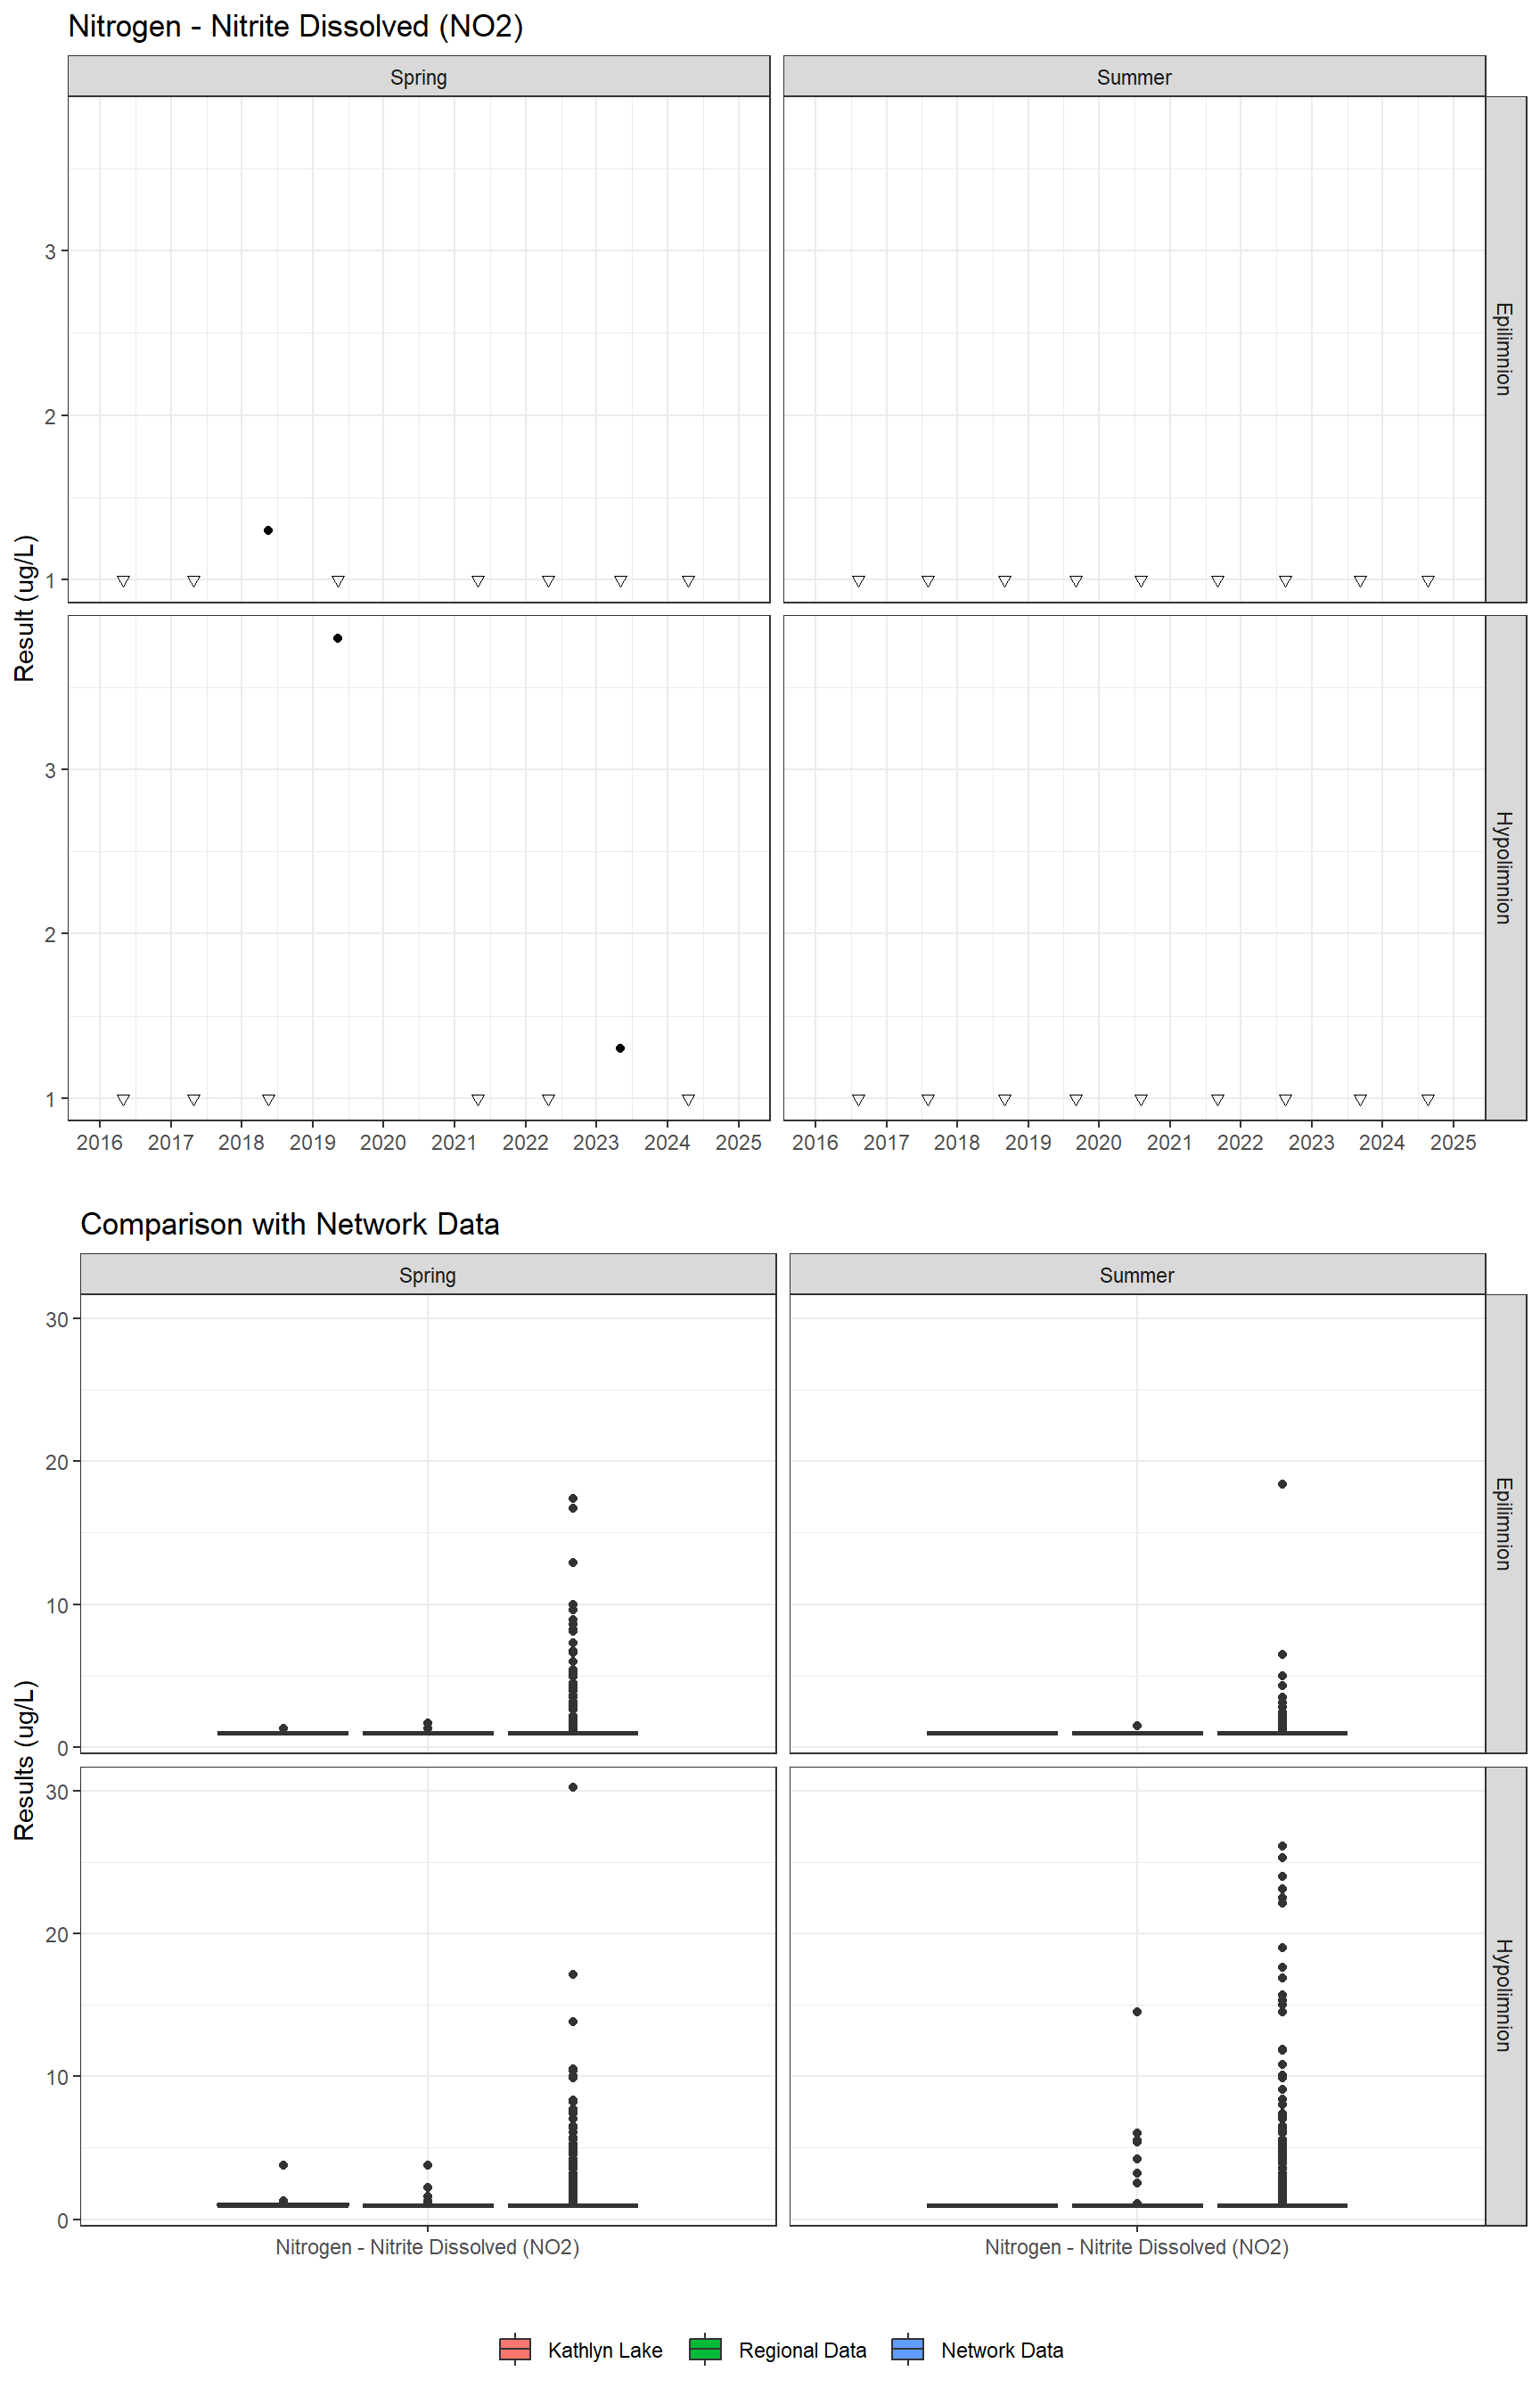
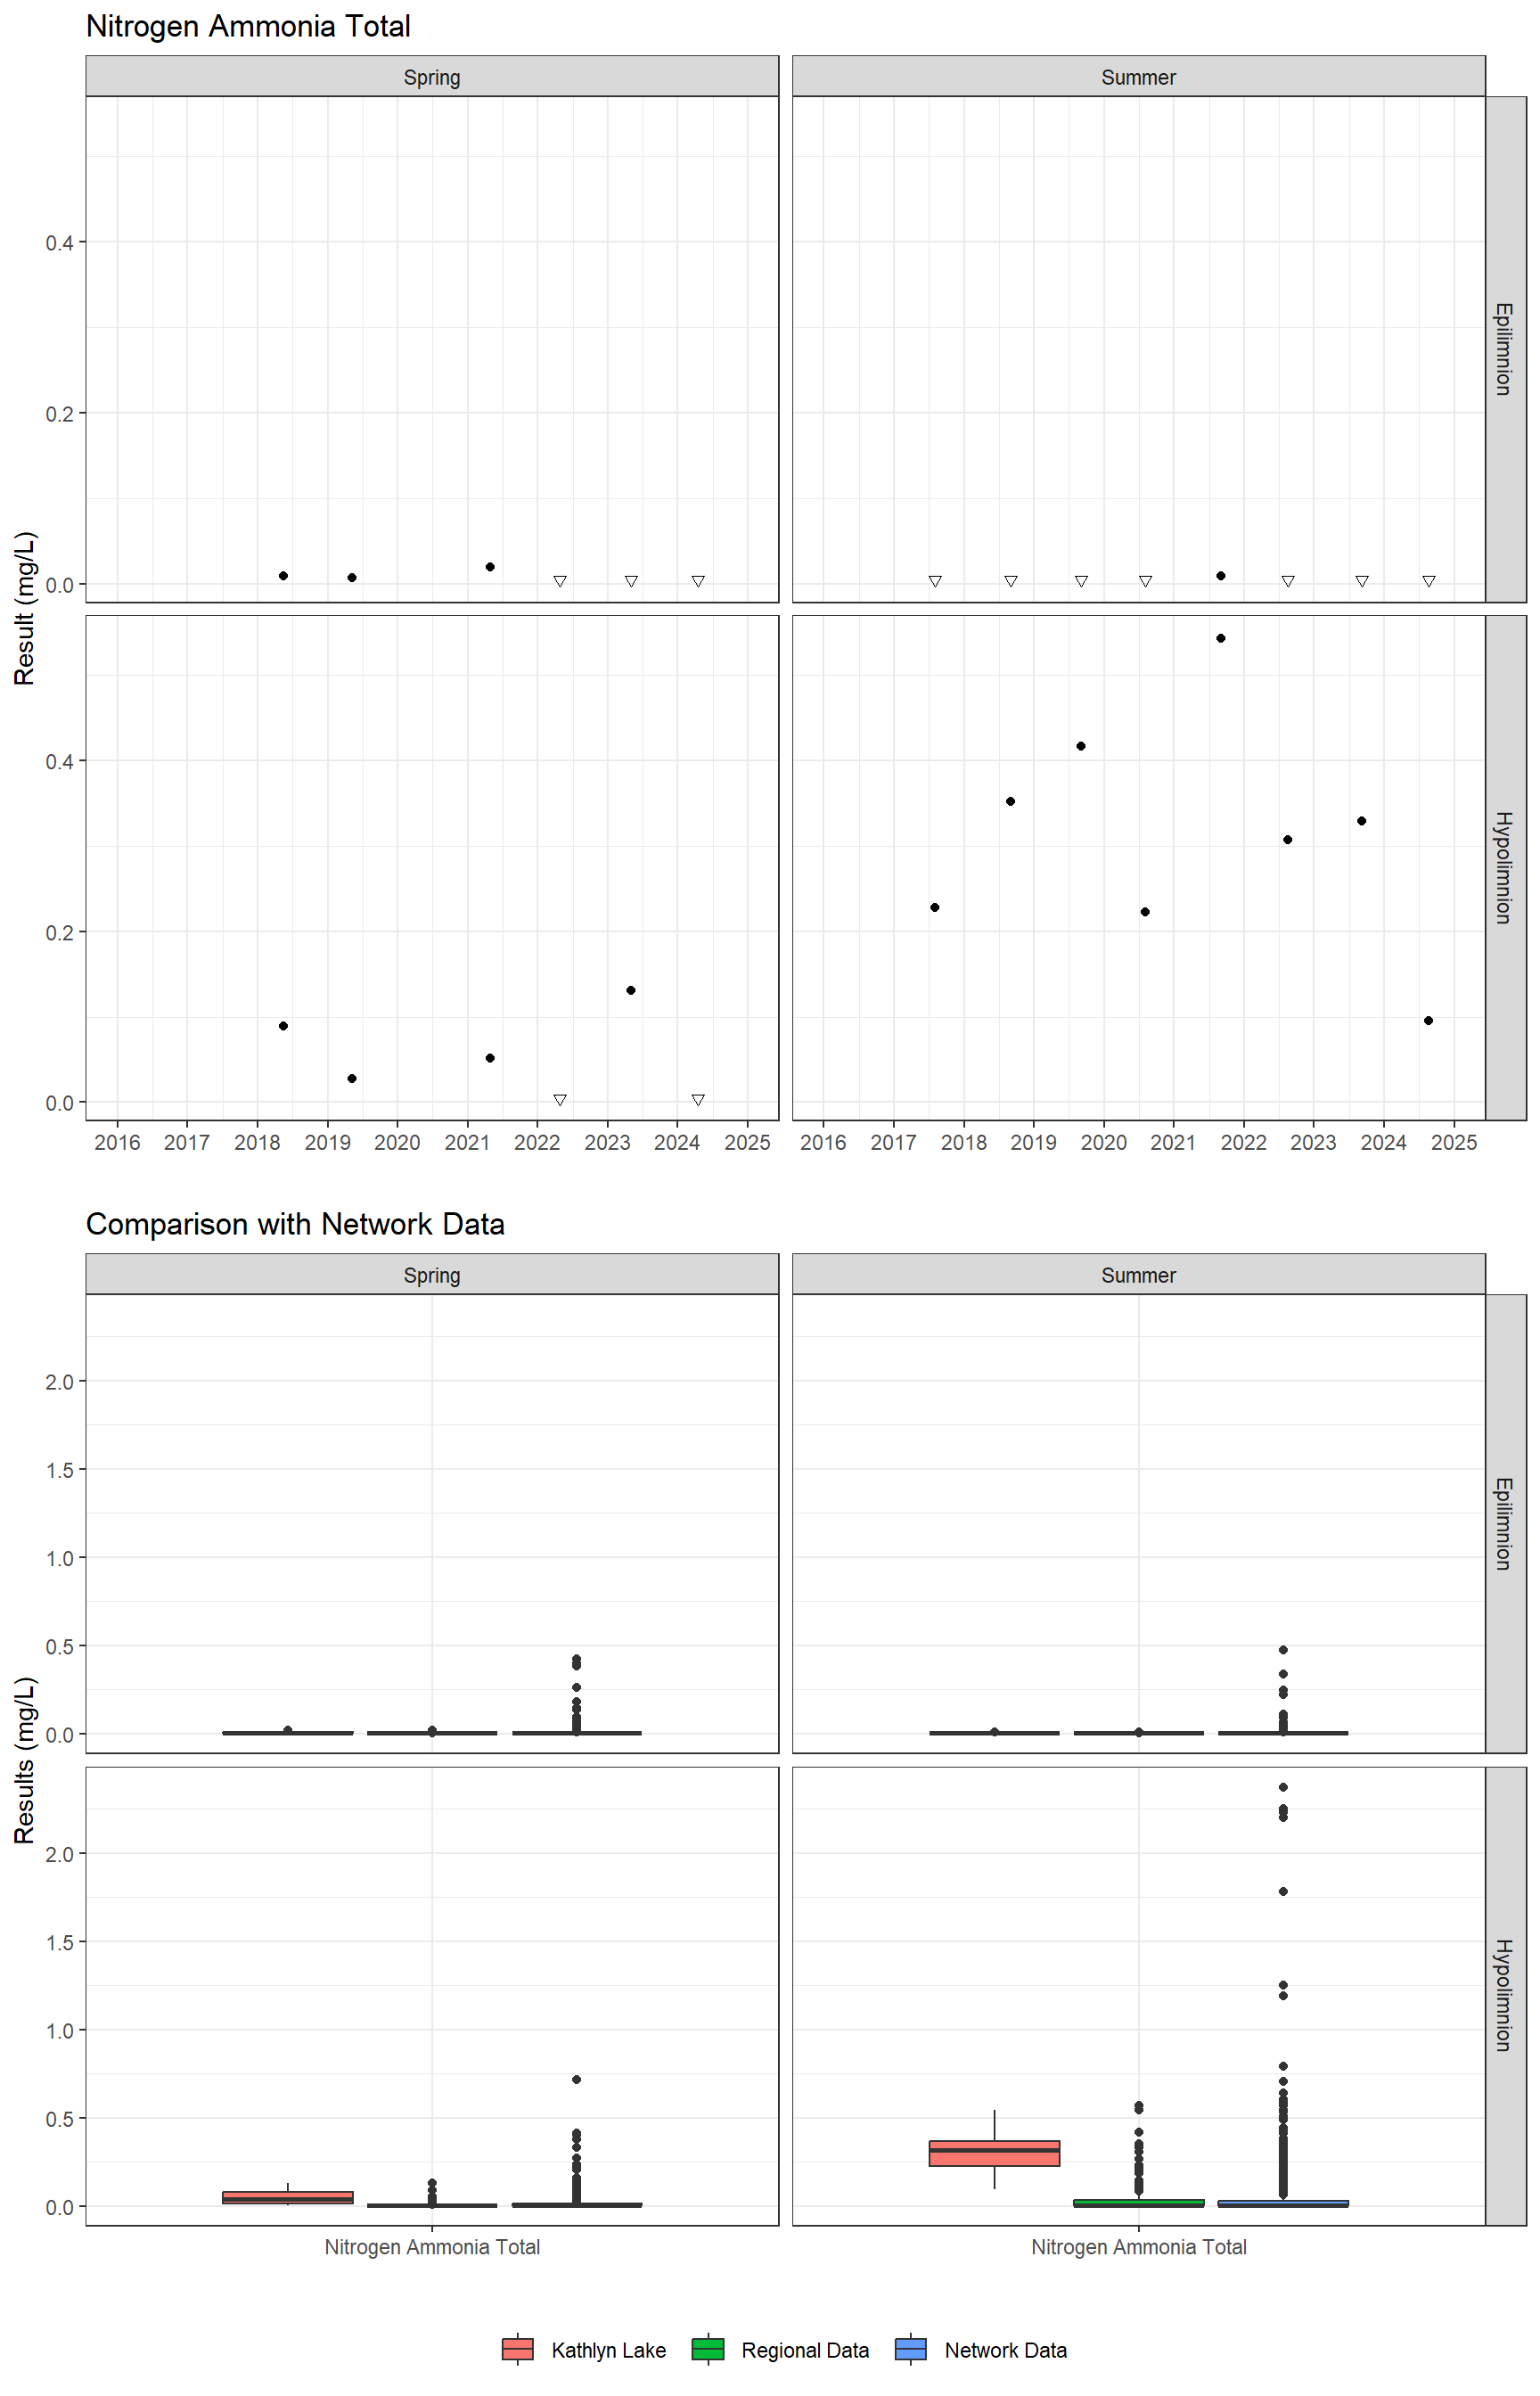
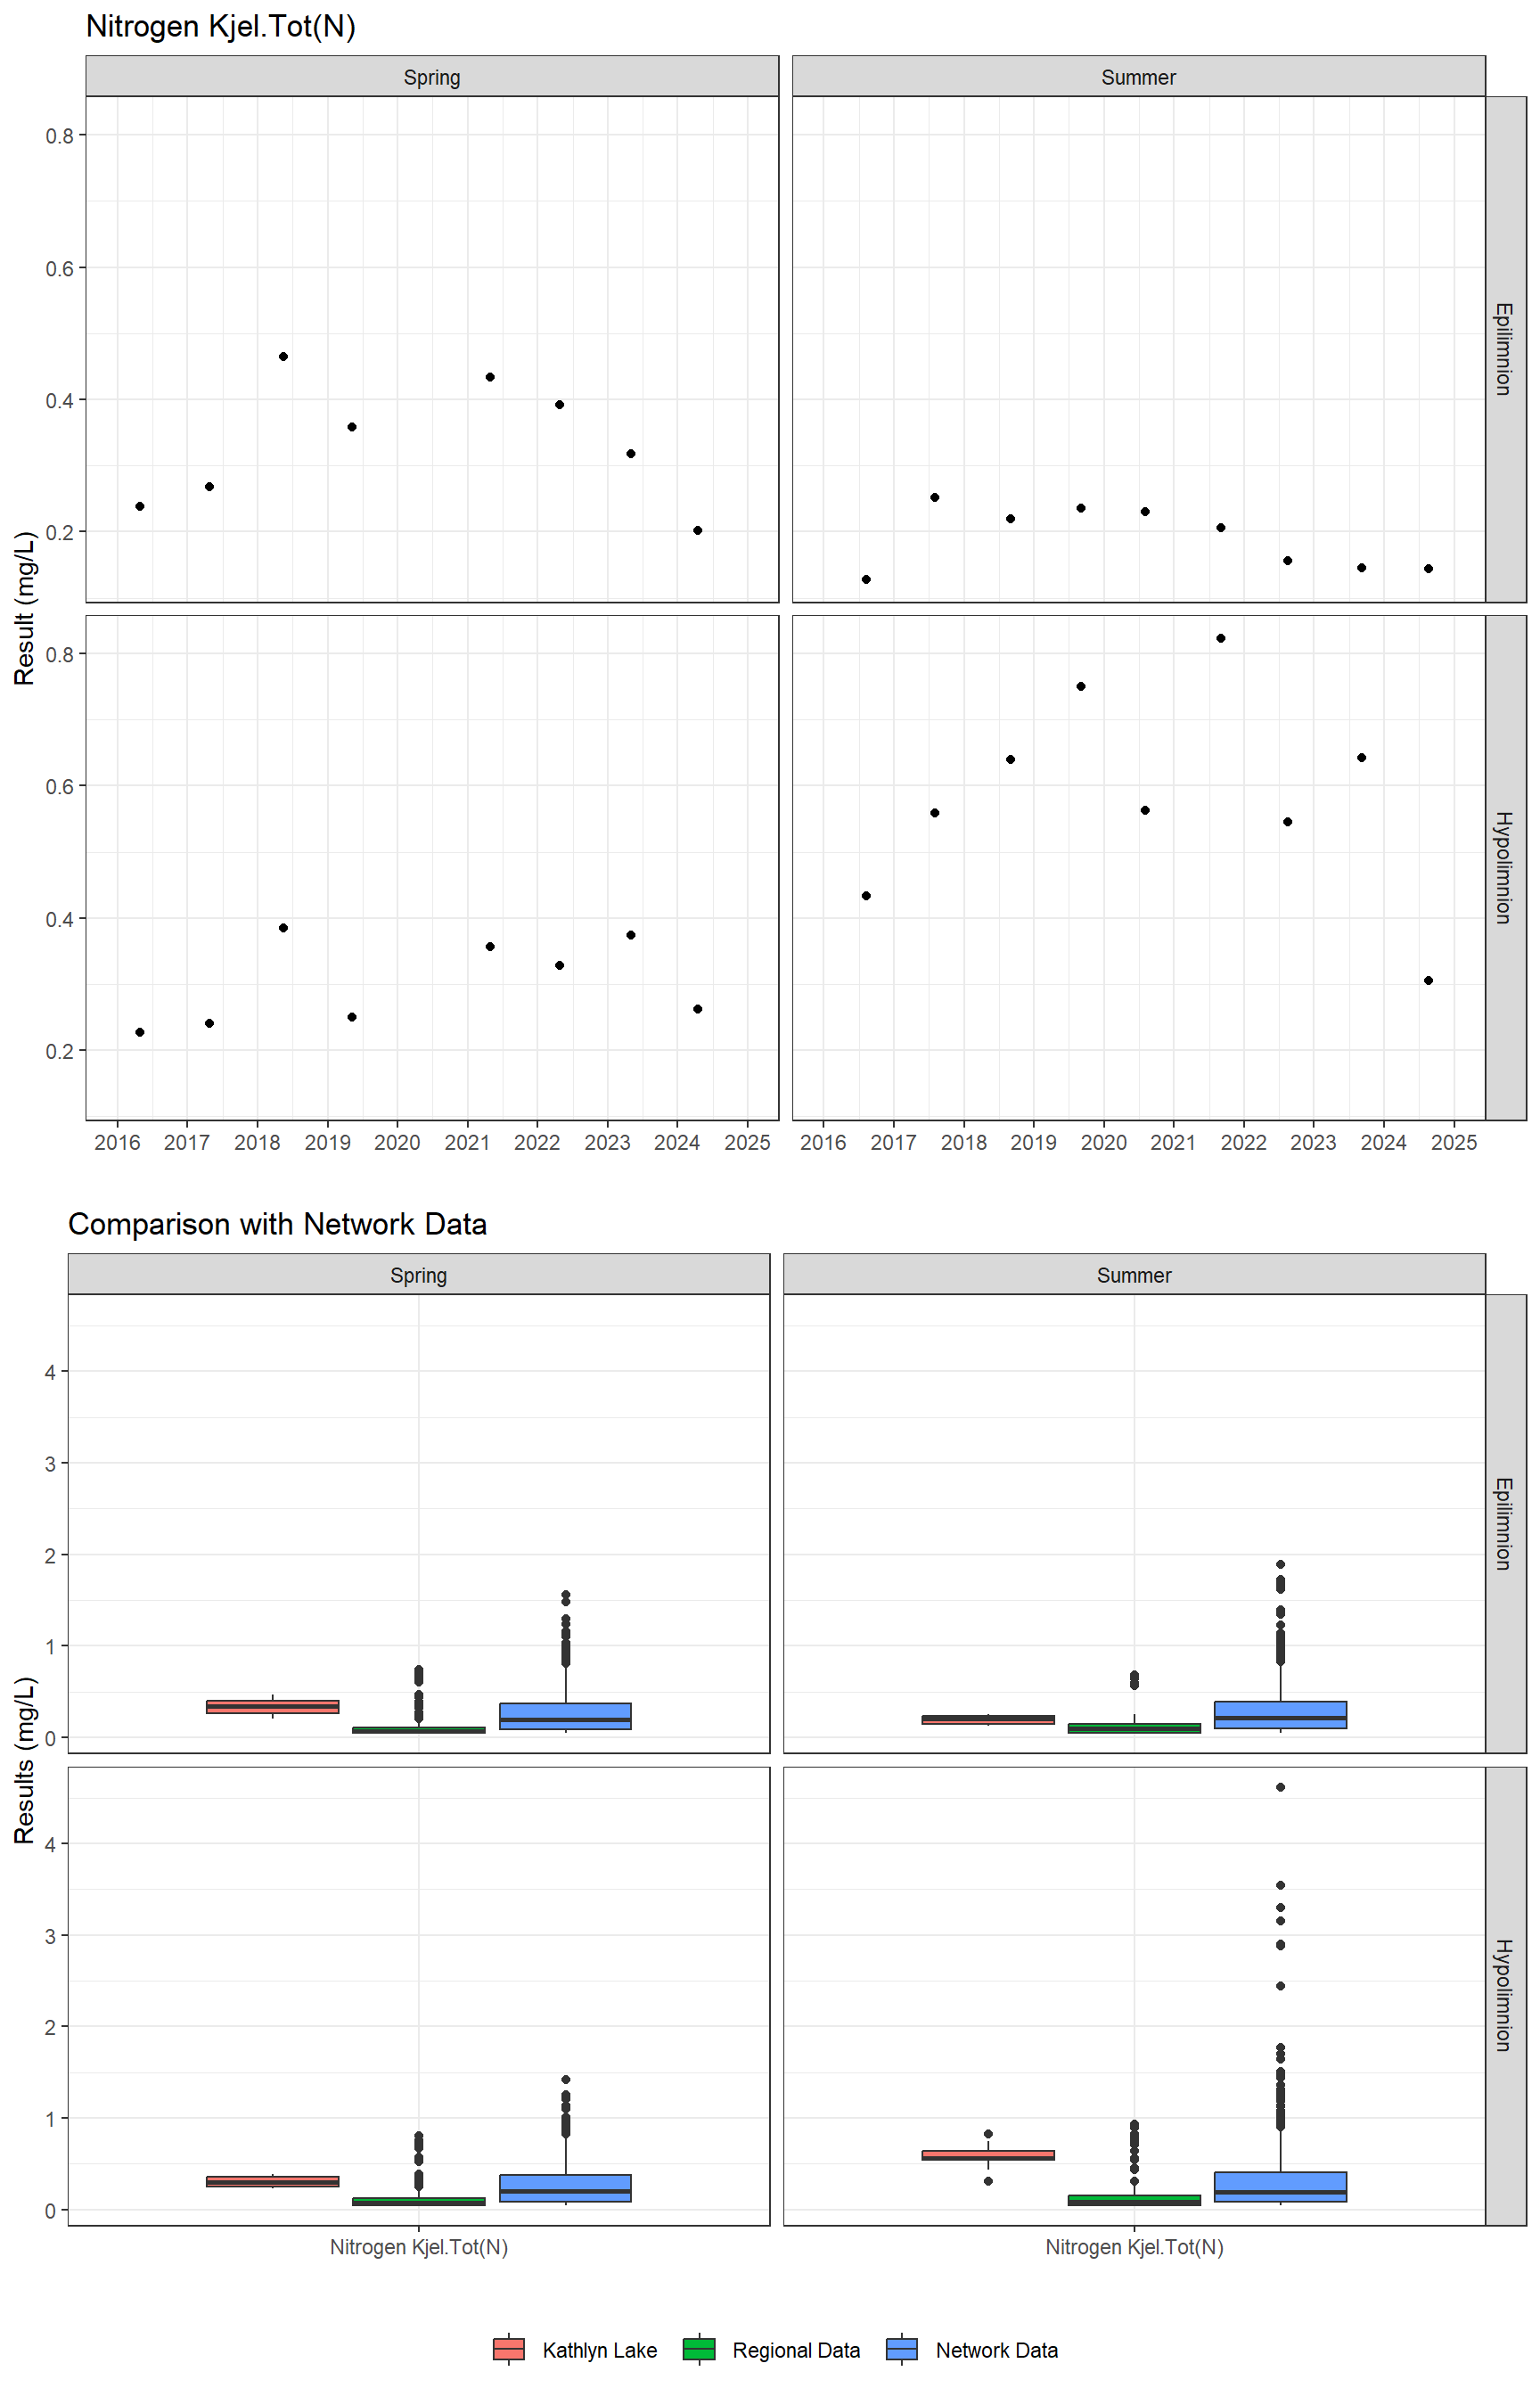
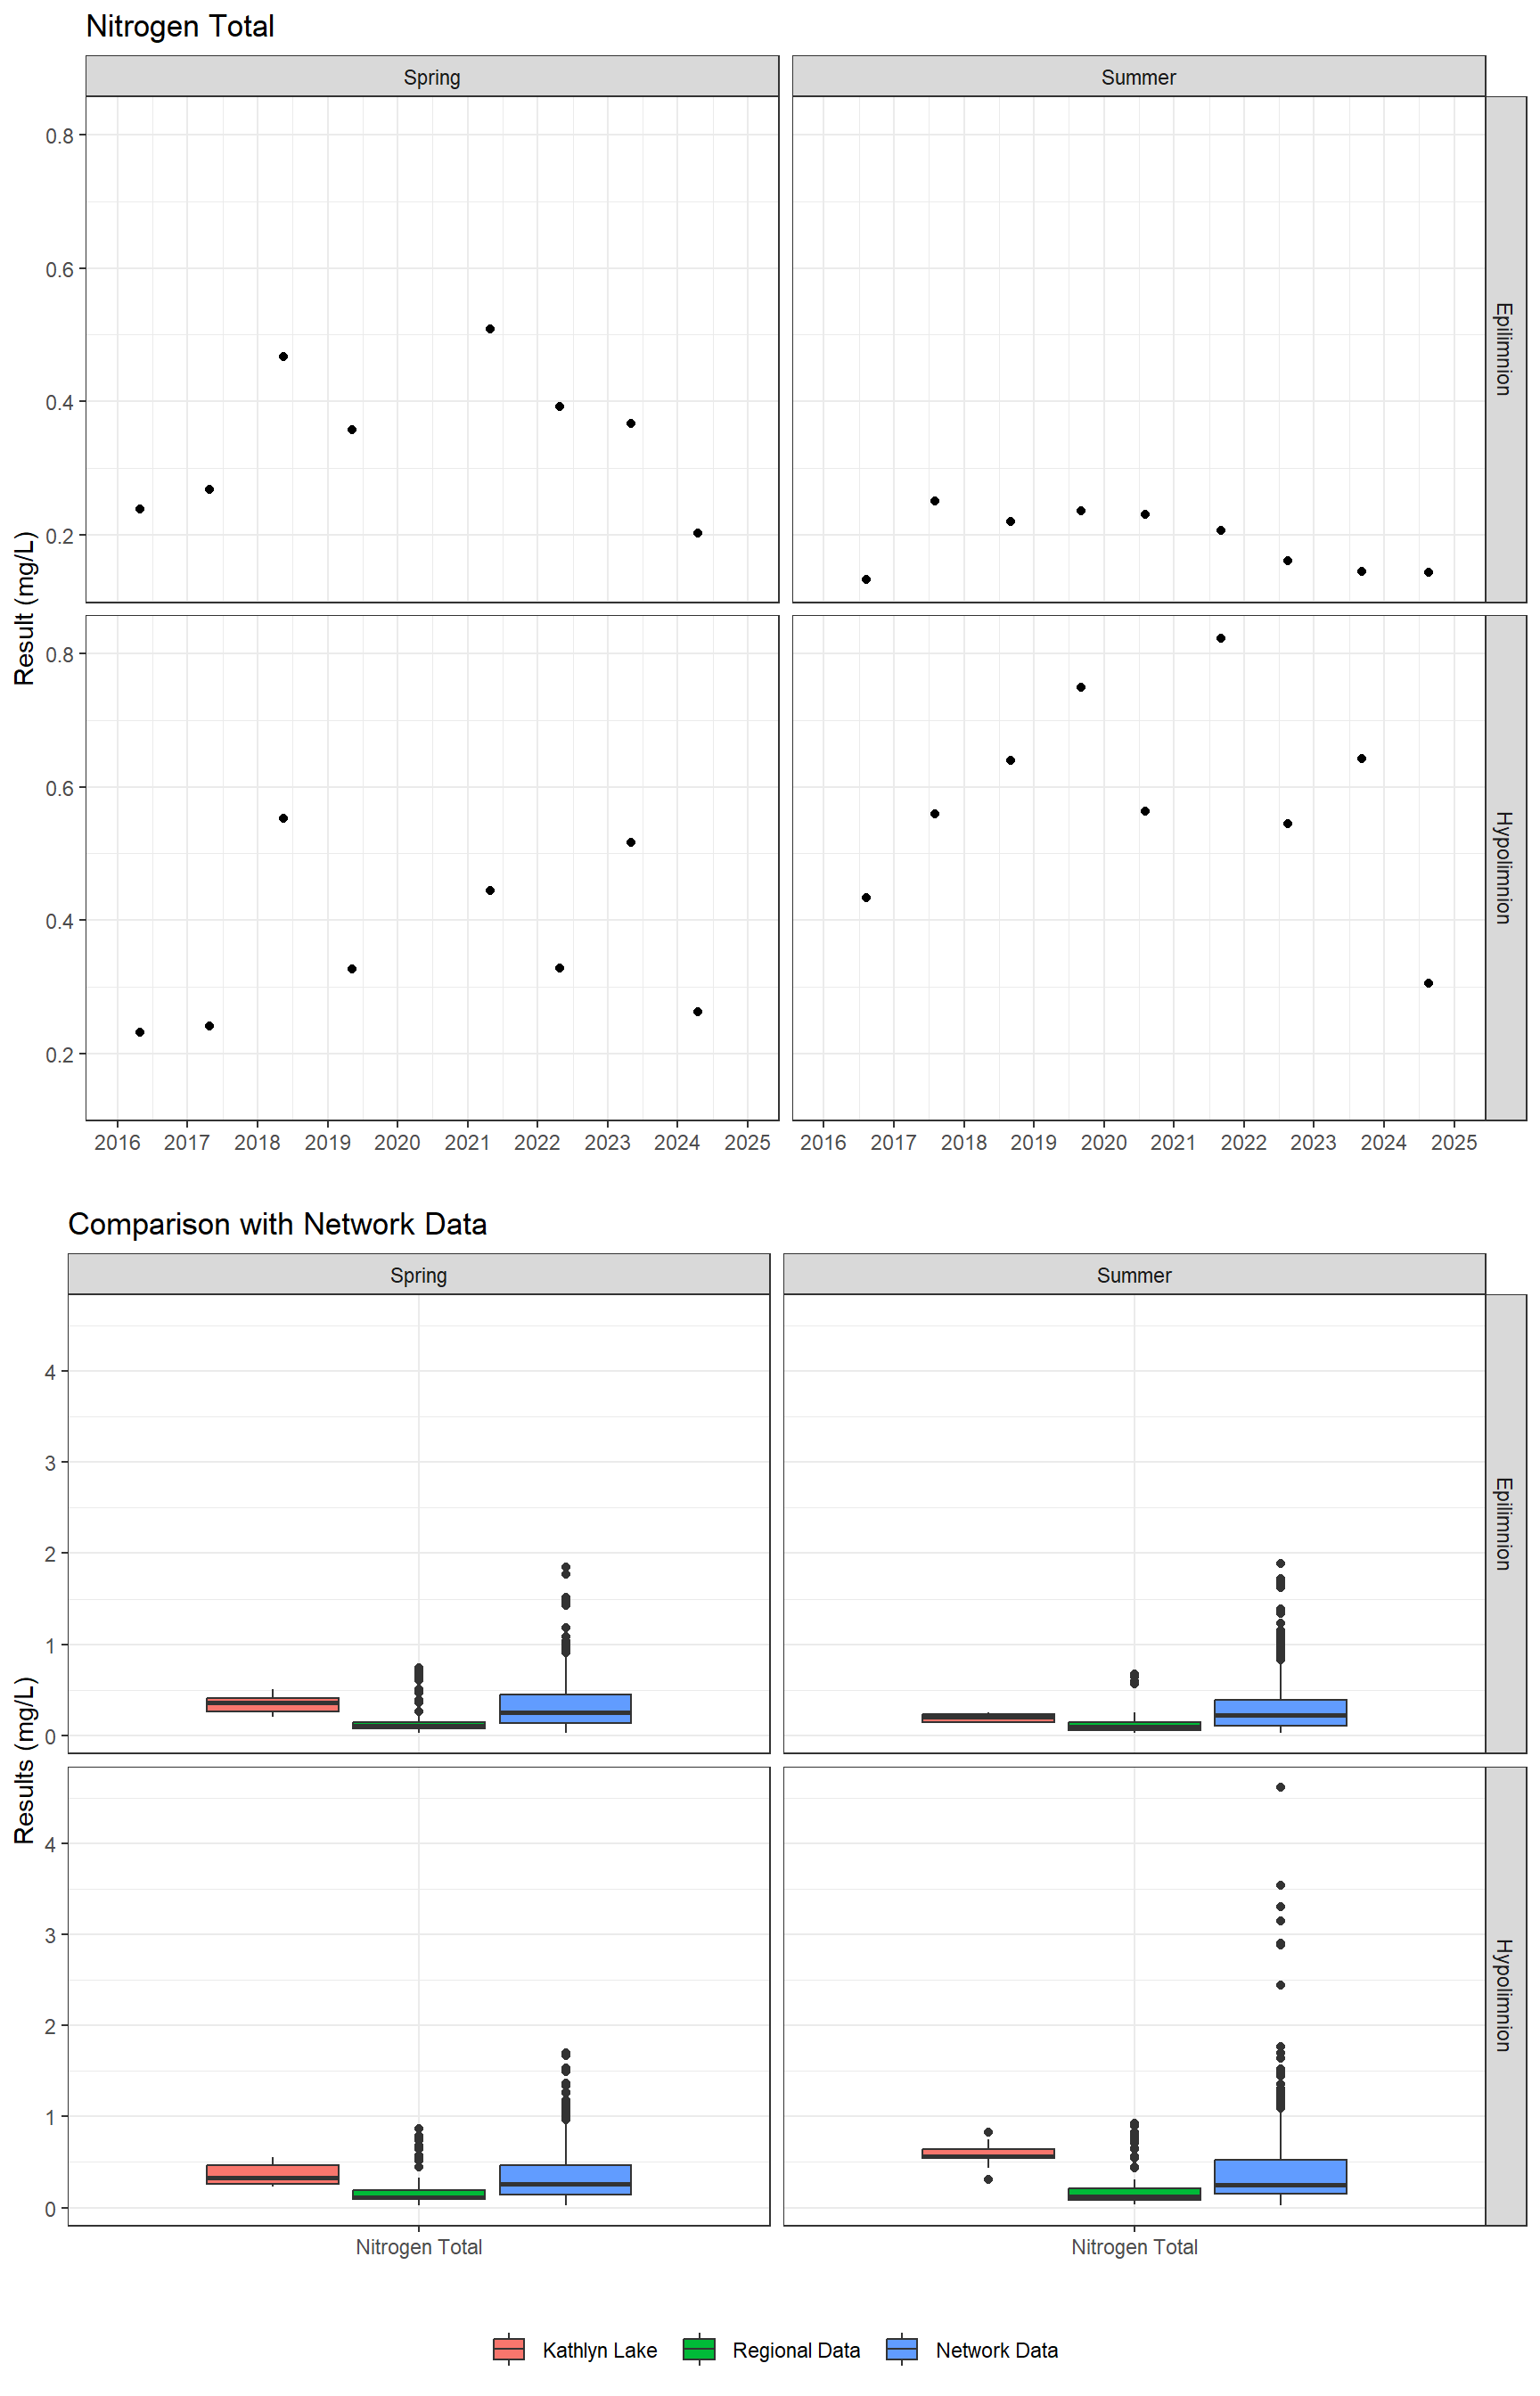
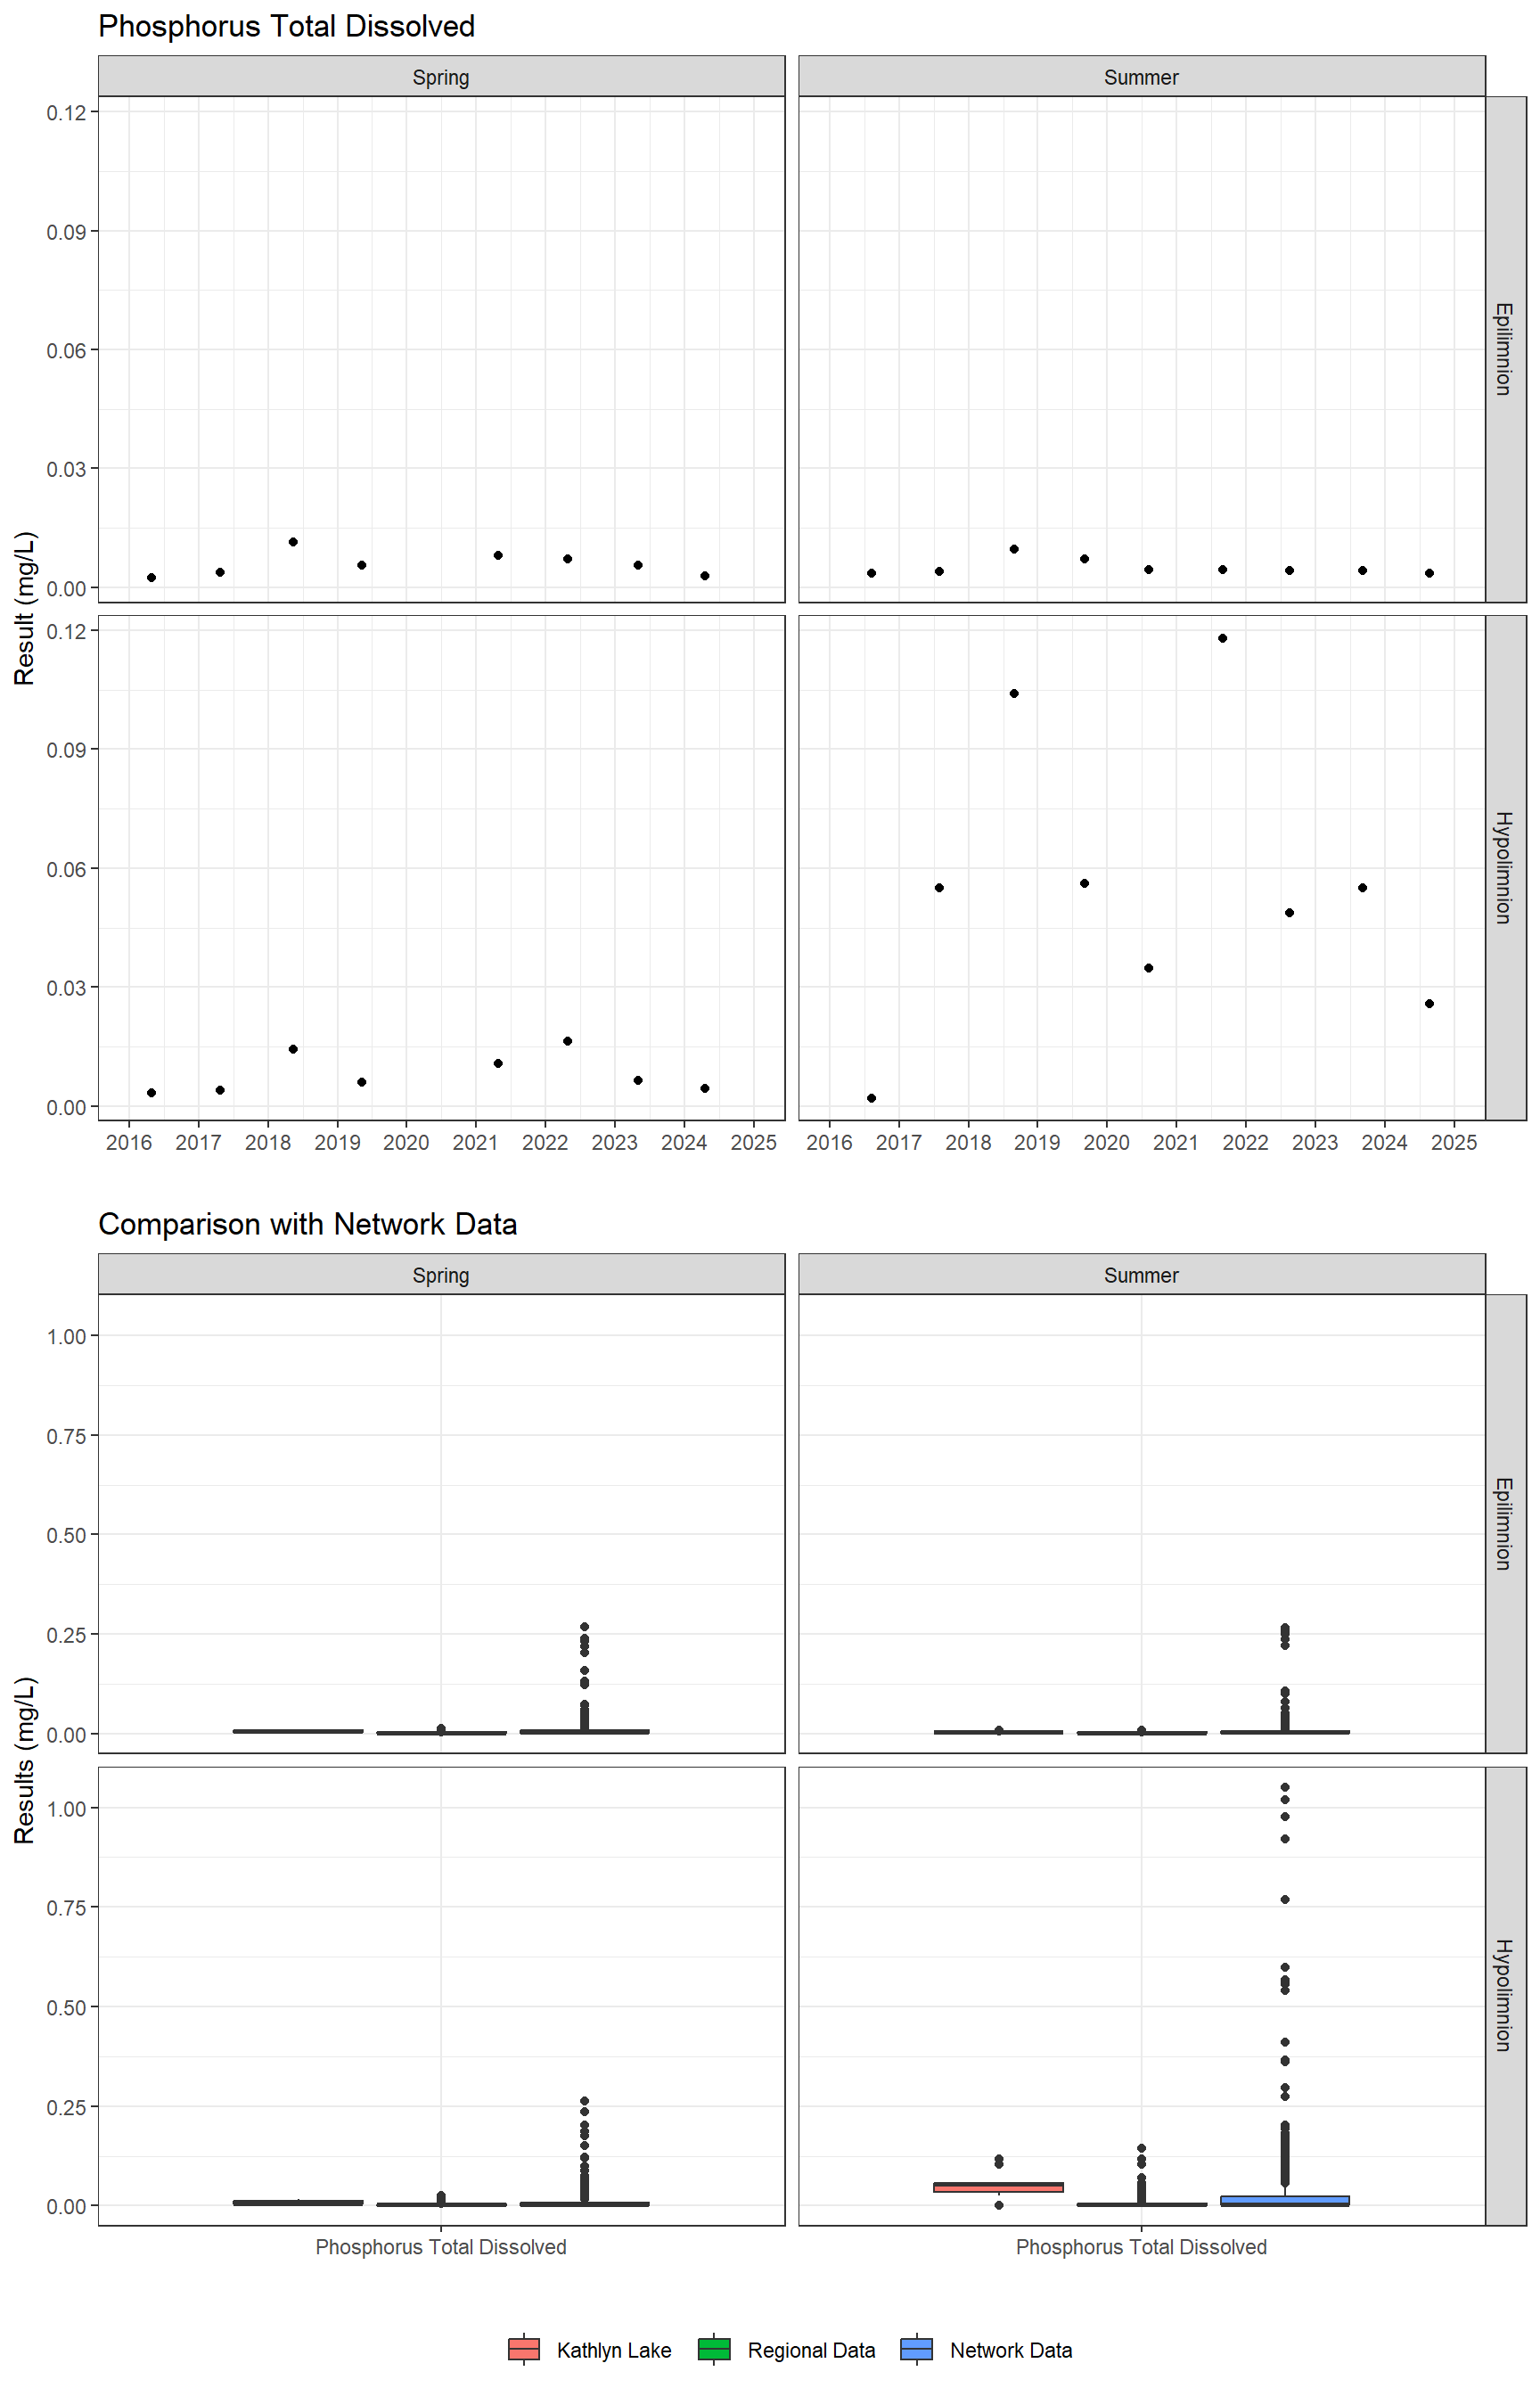
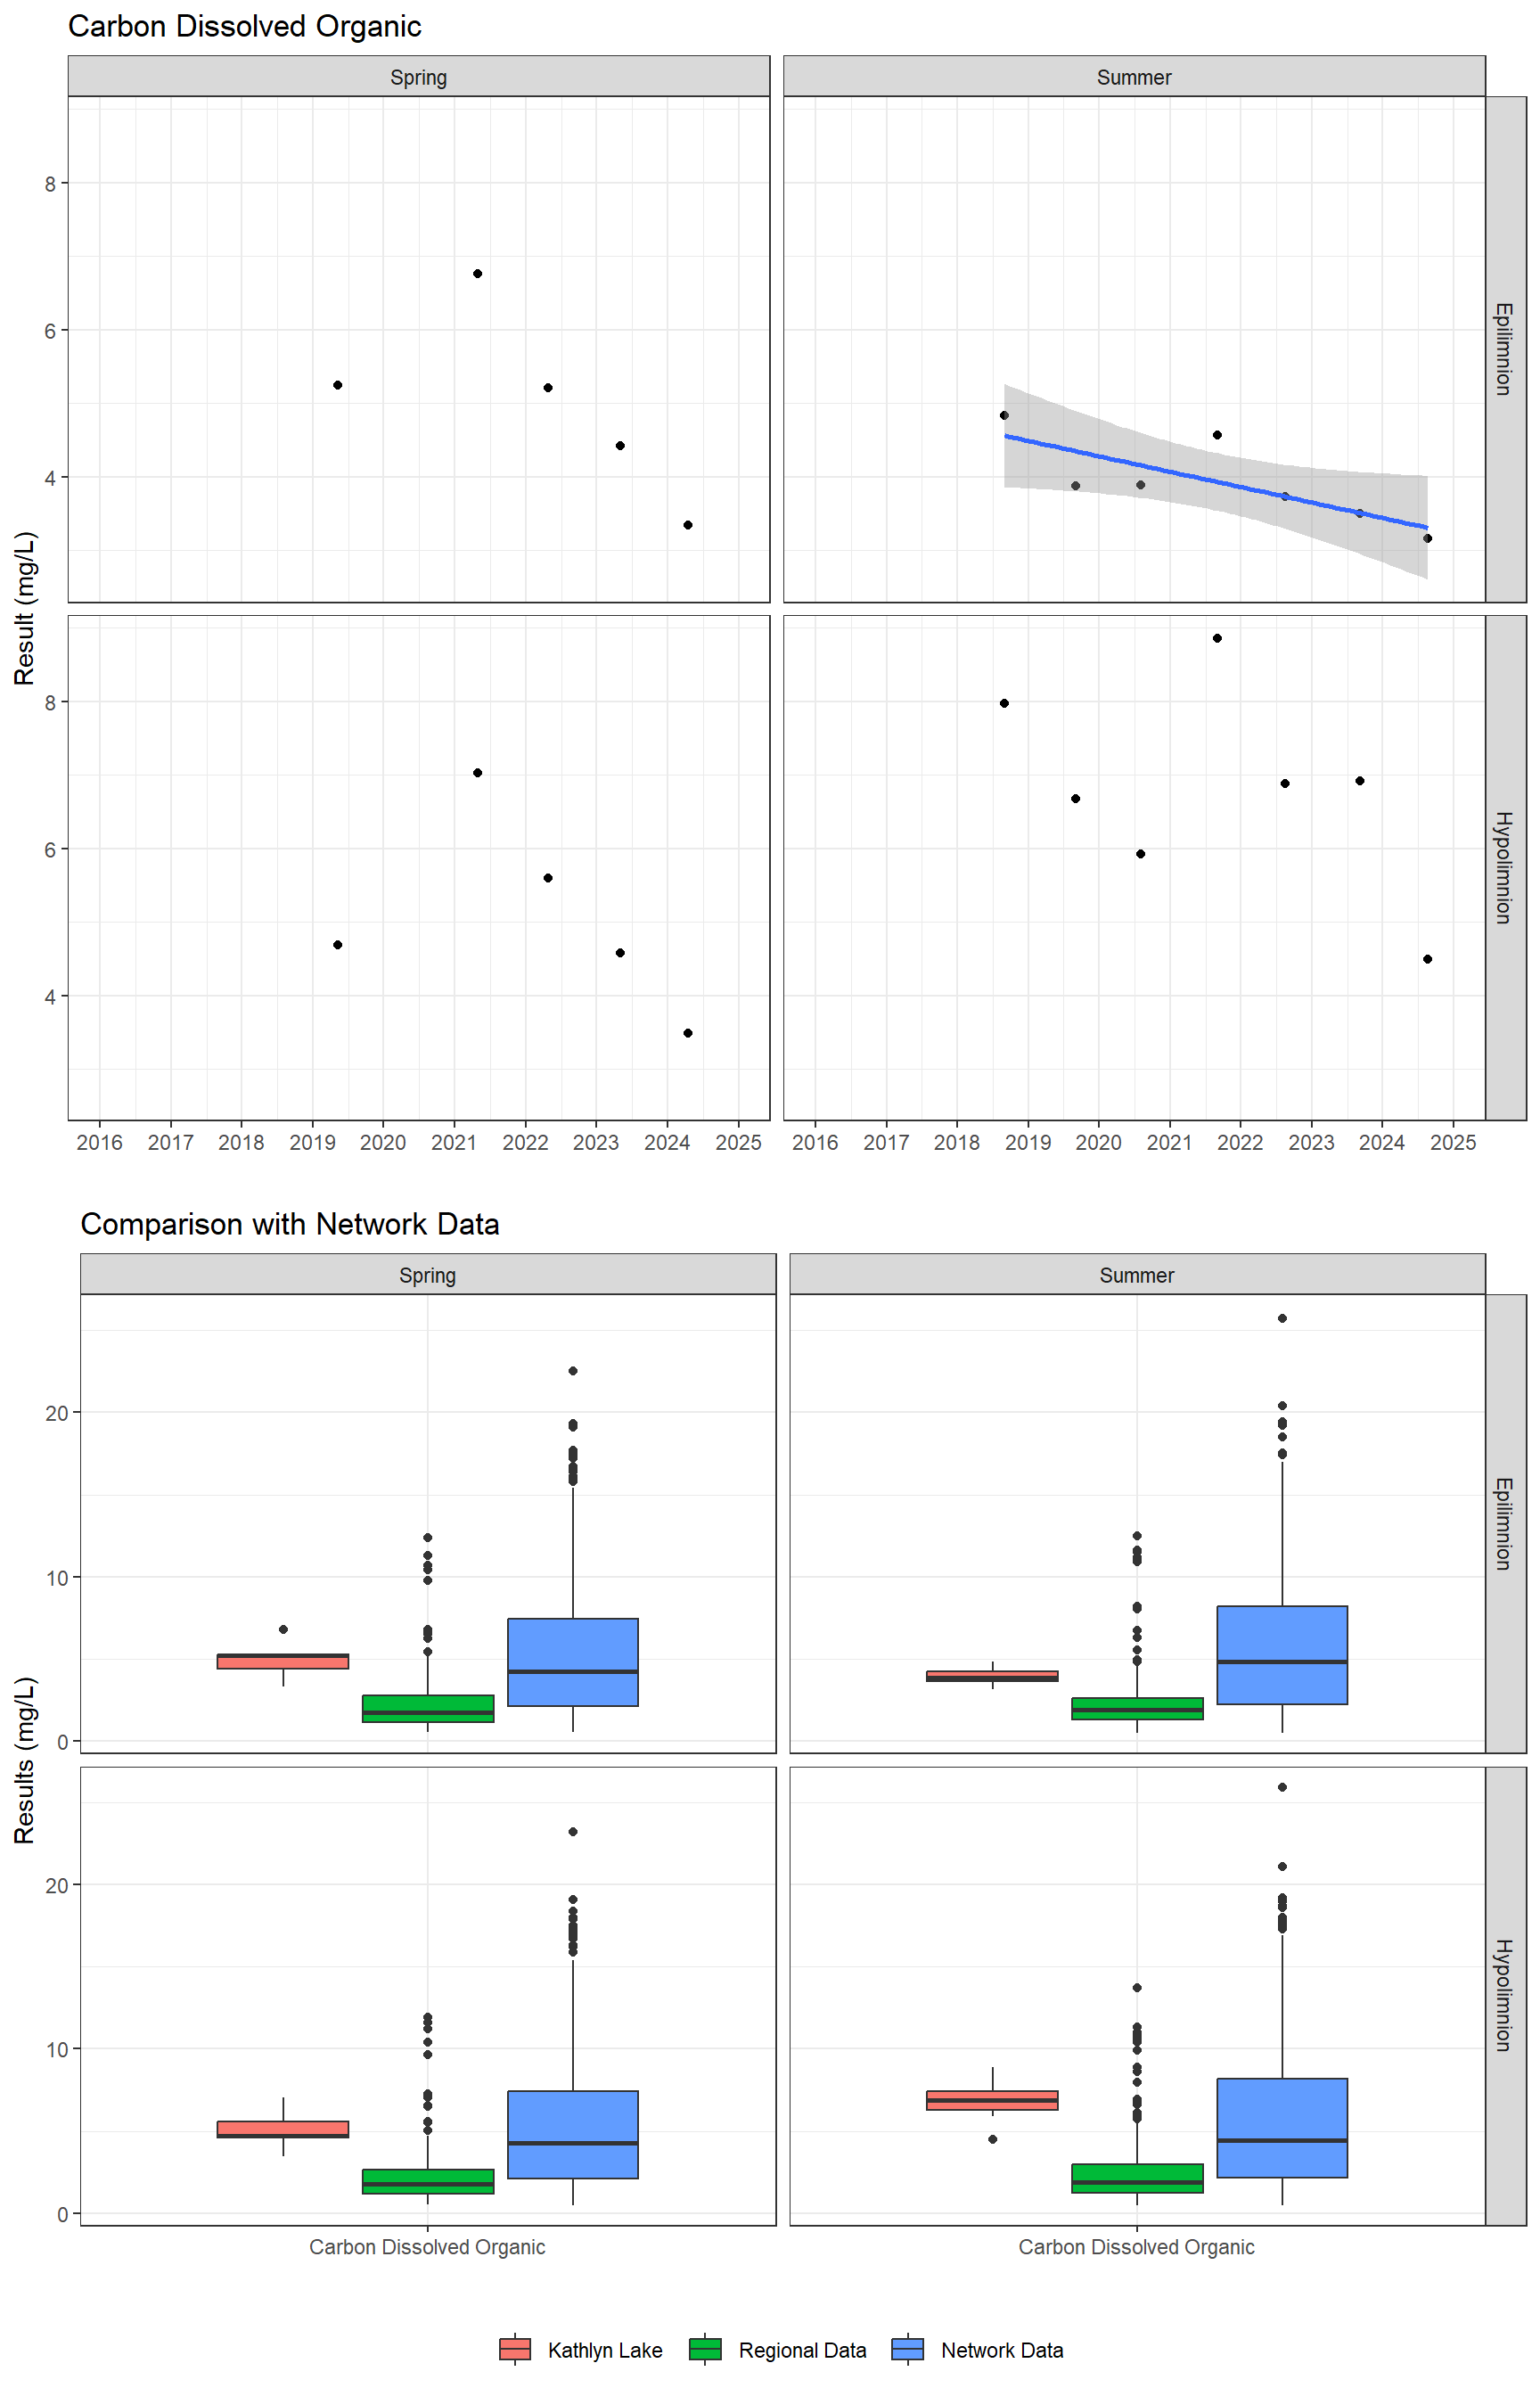
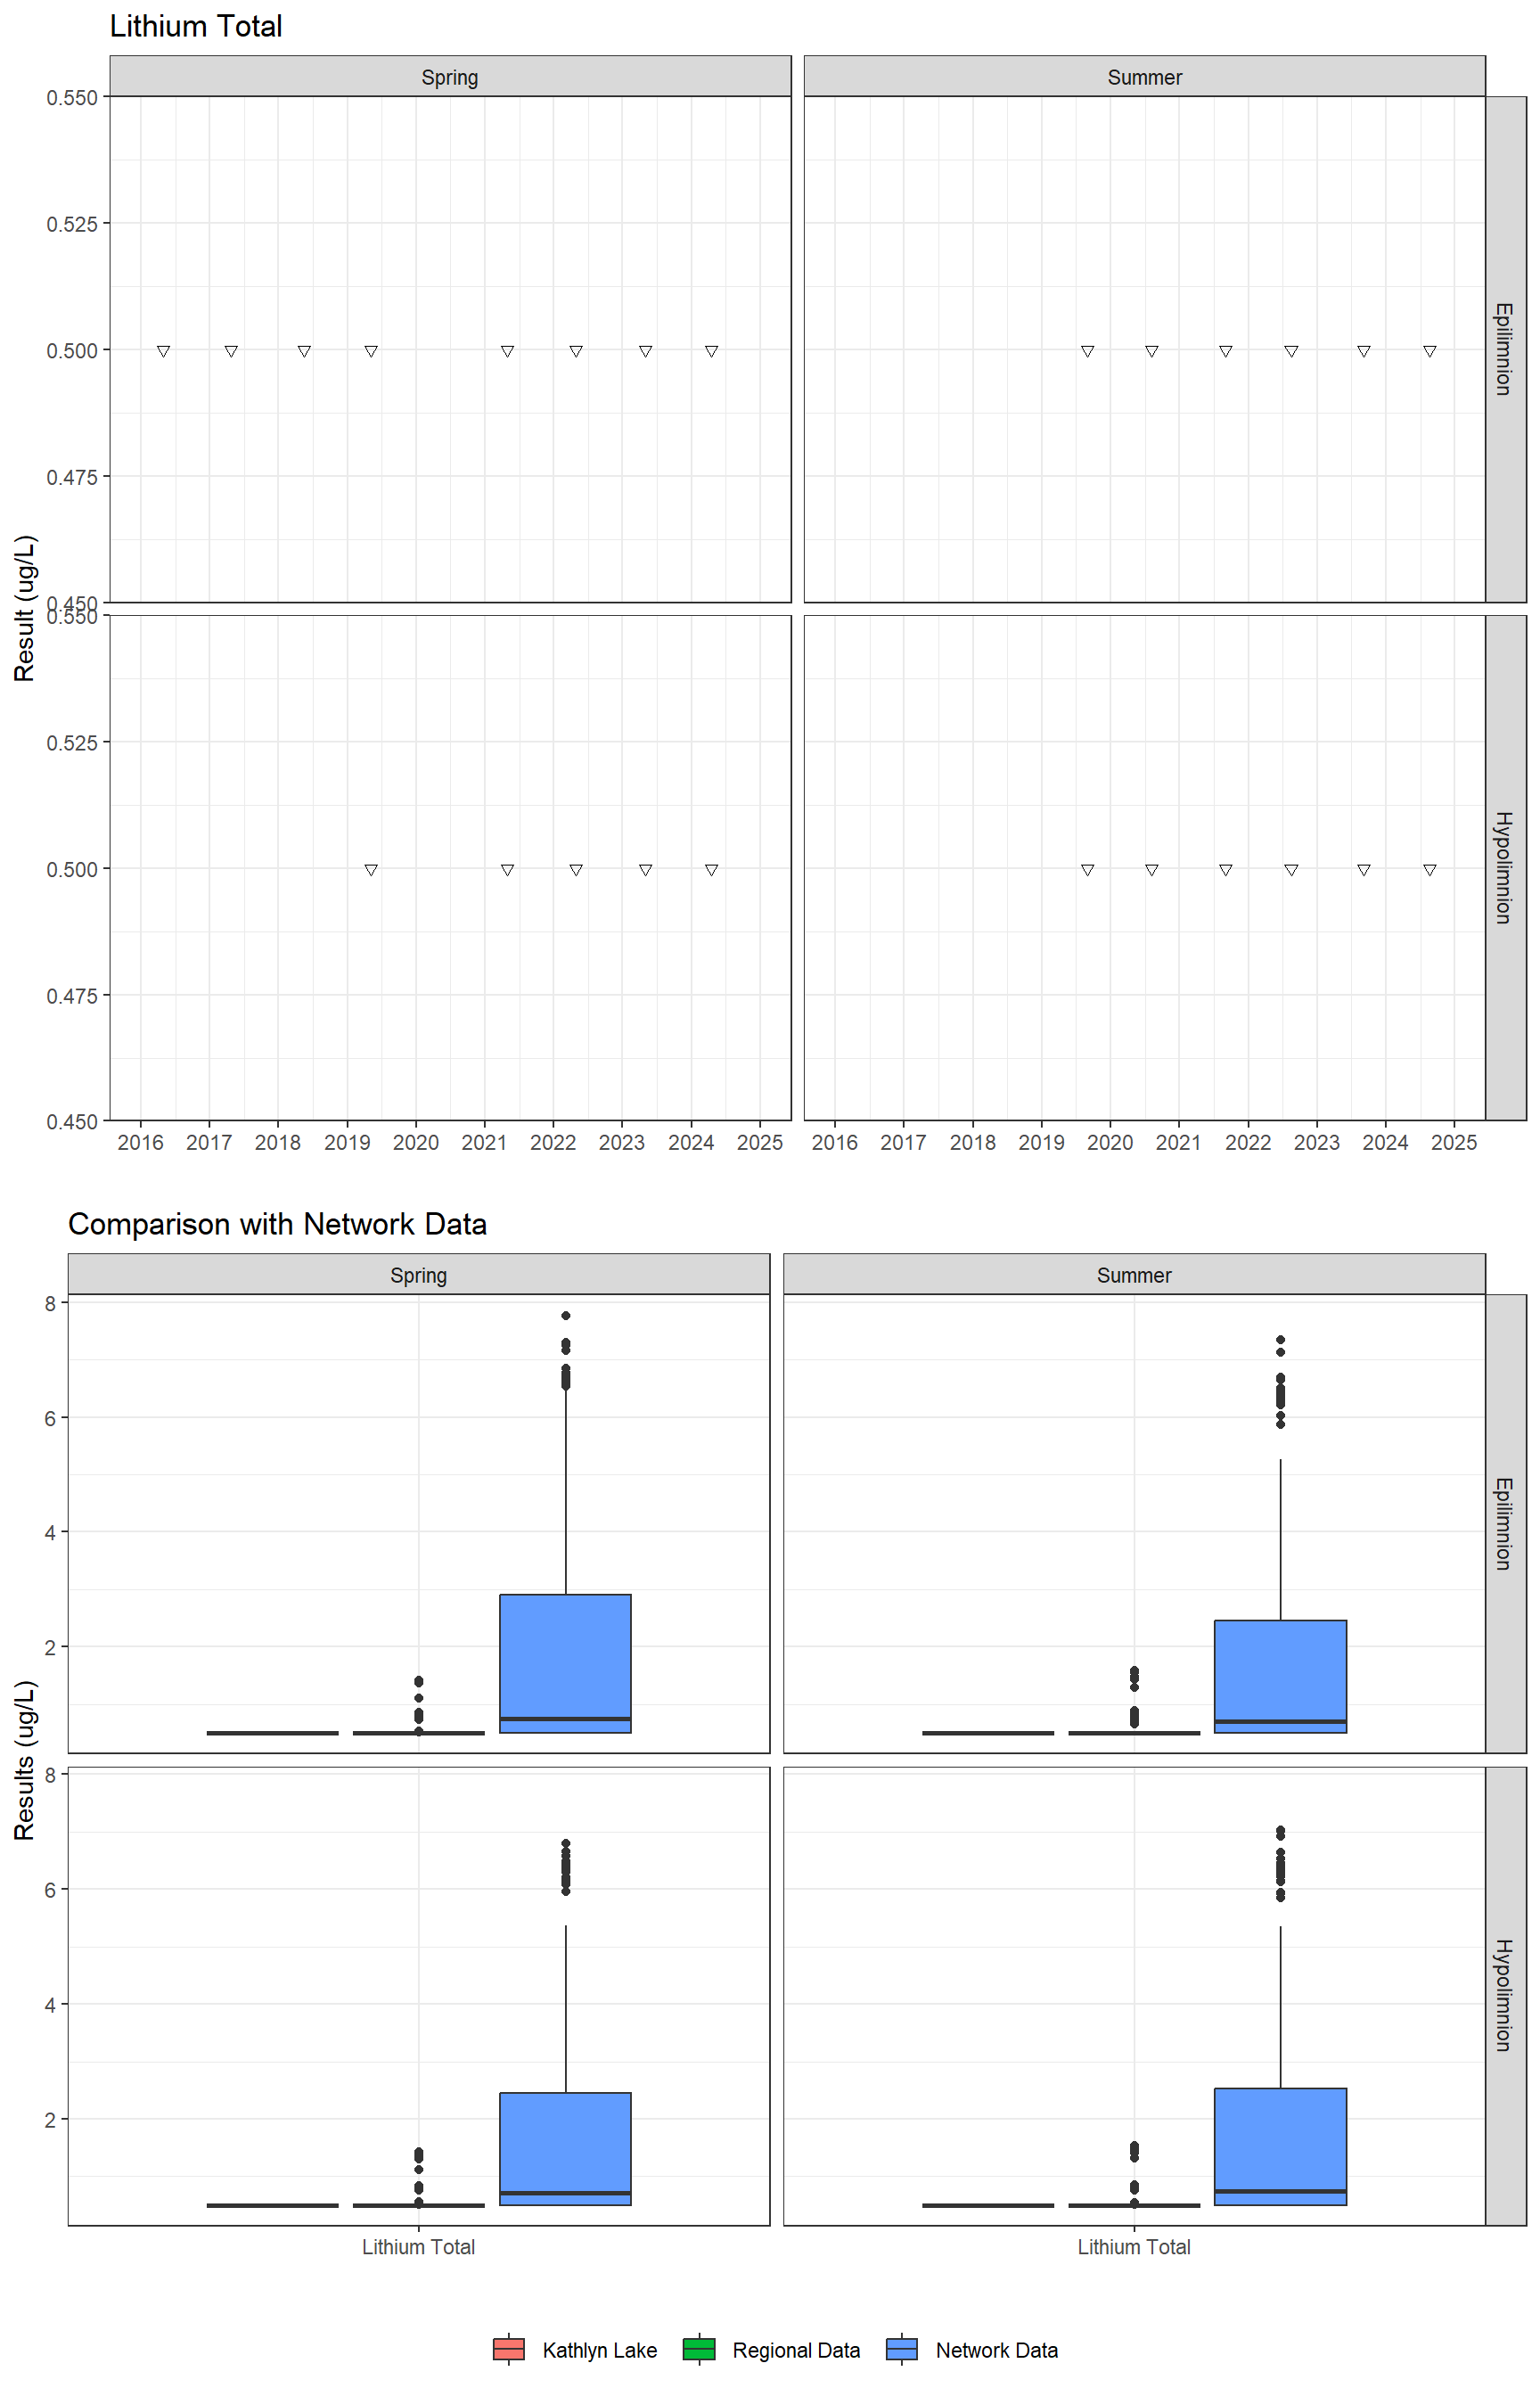
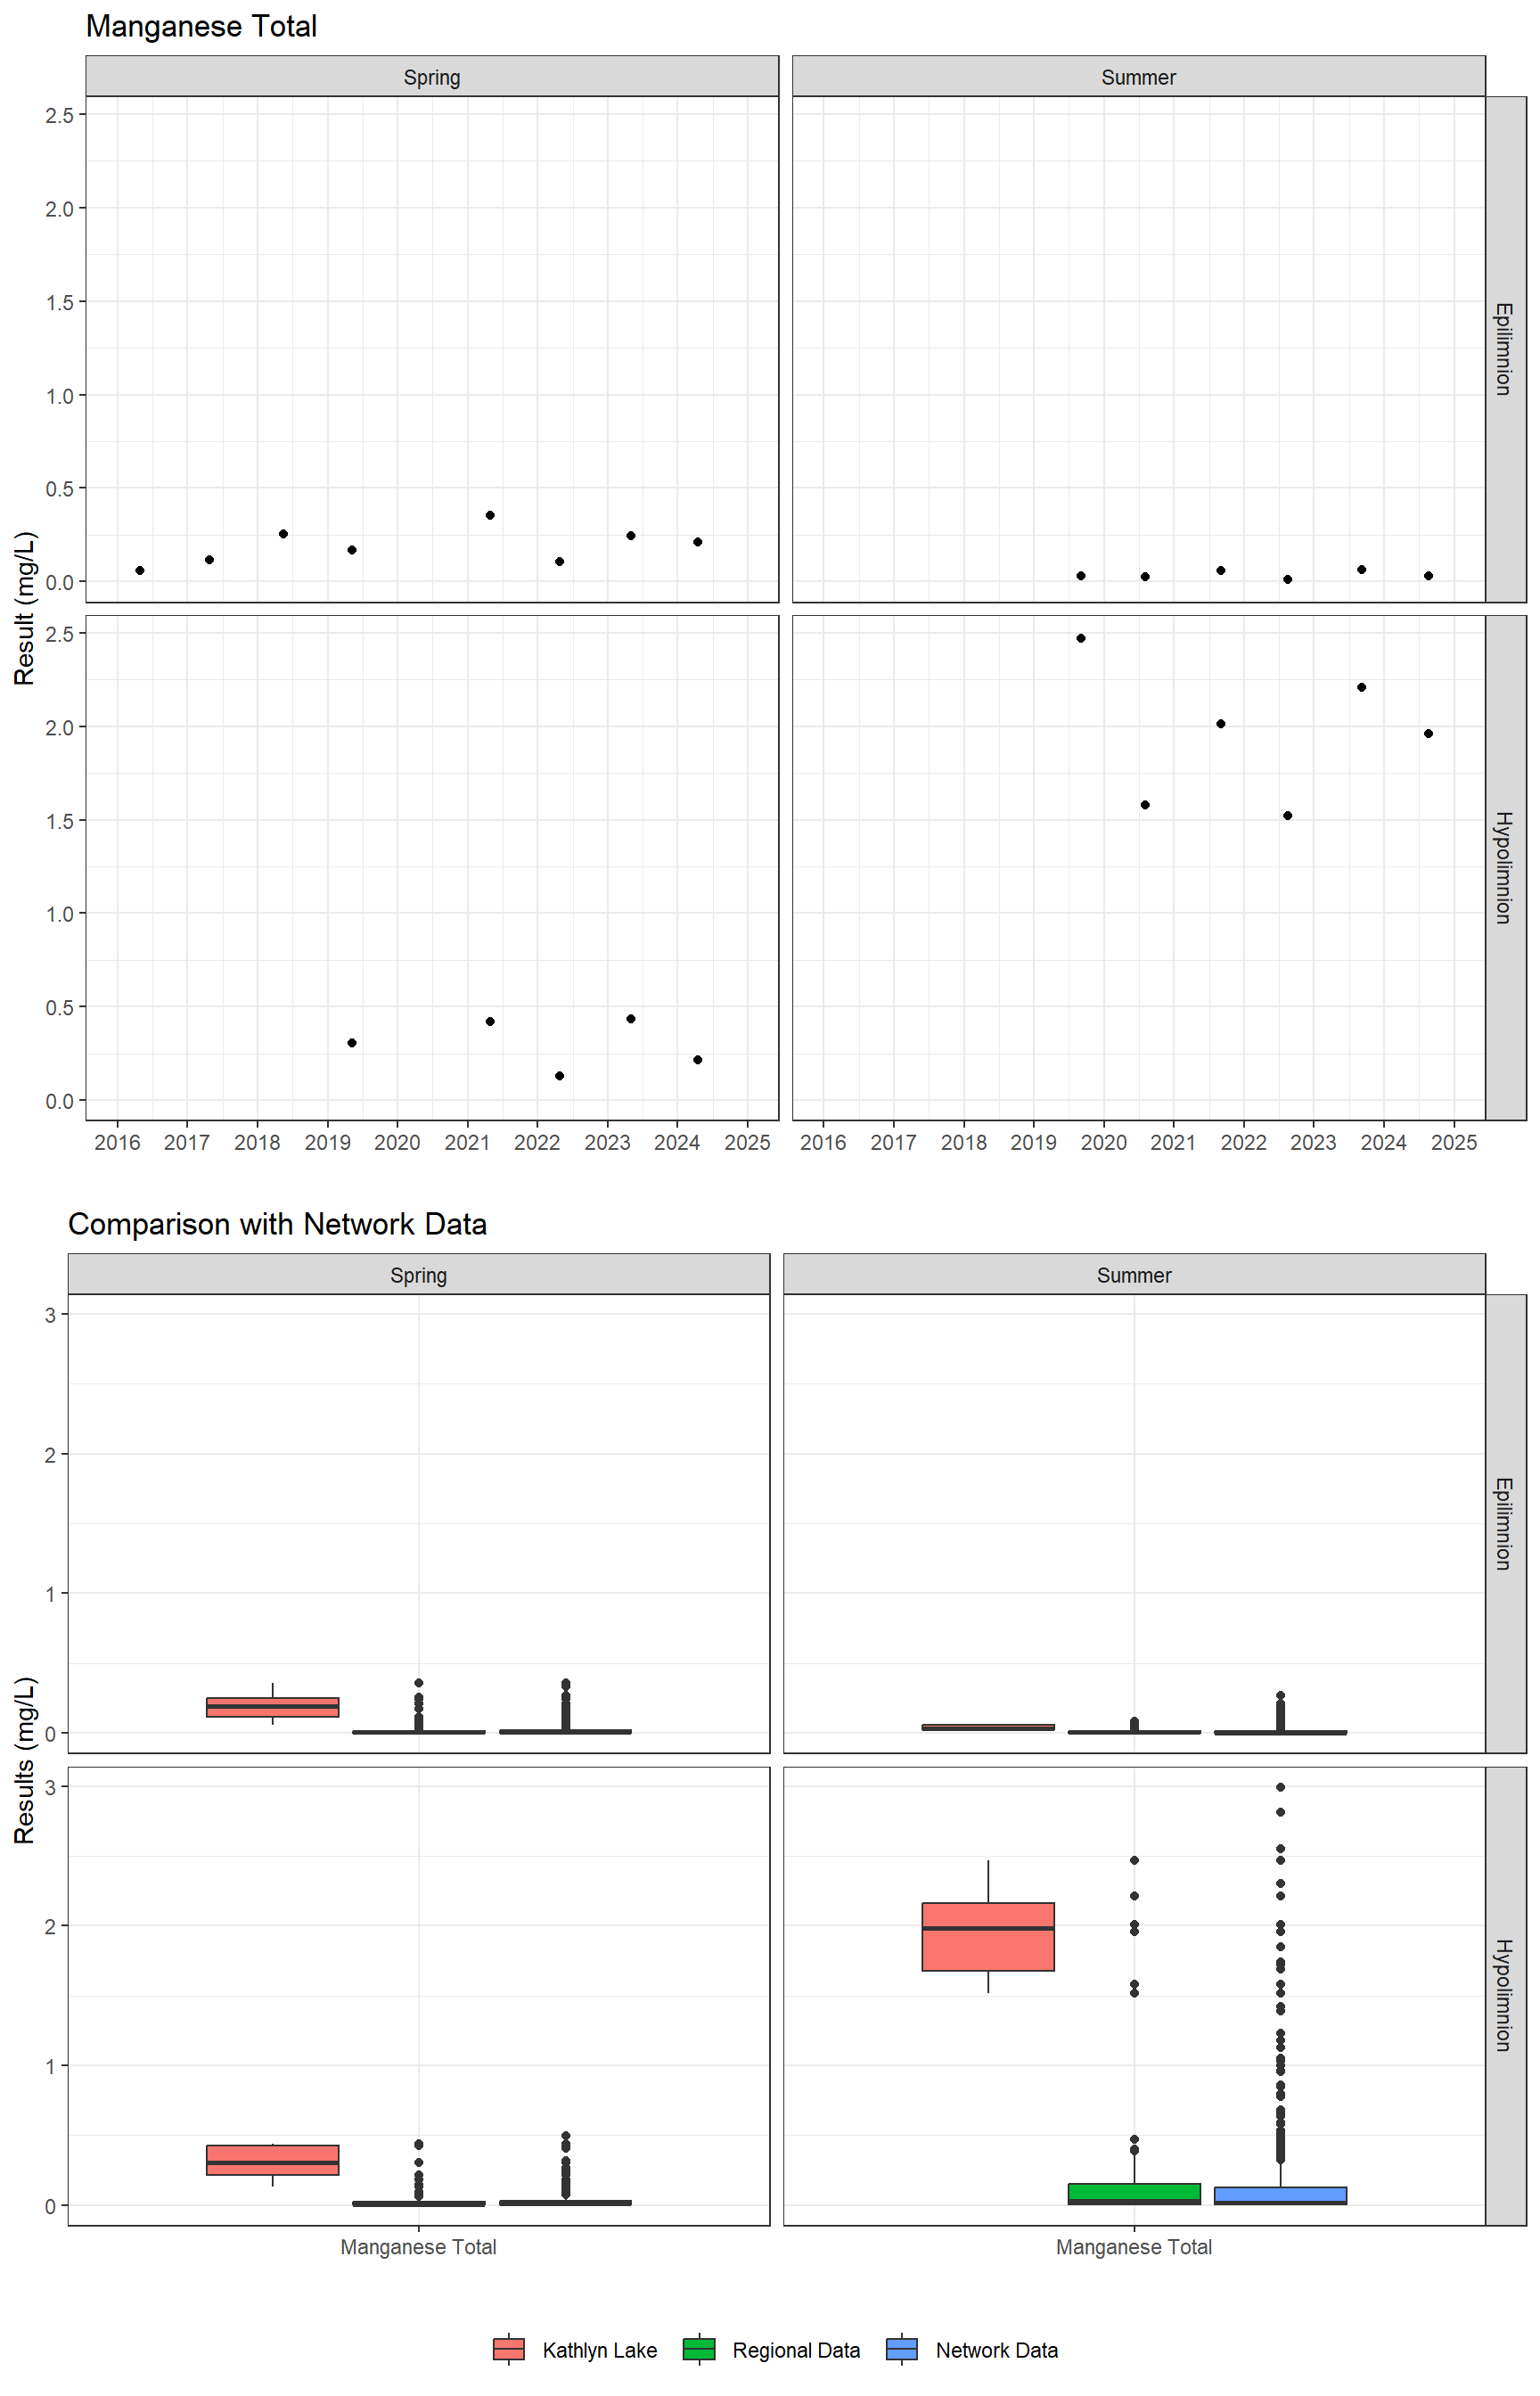
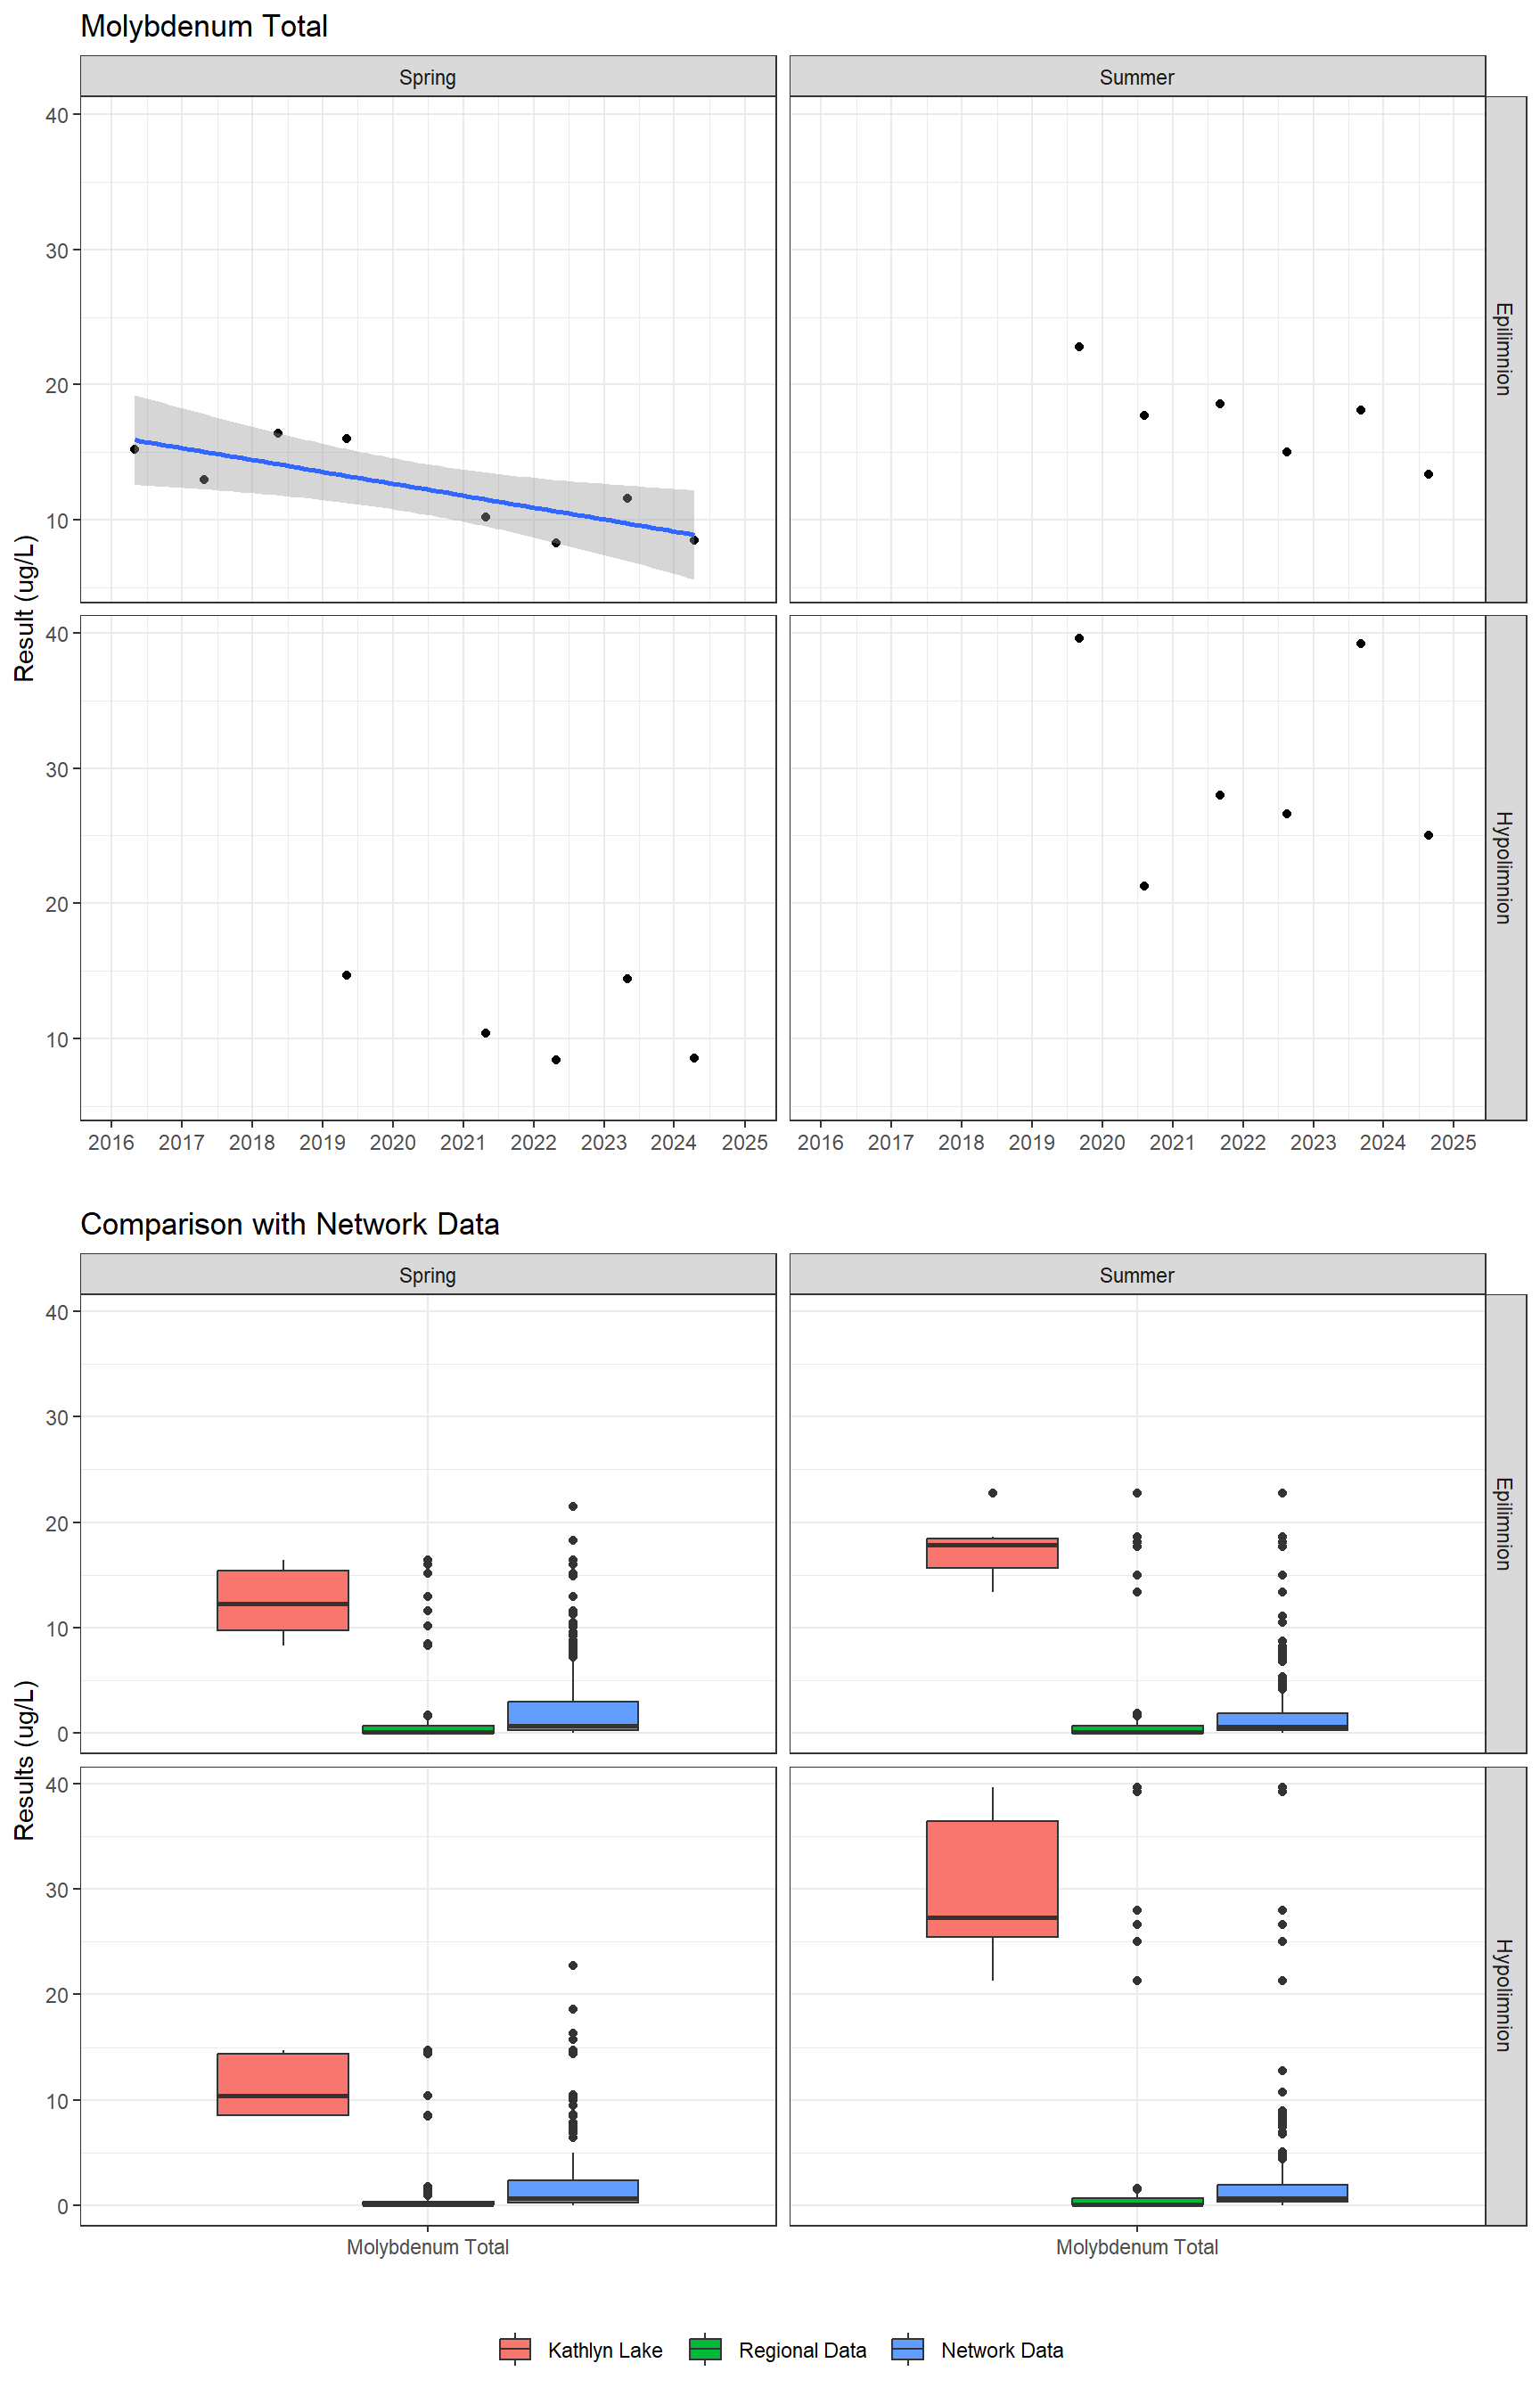
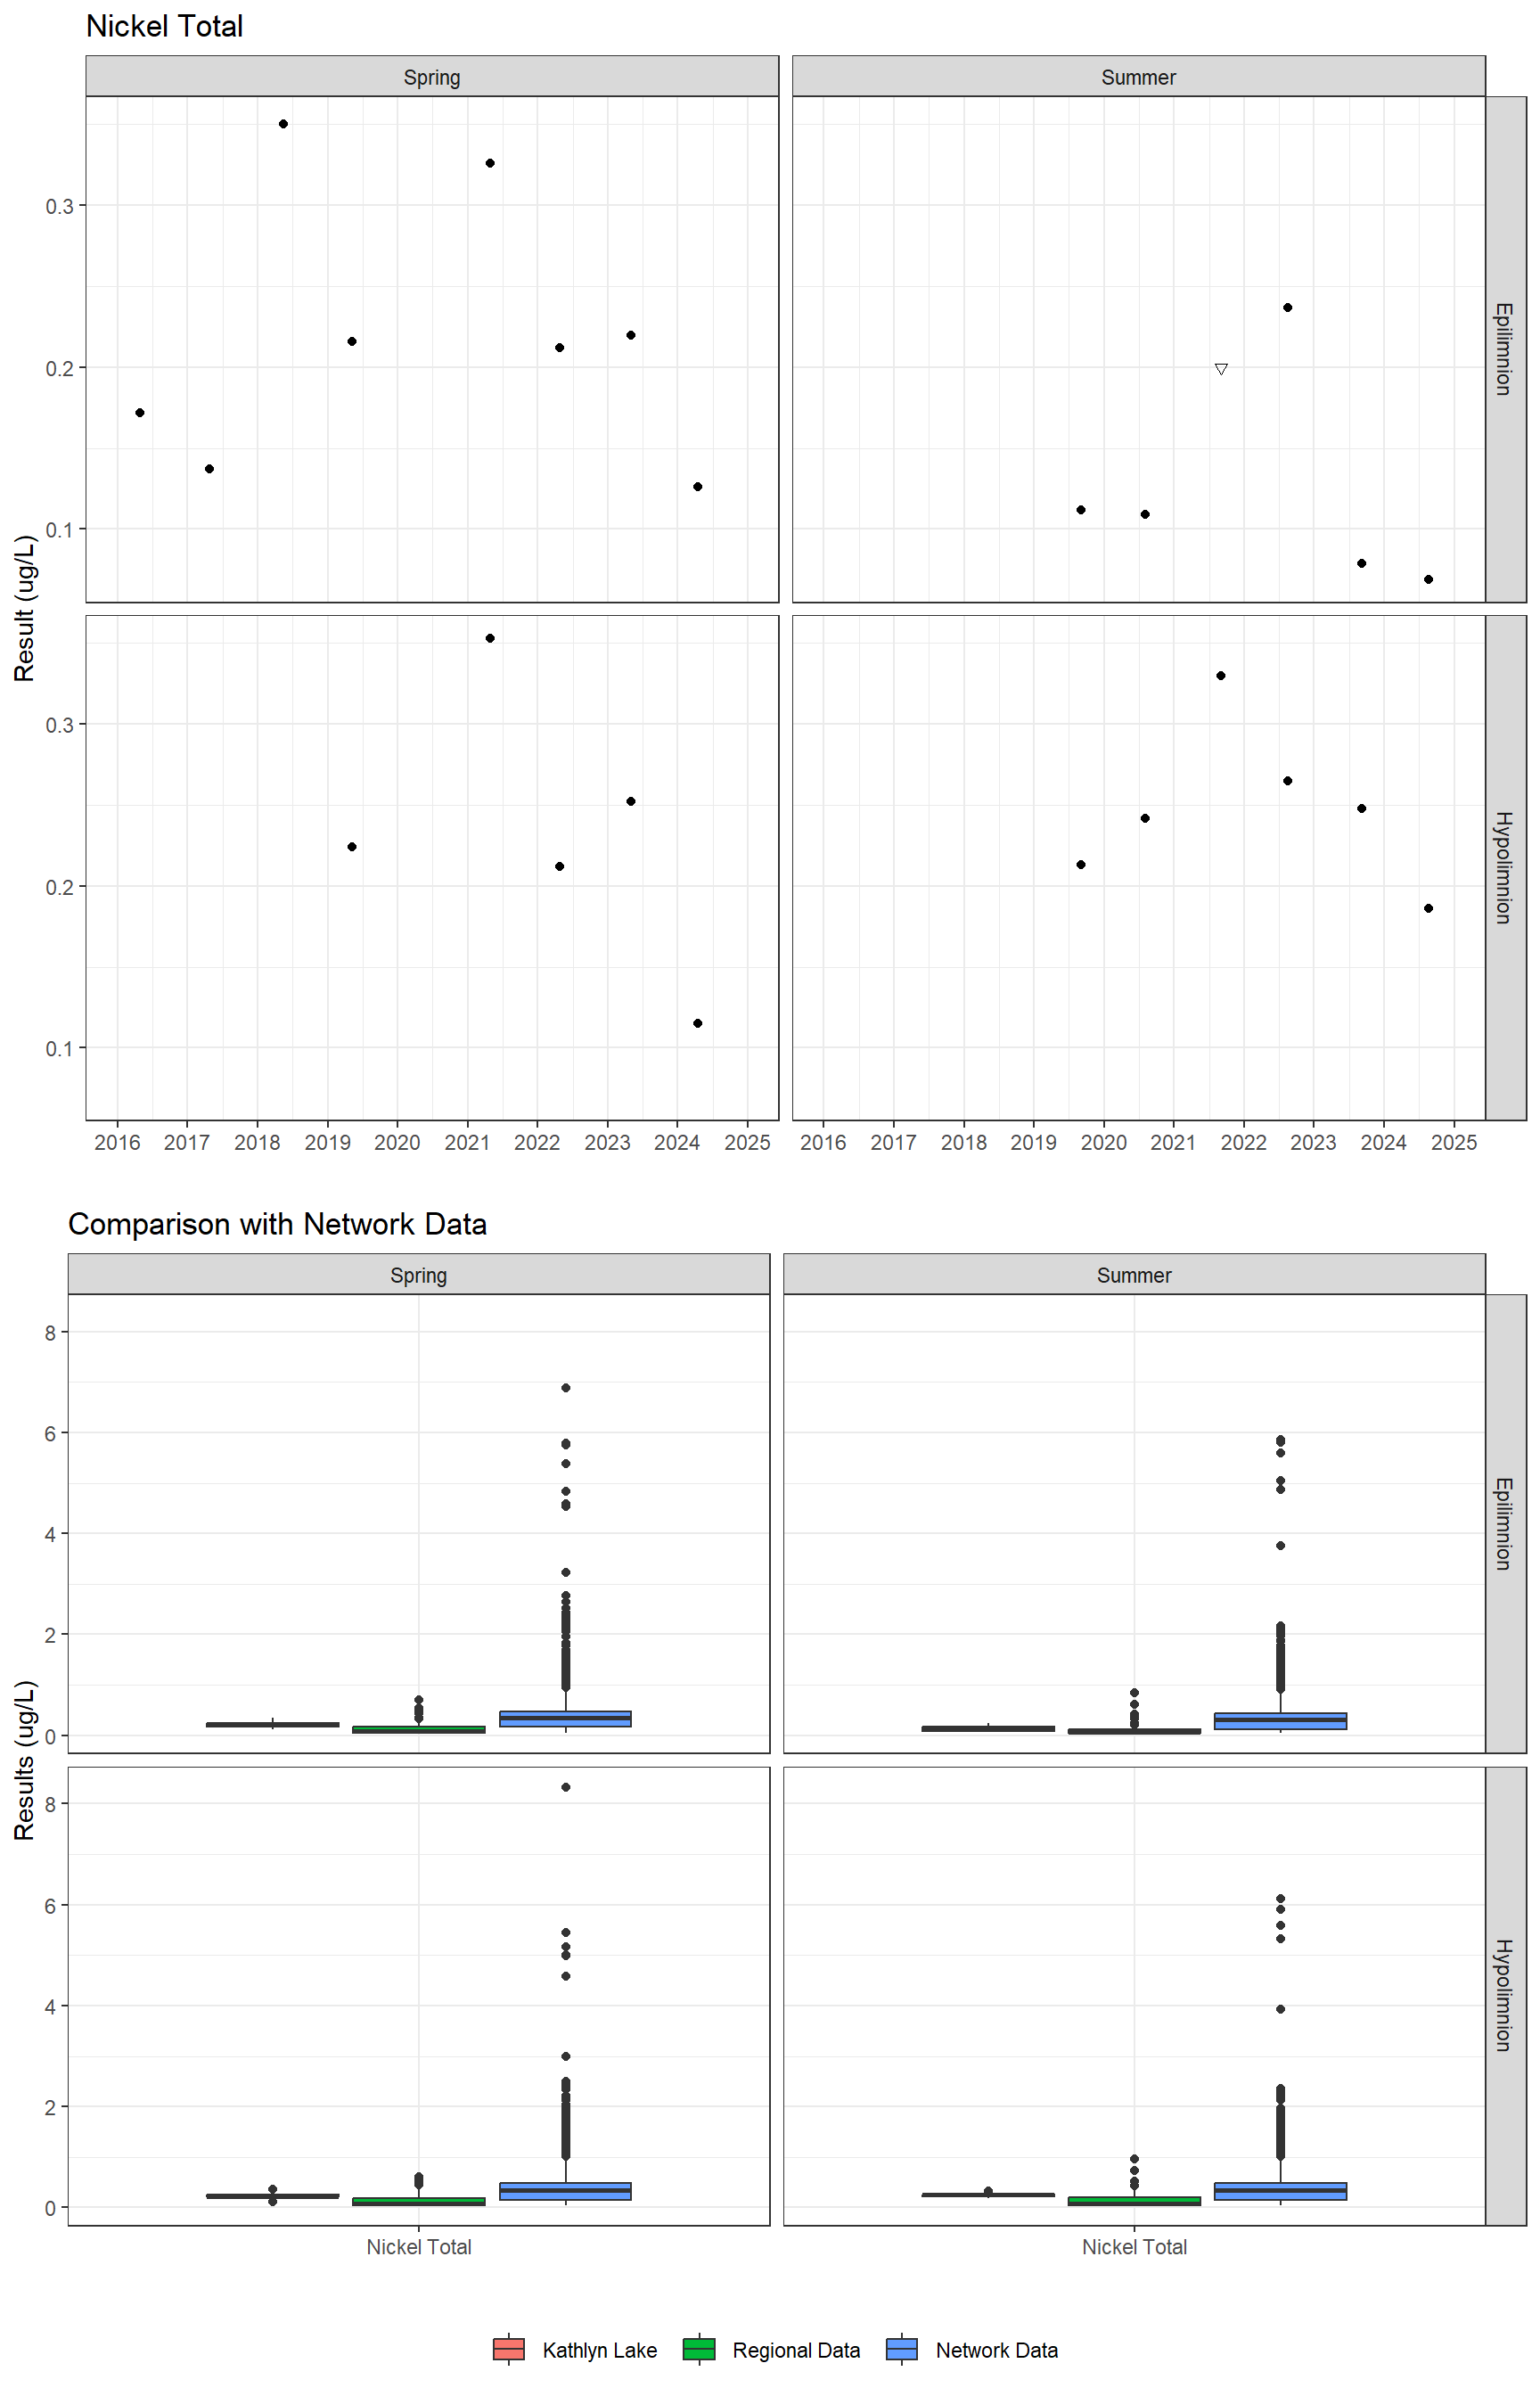
Kathlyn Lake (1131007) is in the Insular and Coastal Mountains limnological region. The recent sampling history at this site is shown in below. Composite samples (water from three depths are mixed together into a single sample) are indicated by a vertical line connecting the uppermost and lowermost sampling depths. The shape of the points indicates if the samples are from of the epilimnion (upper layer; indicated with triangles ▲) or hypolimnion (bottom layer; indicated with solid circles ●) of the lake. For lakes less than 10 m deep composite sampling is not done, instead a single sample 1 m below the surface represents the epilimnion and one sample 1 m off the bottom represents the hypolimnion.
To read more about sampling methodology and other details about B.C. Lakes Monitoring Network (BCLMN), including findings and published reports go here.
Monitoring Results and Trends
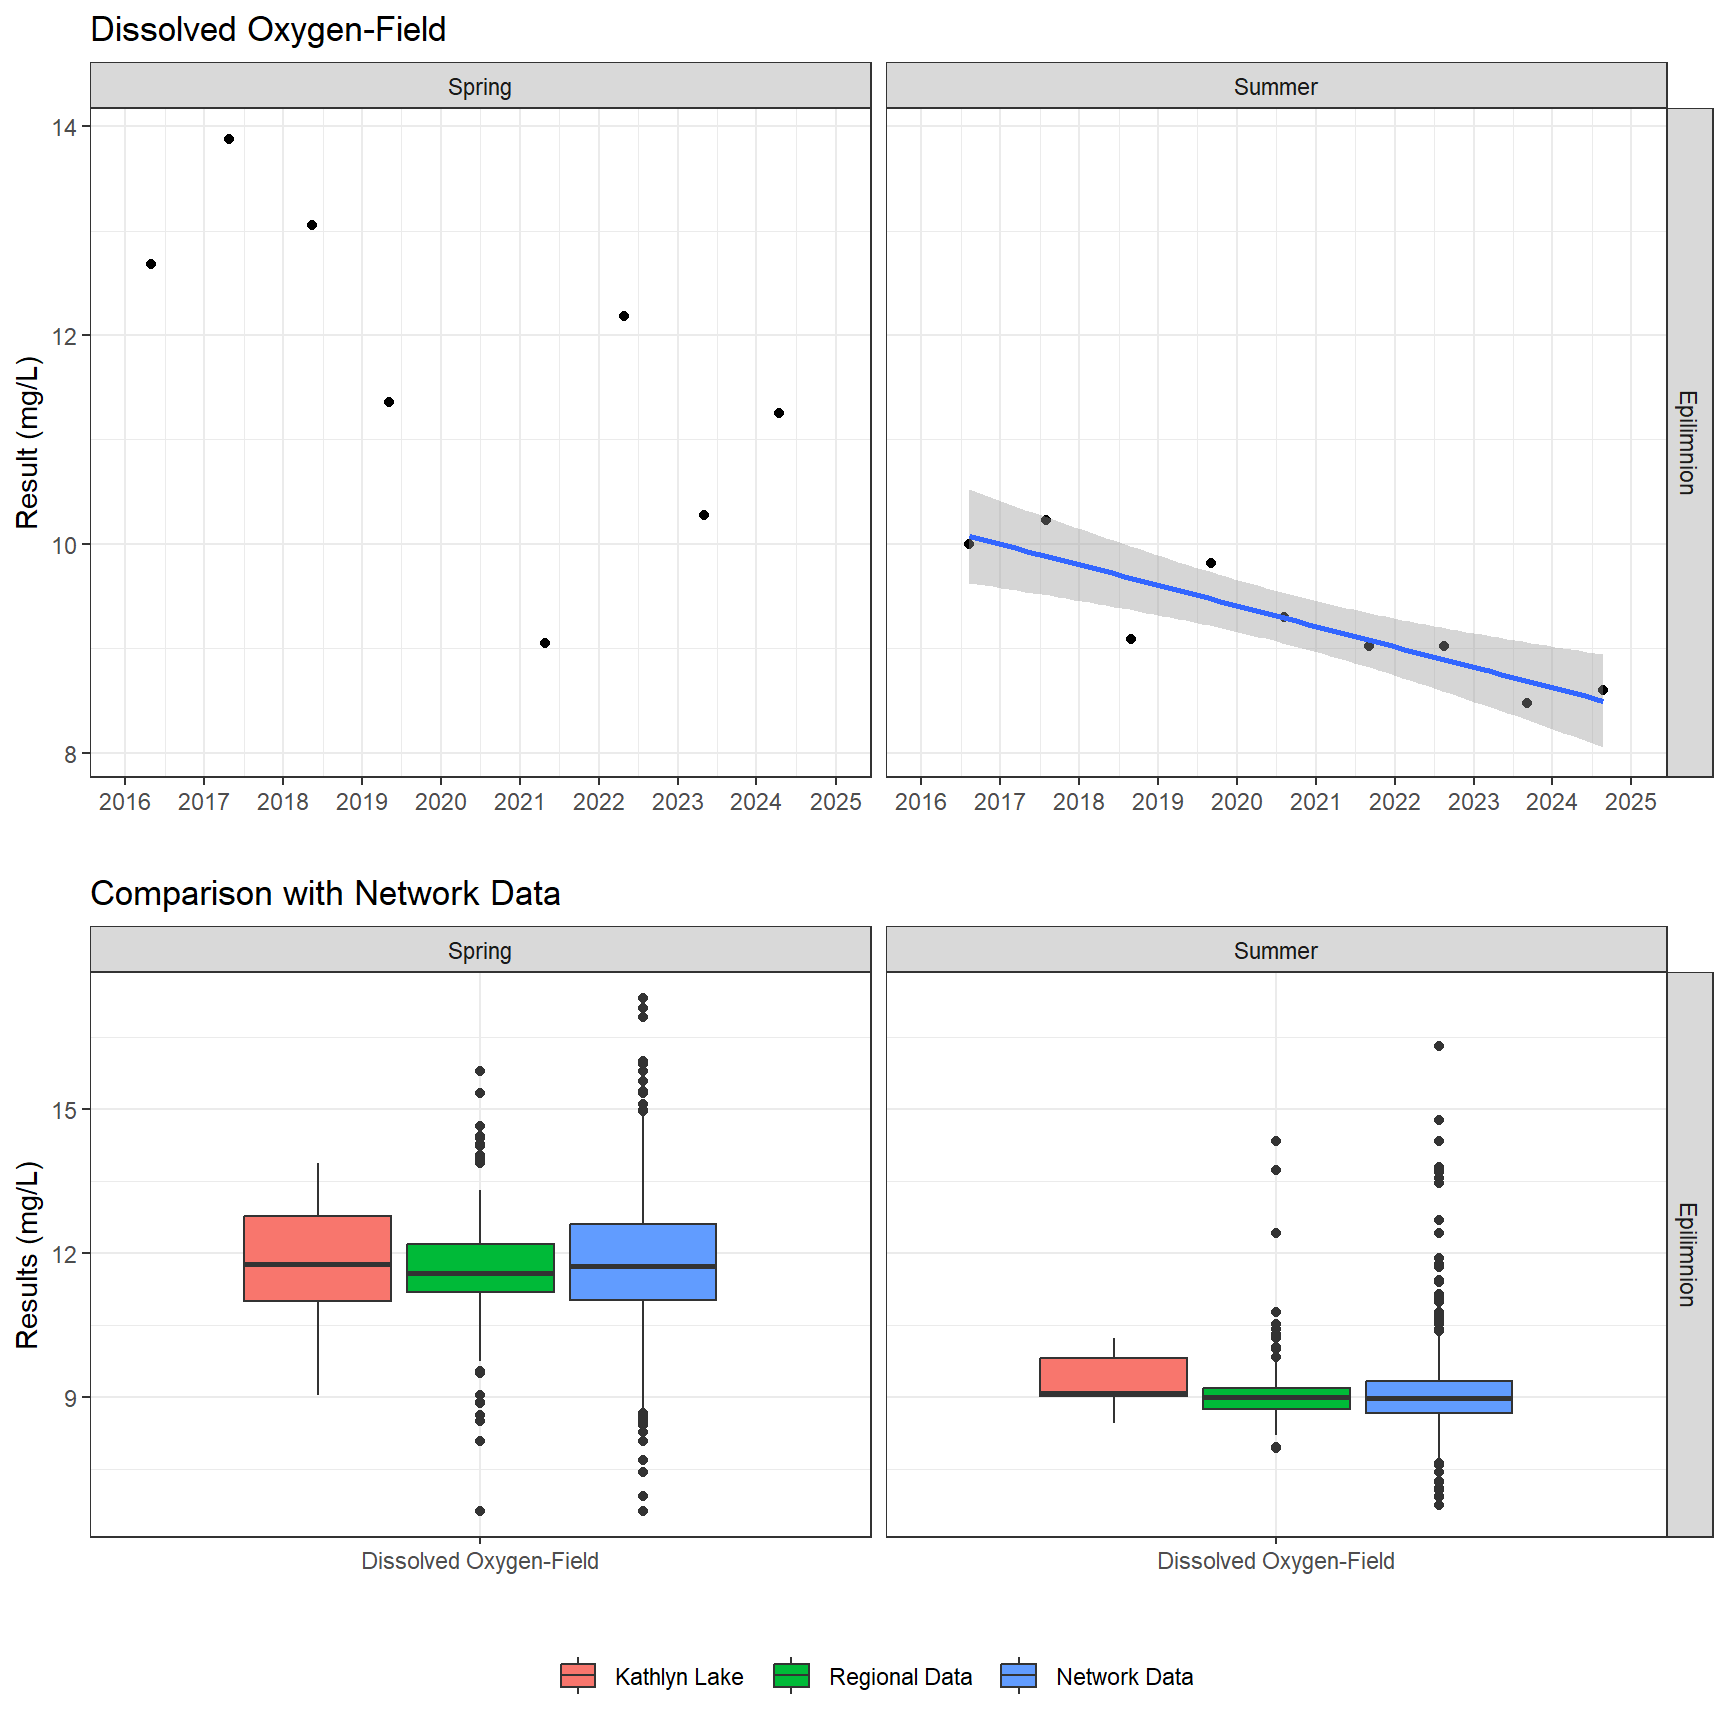
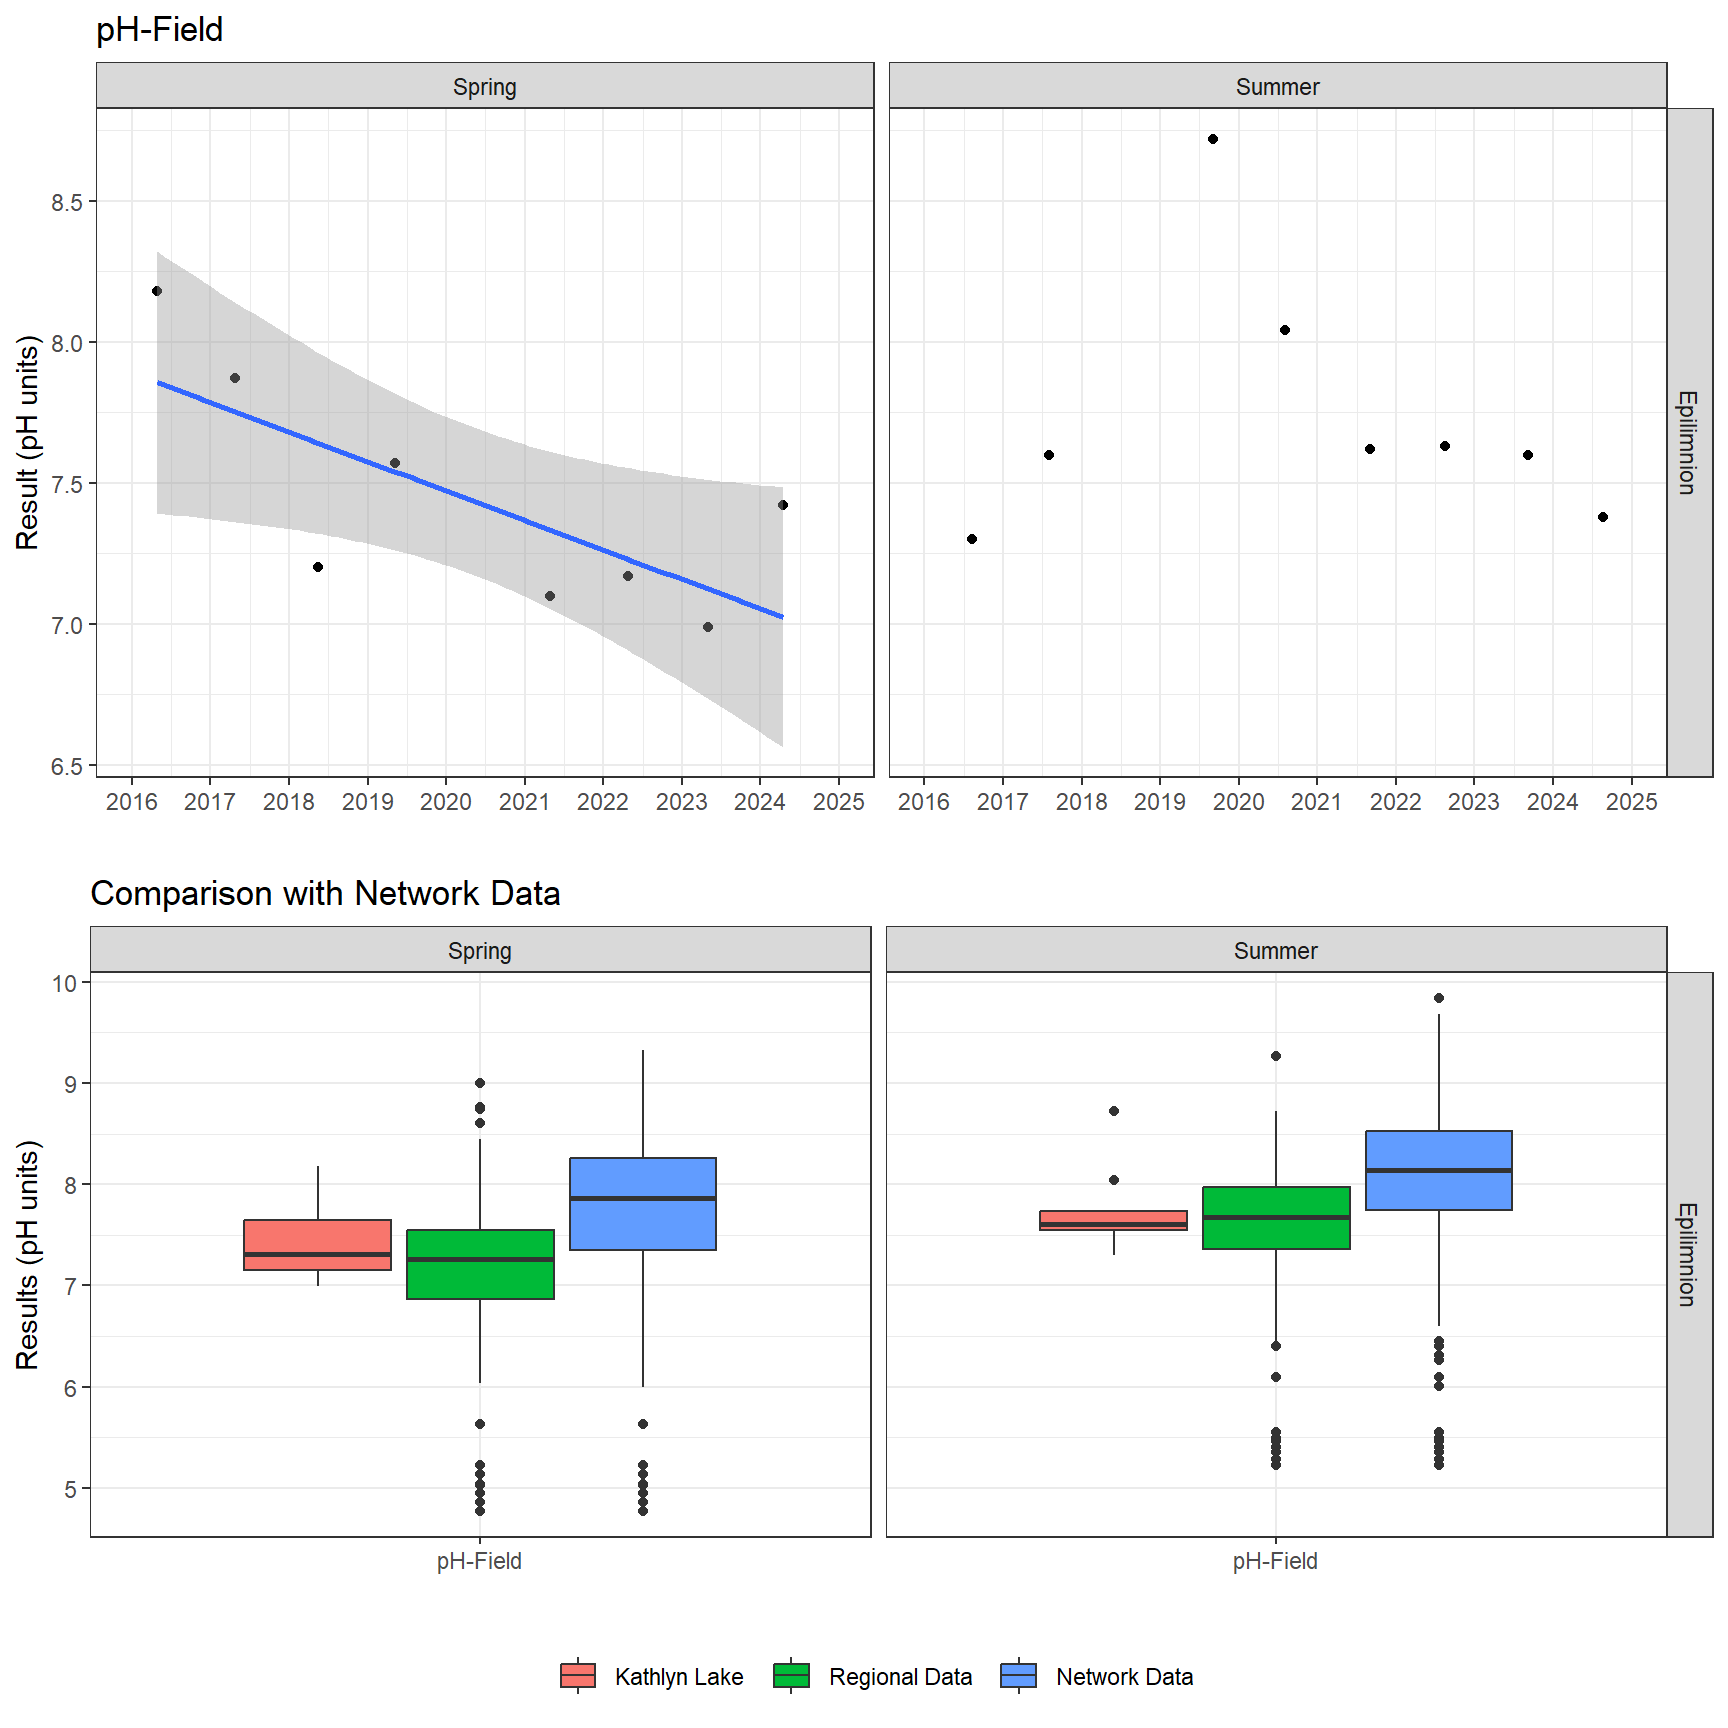
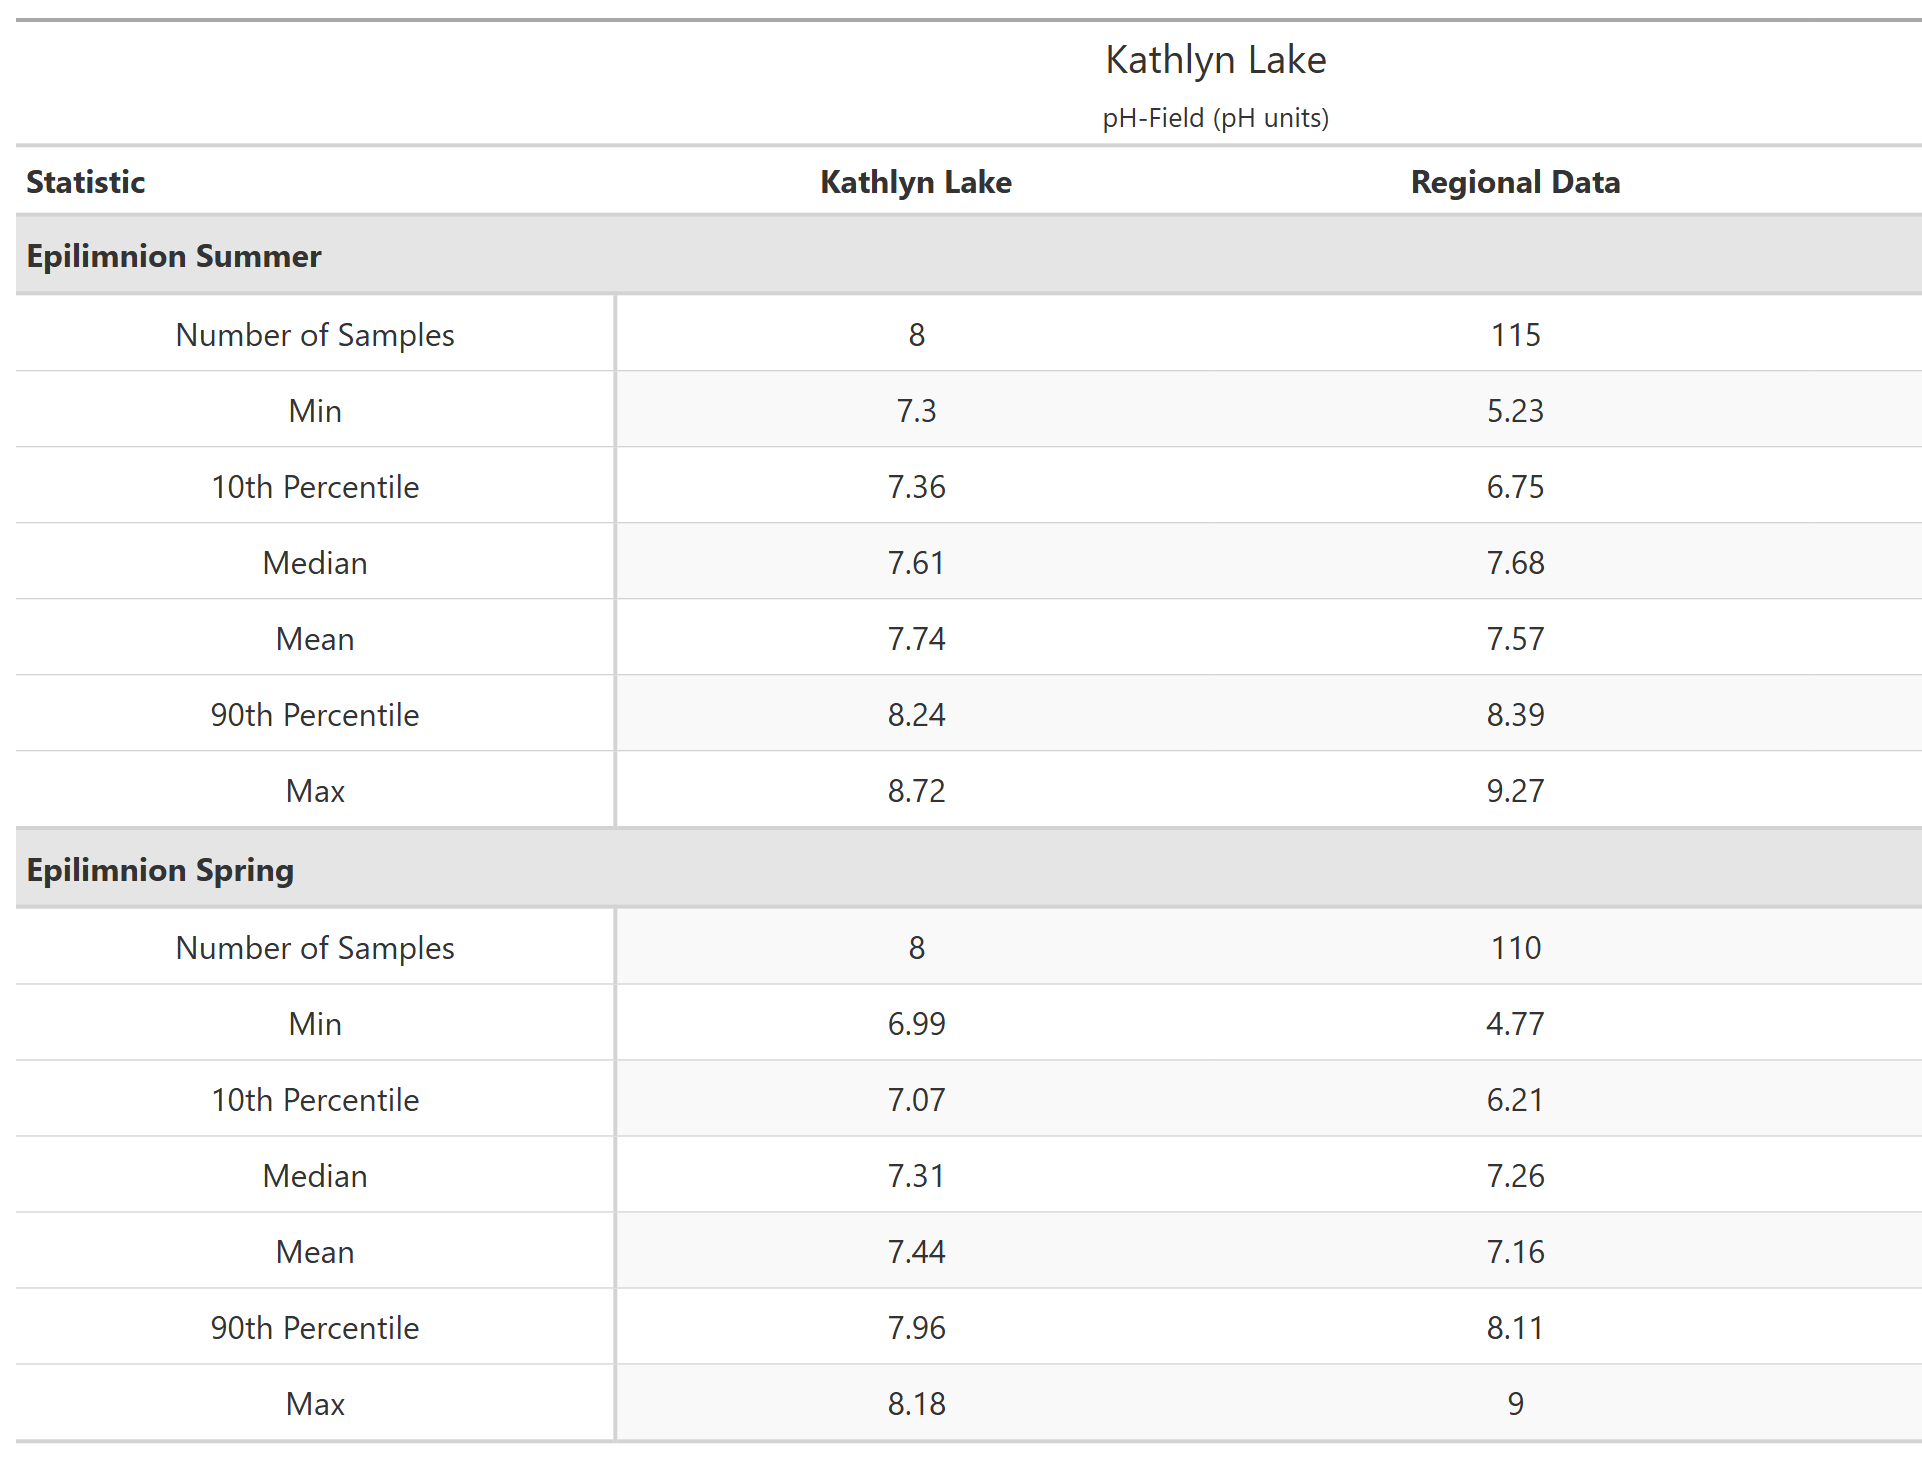
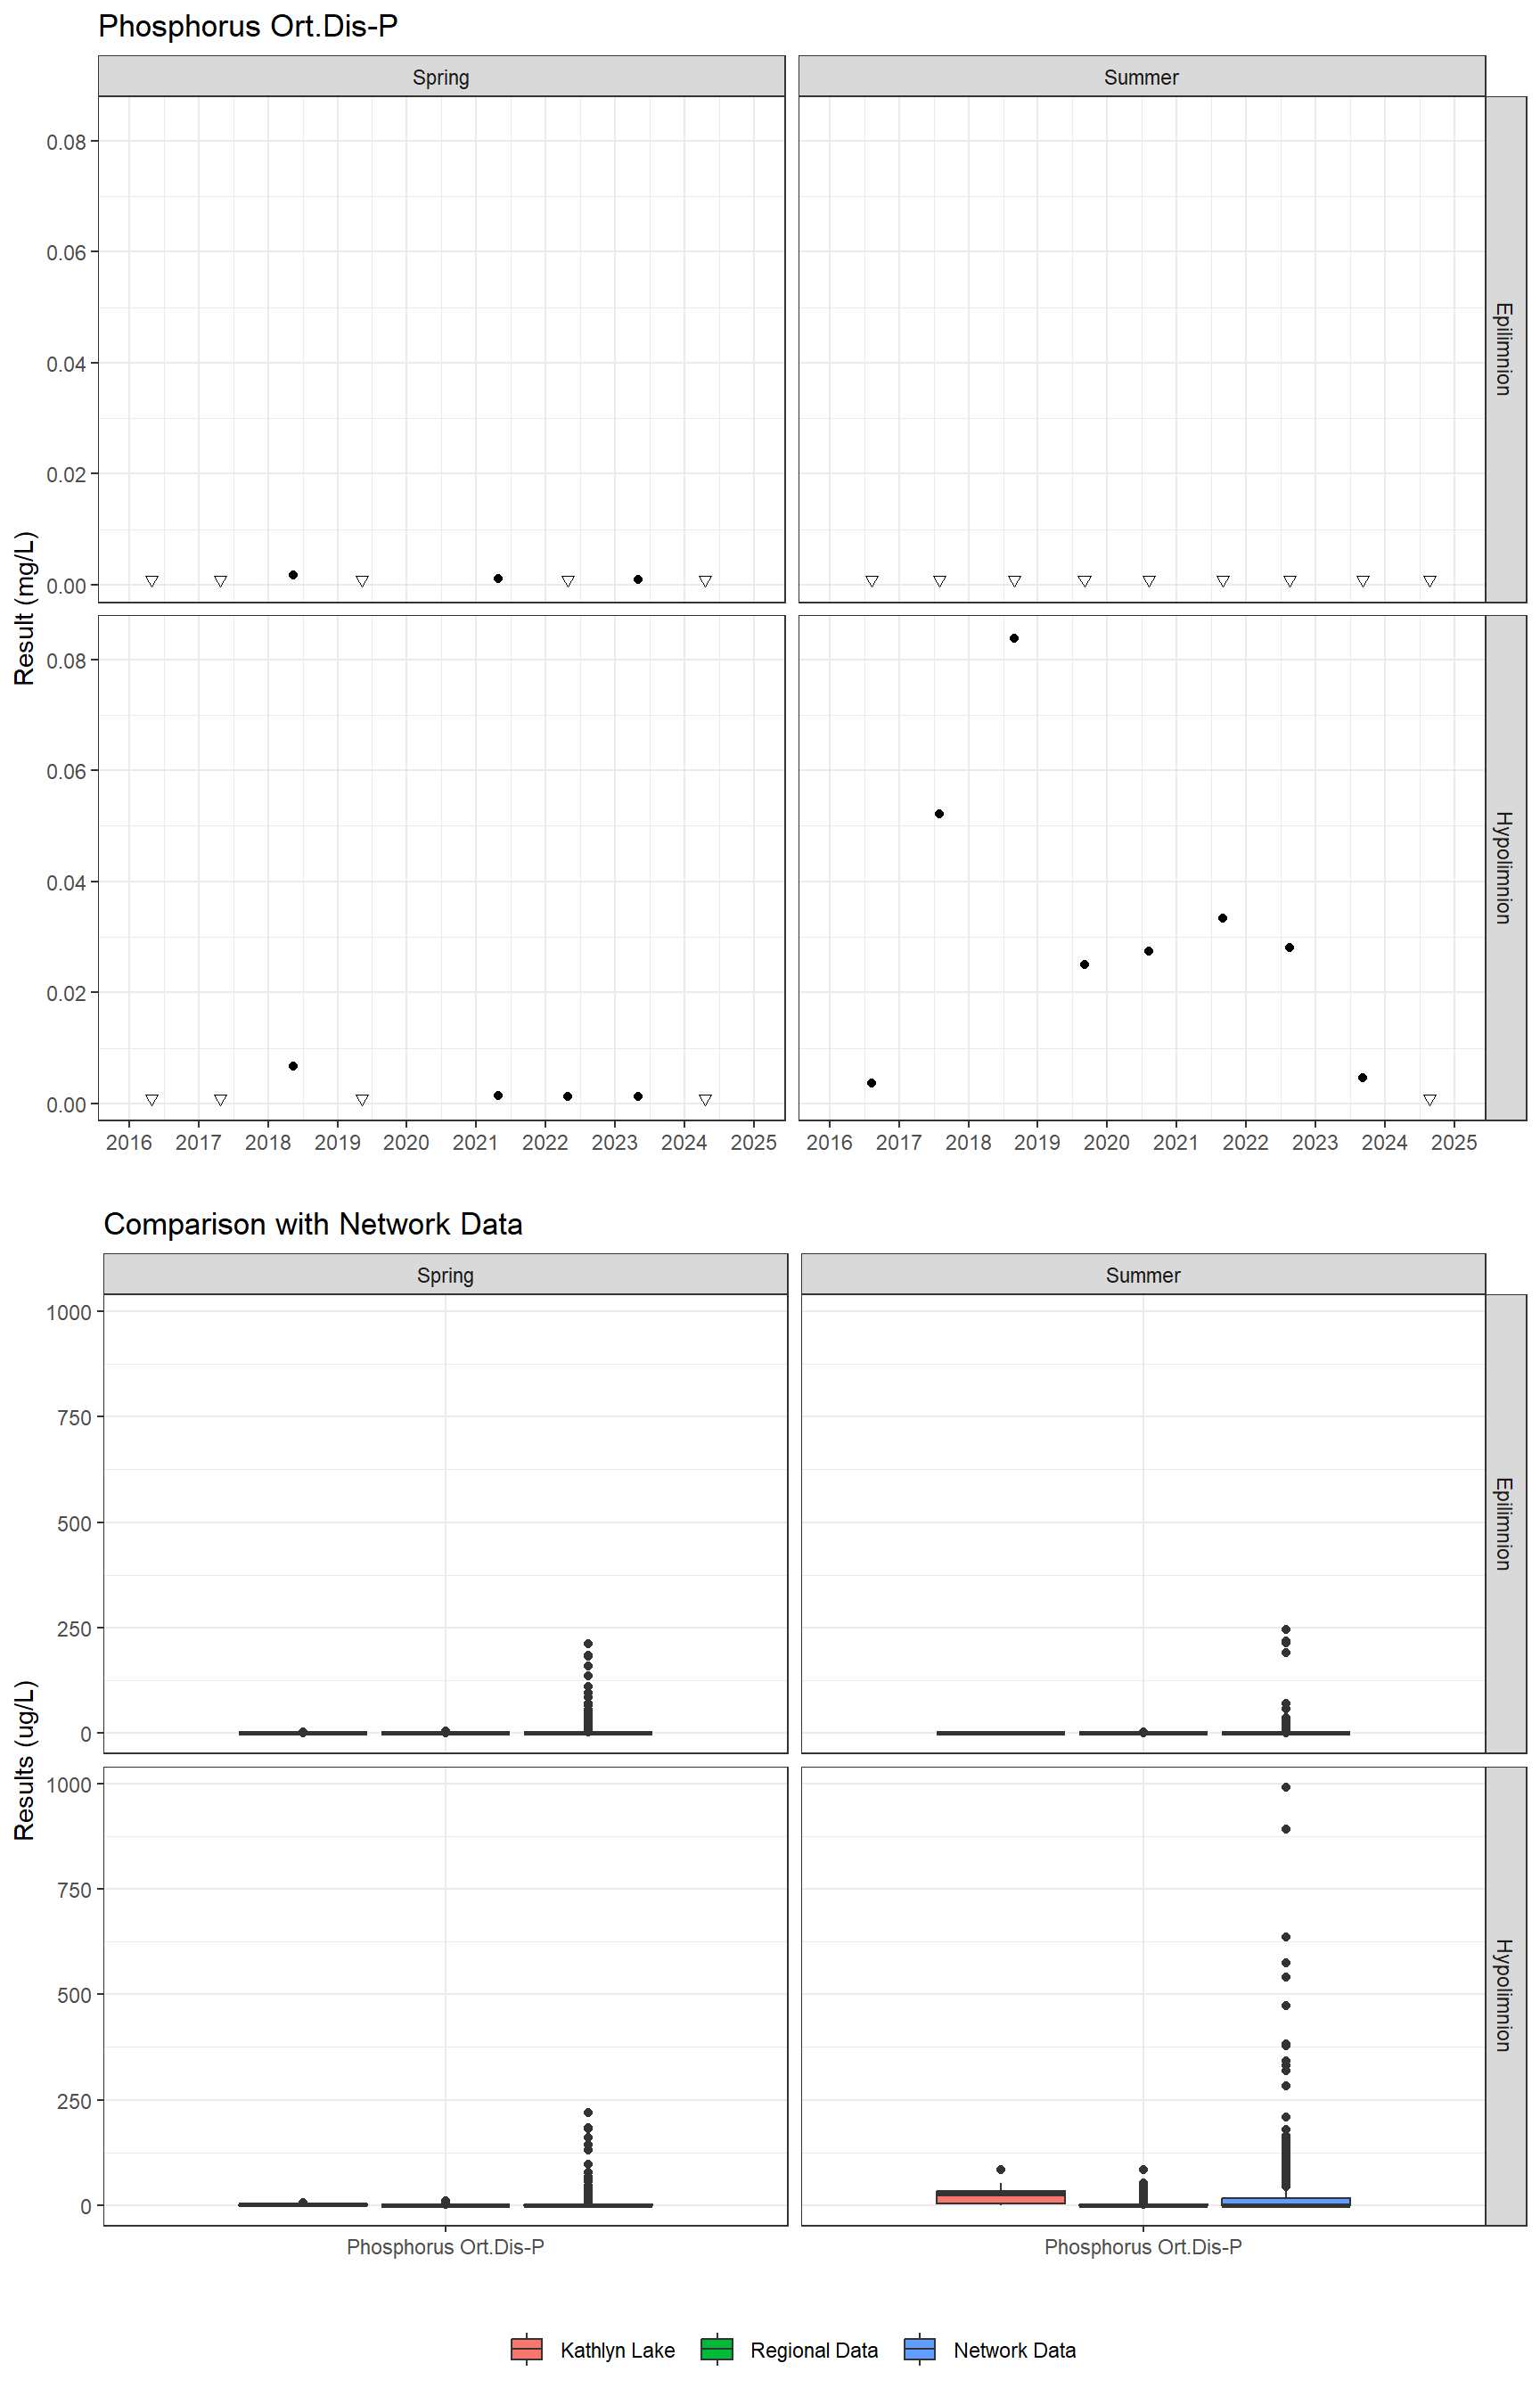
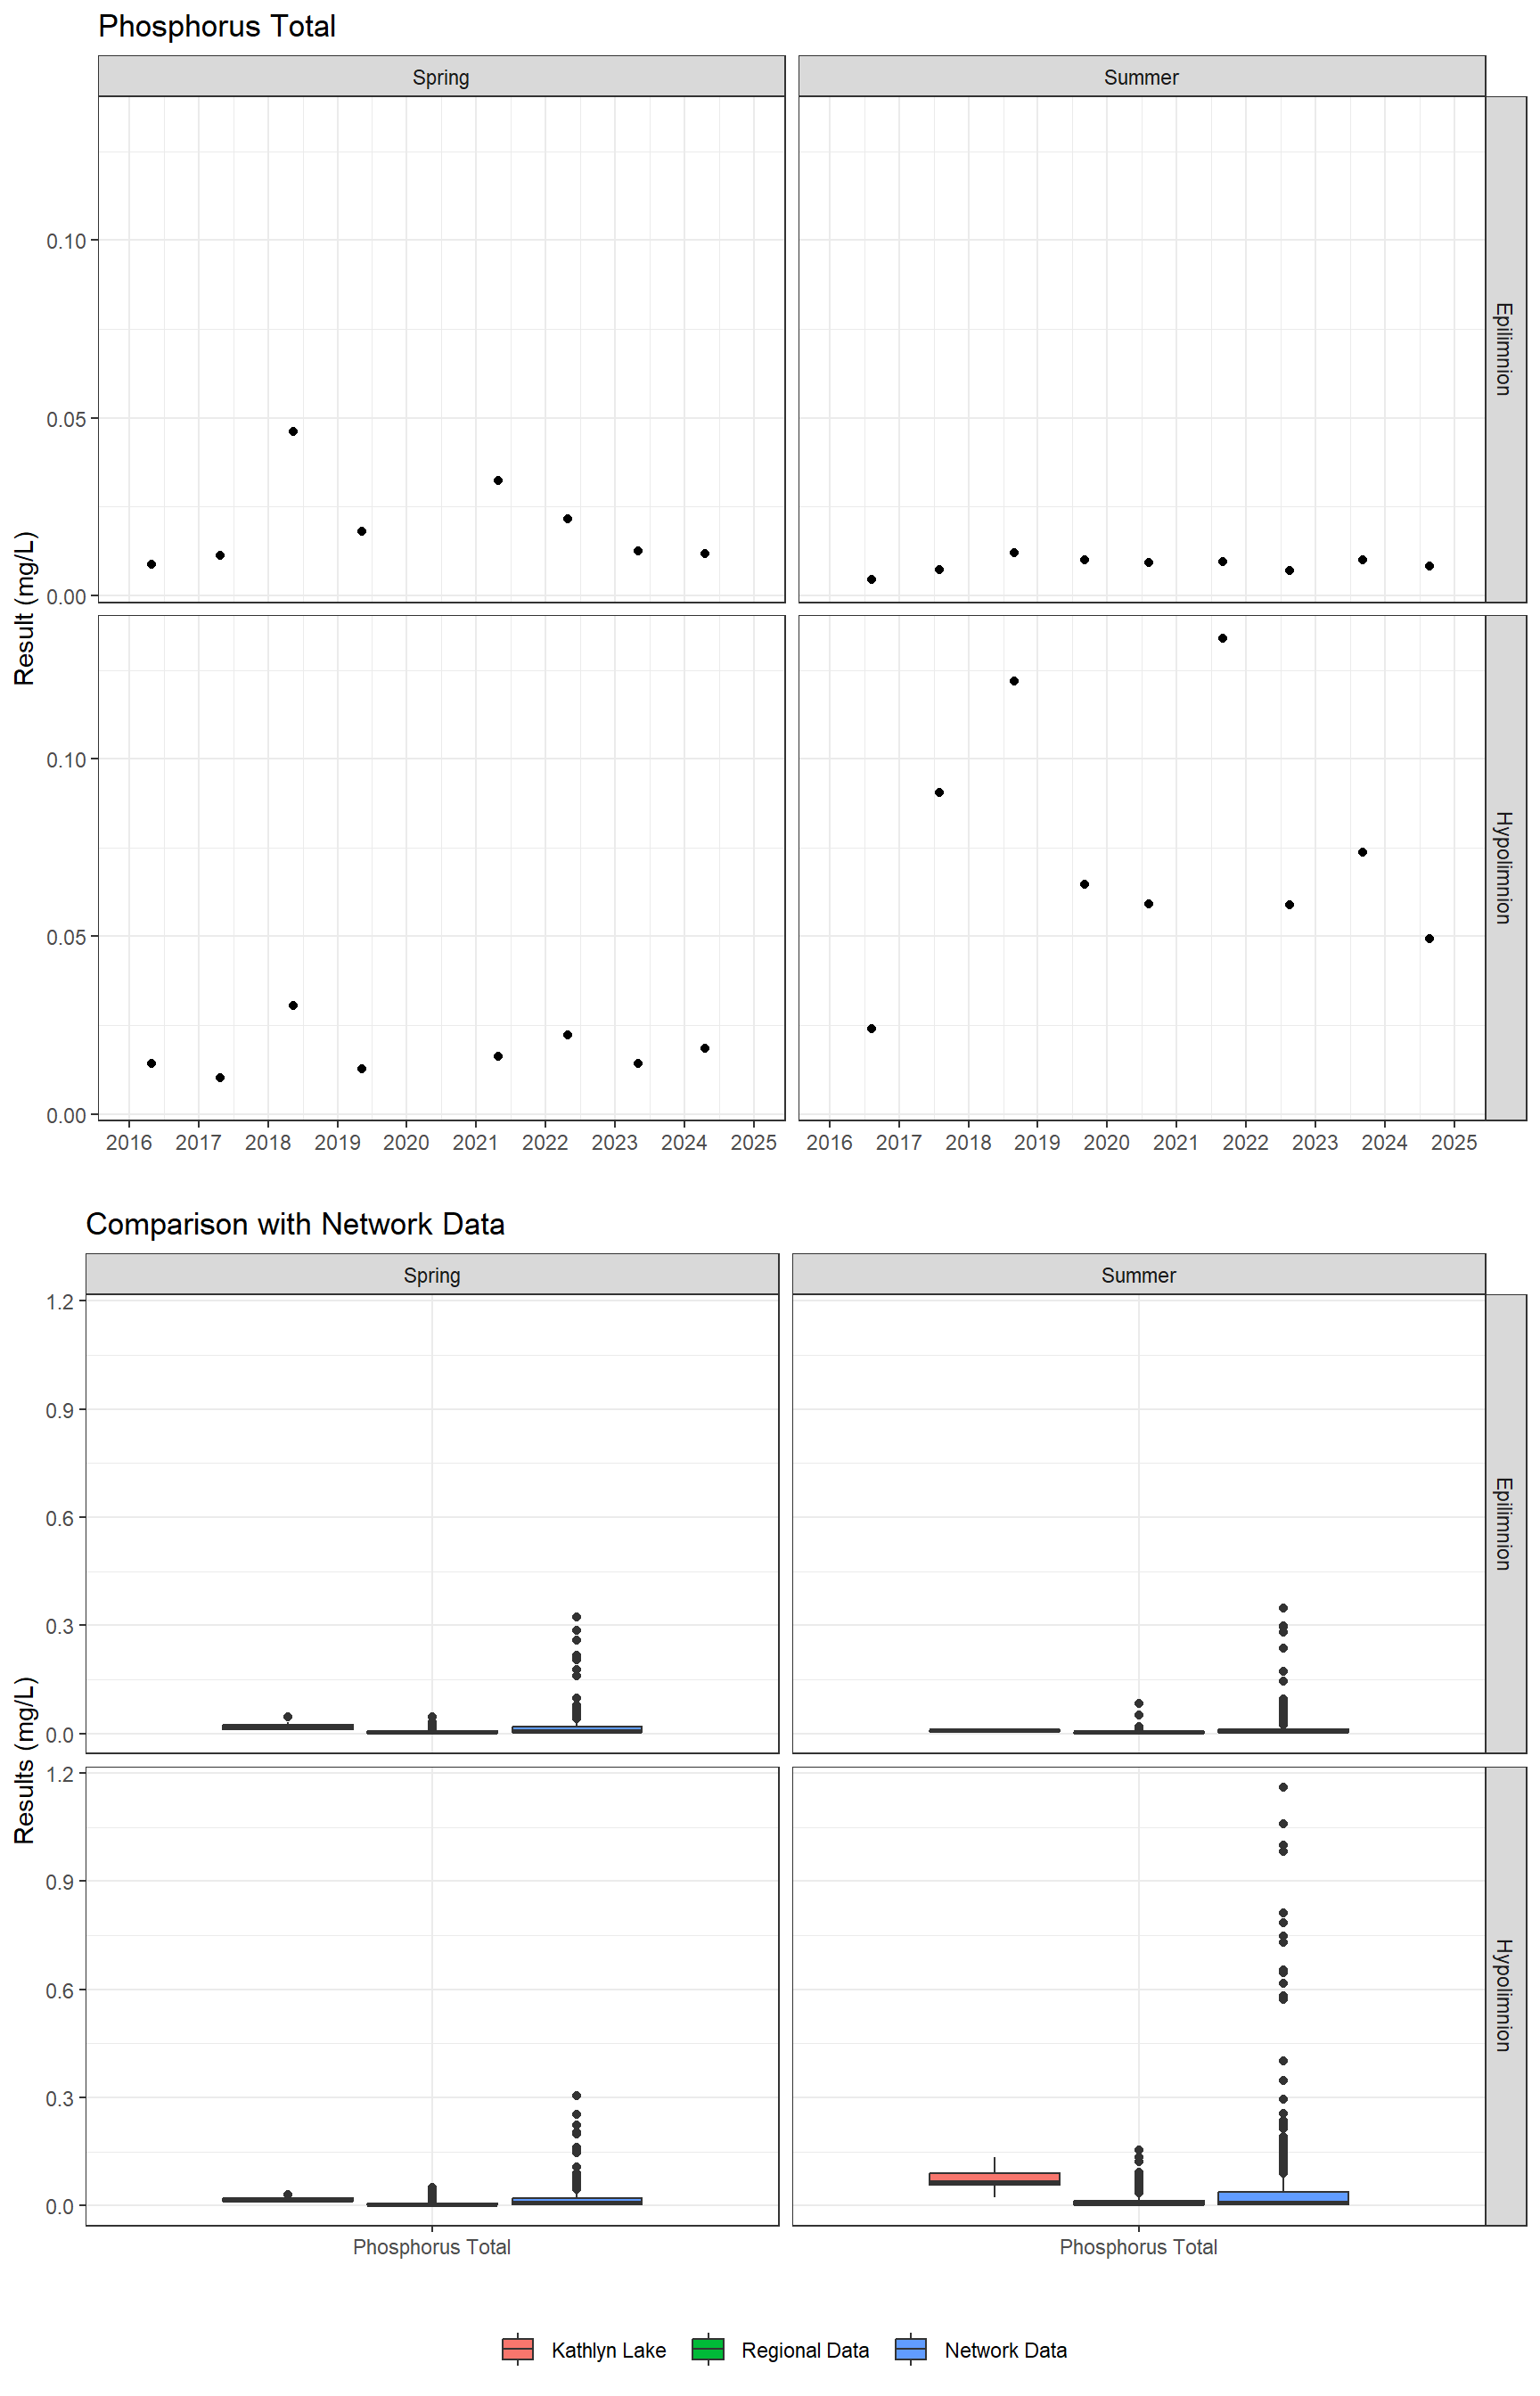
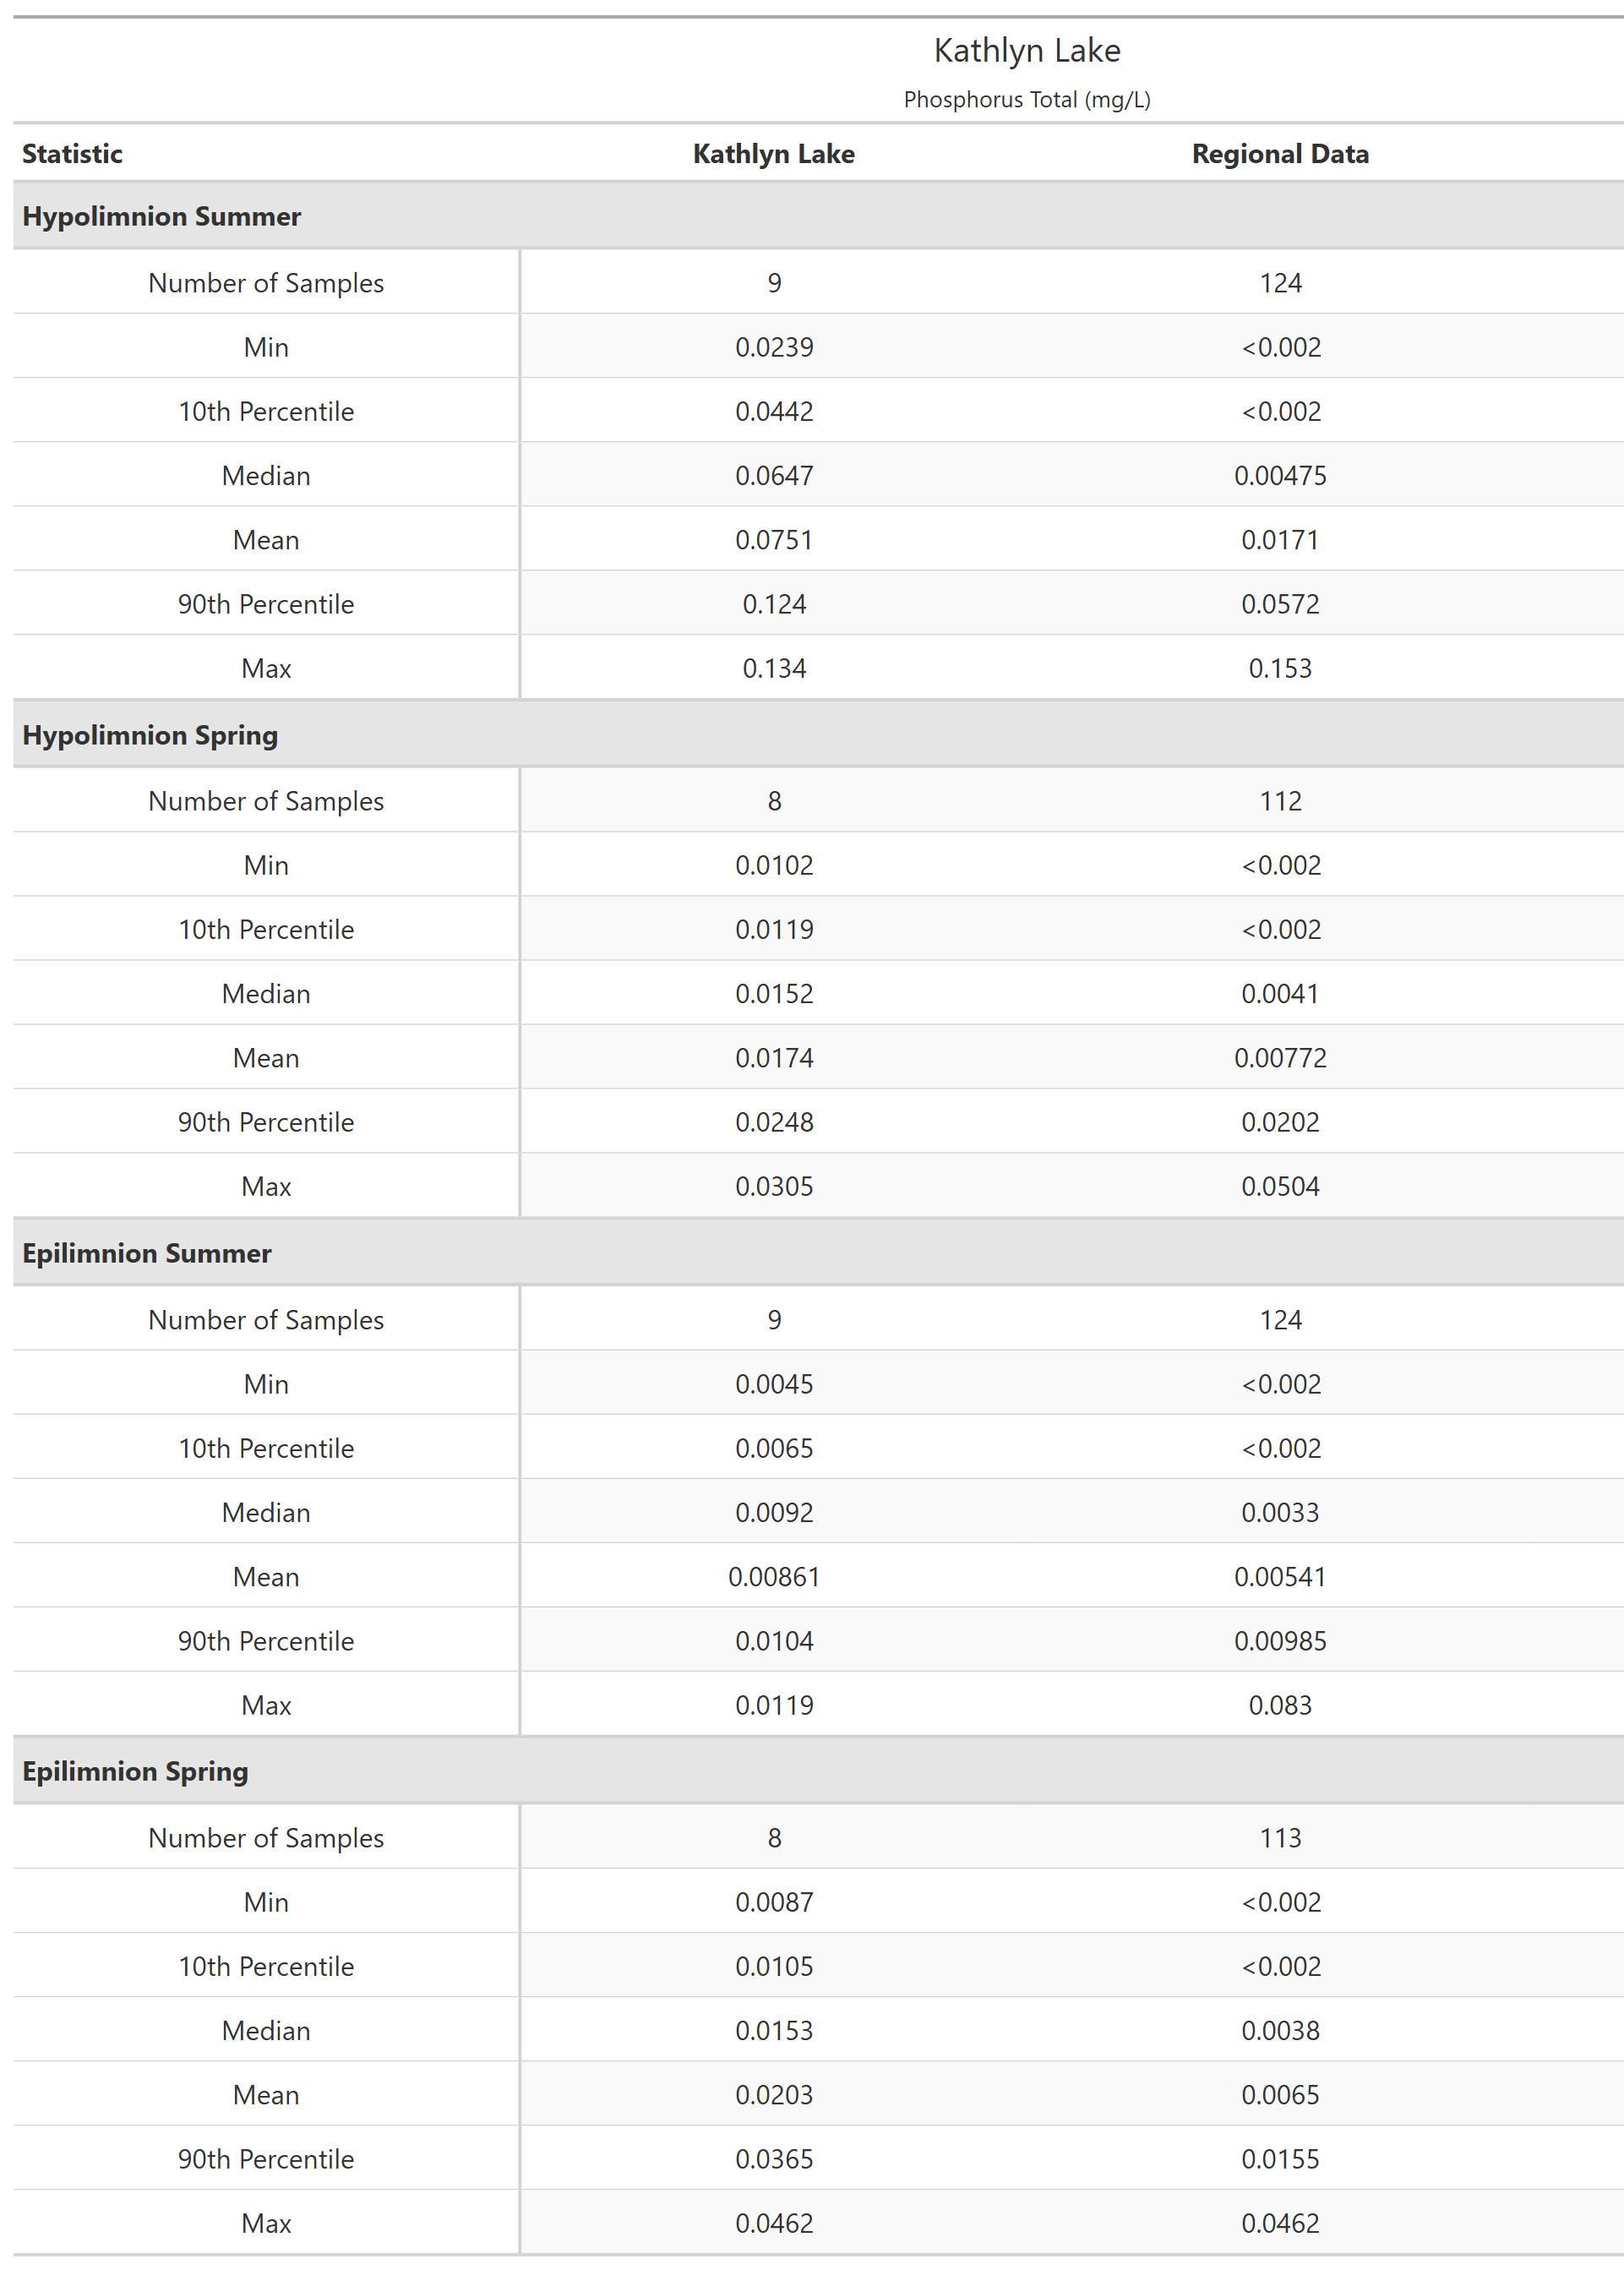
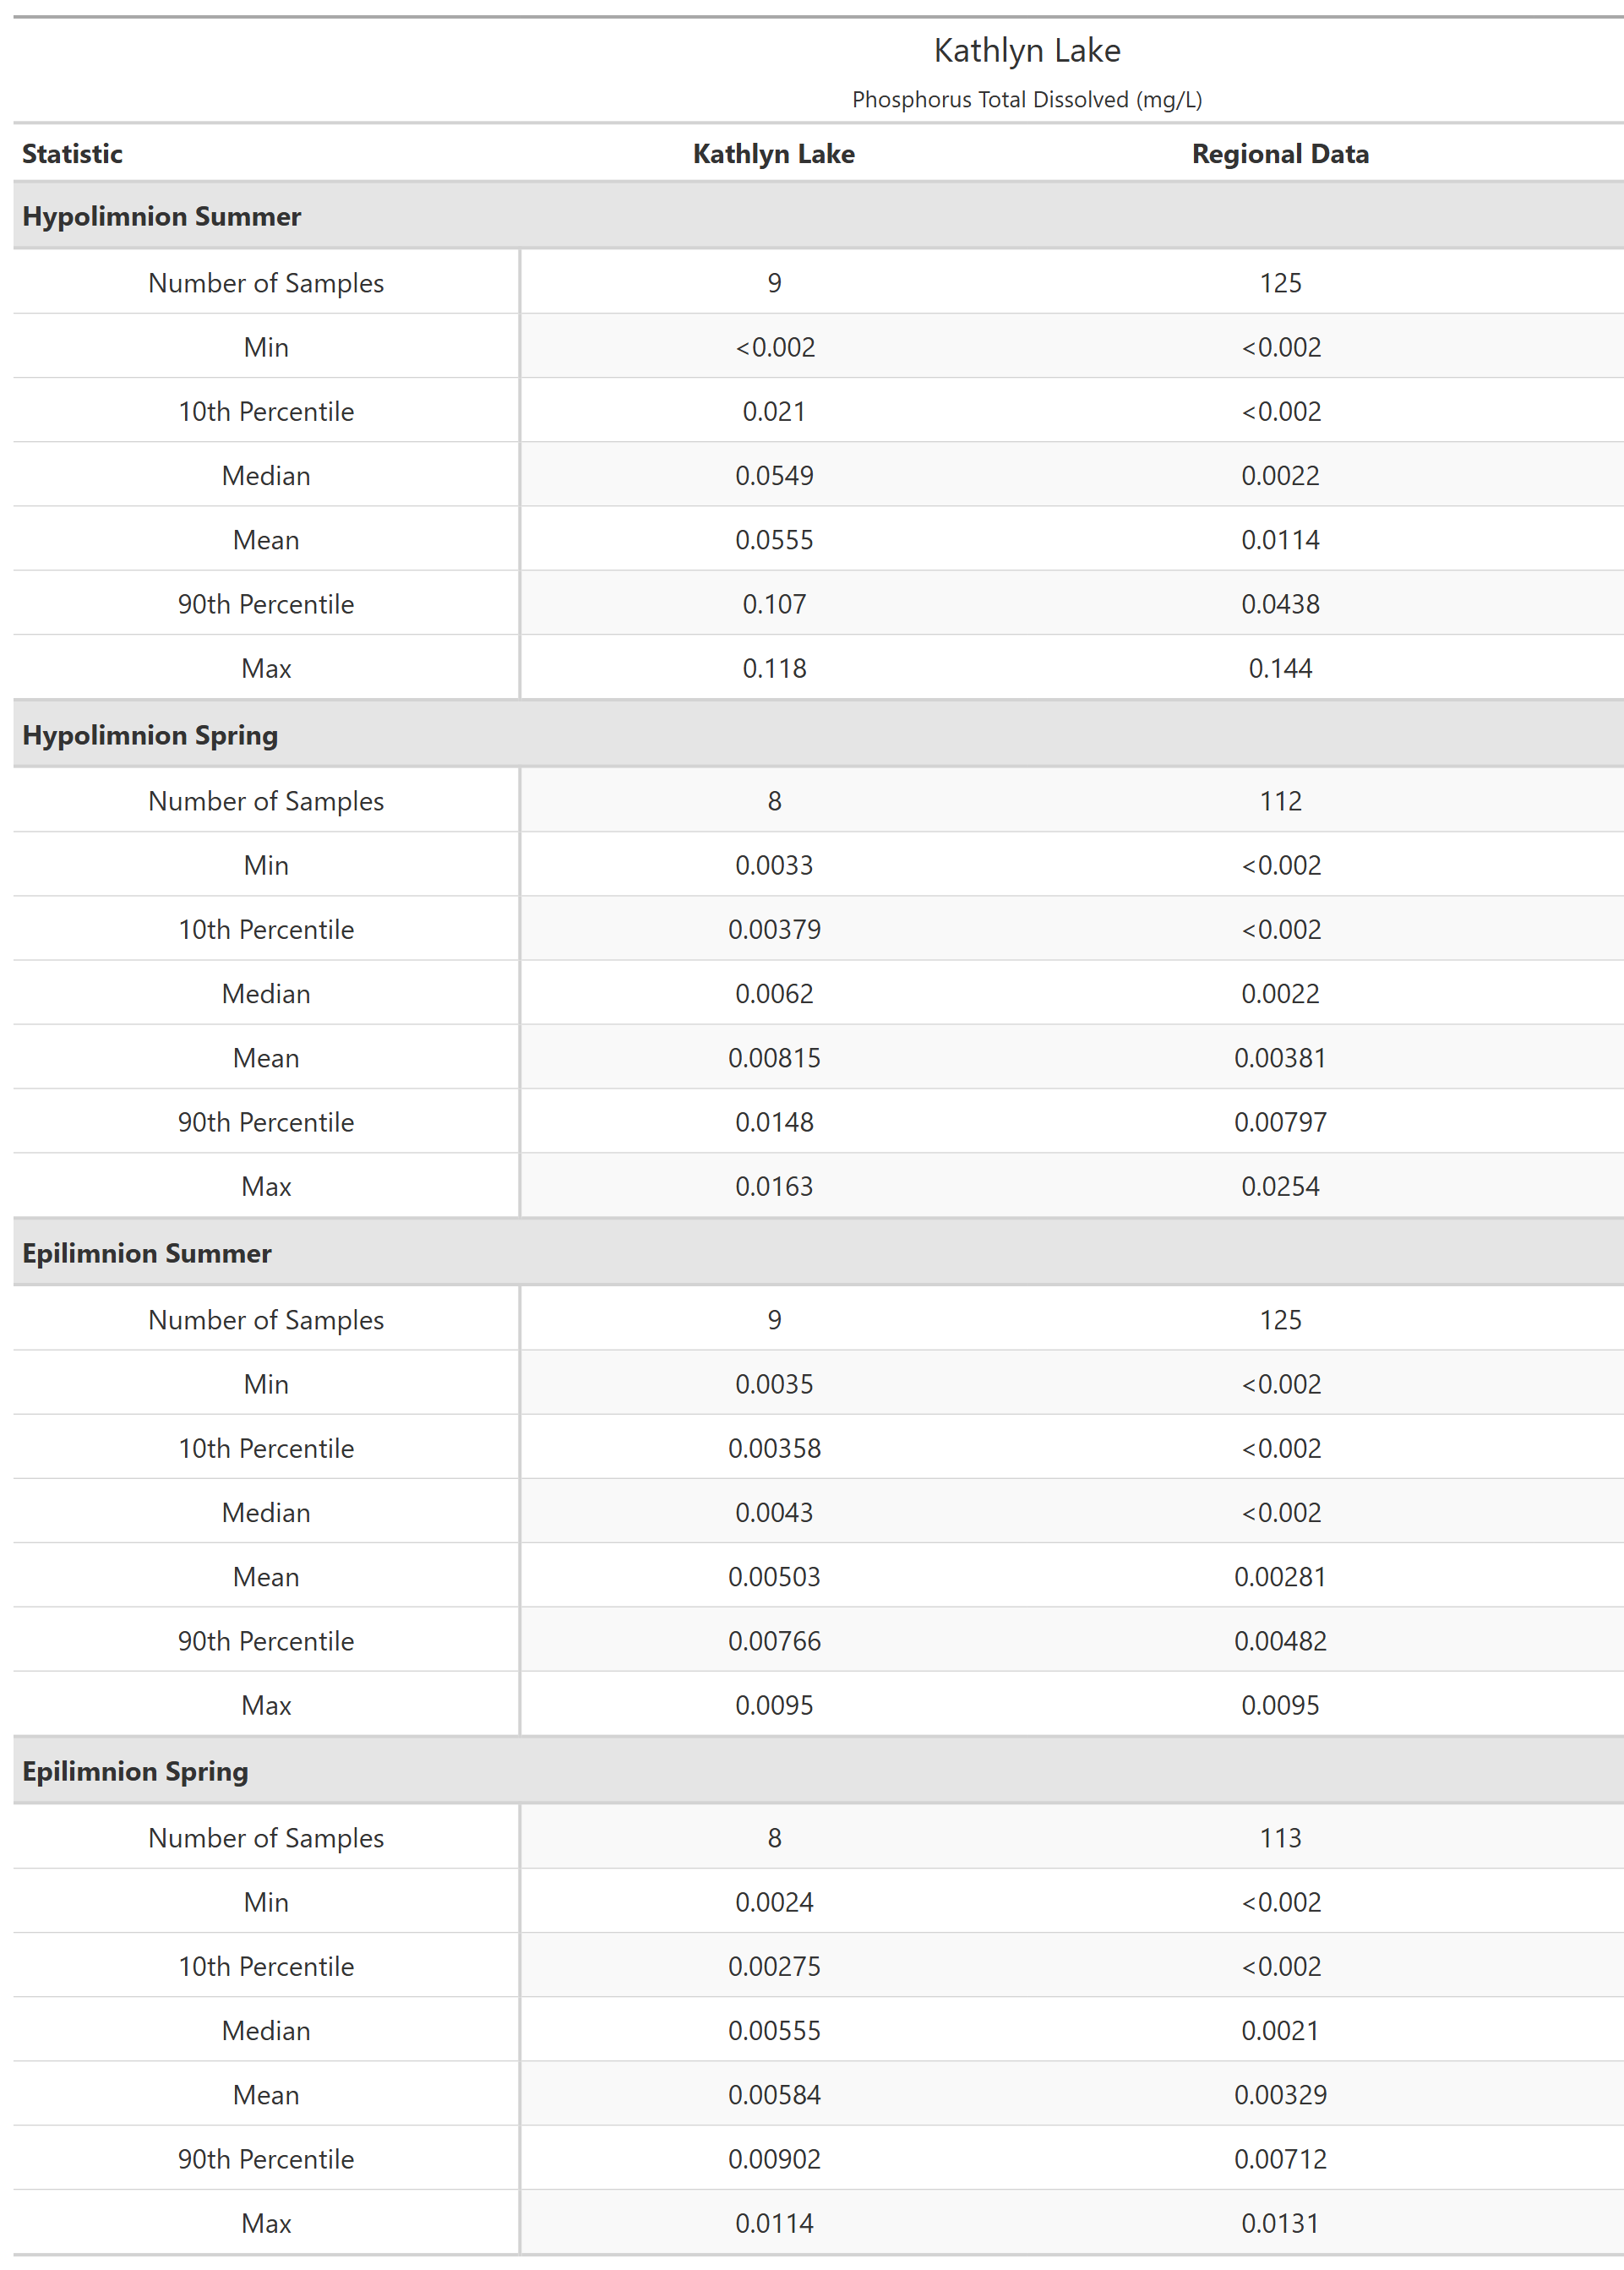
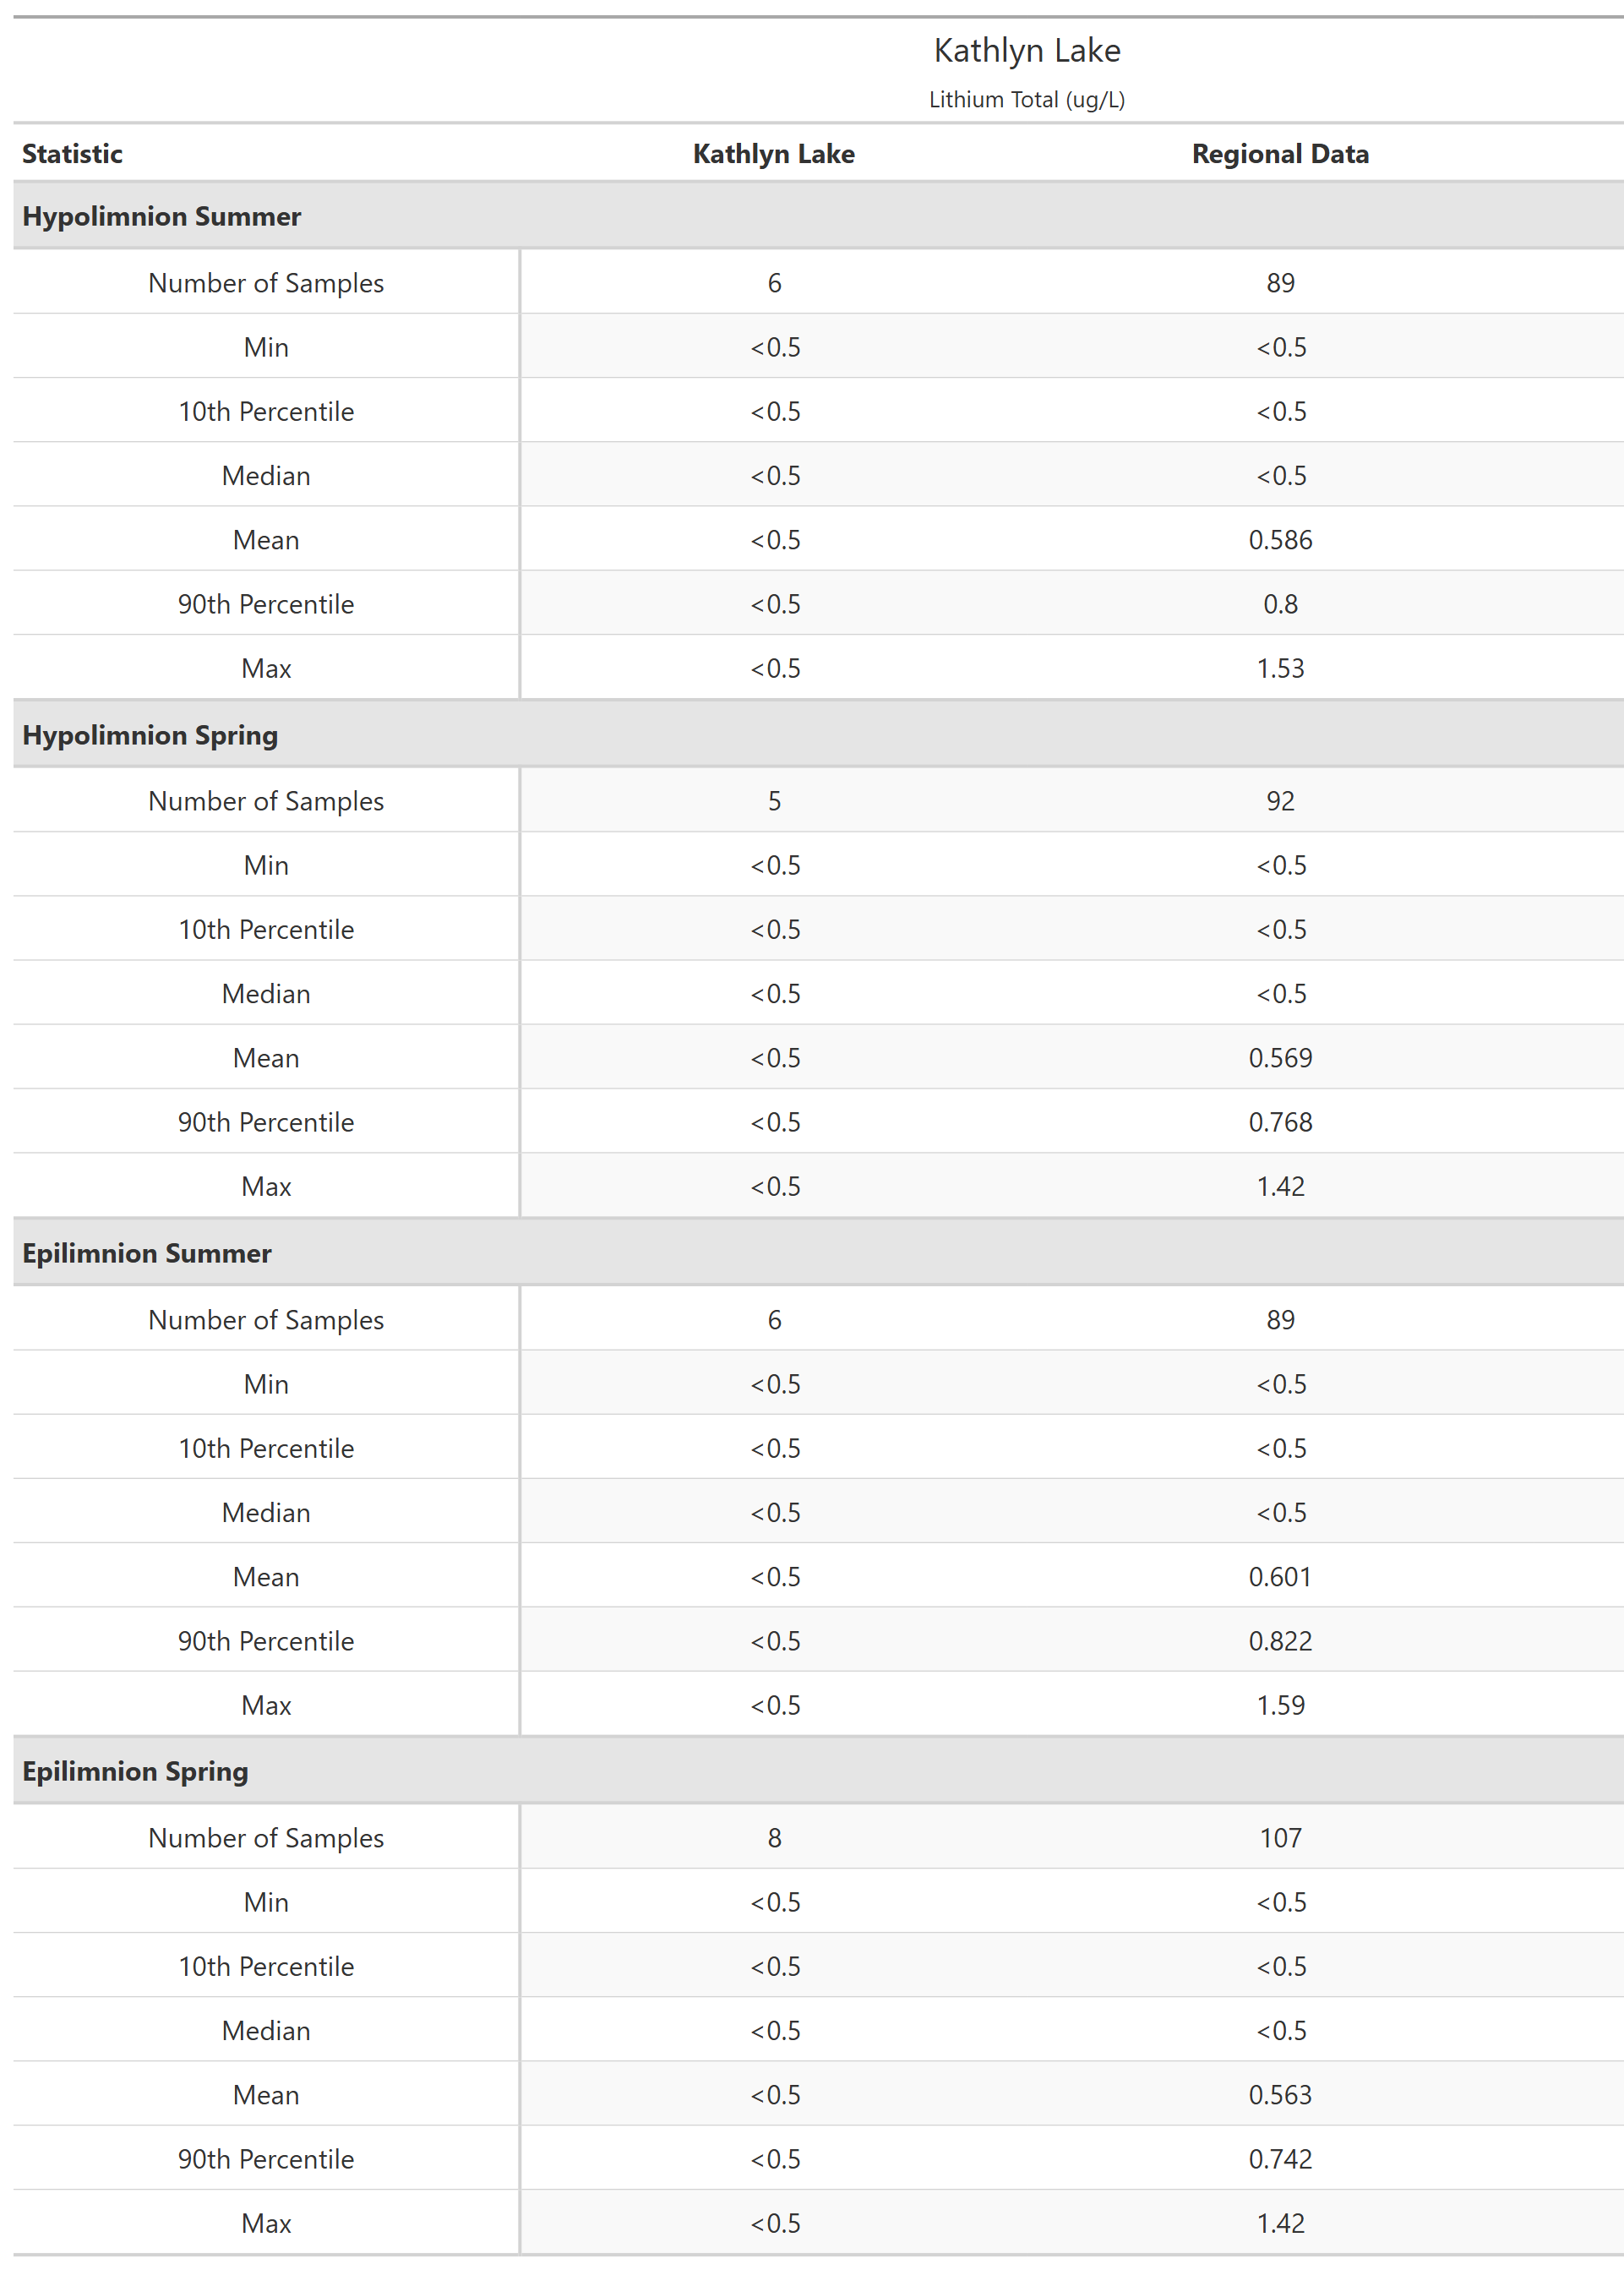
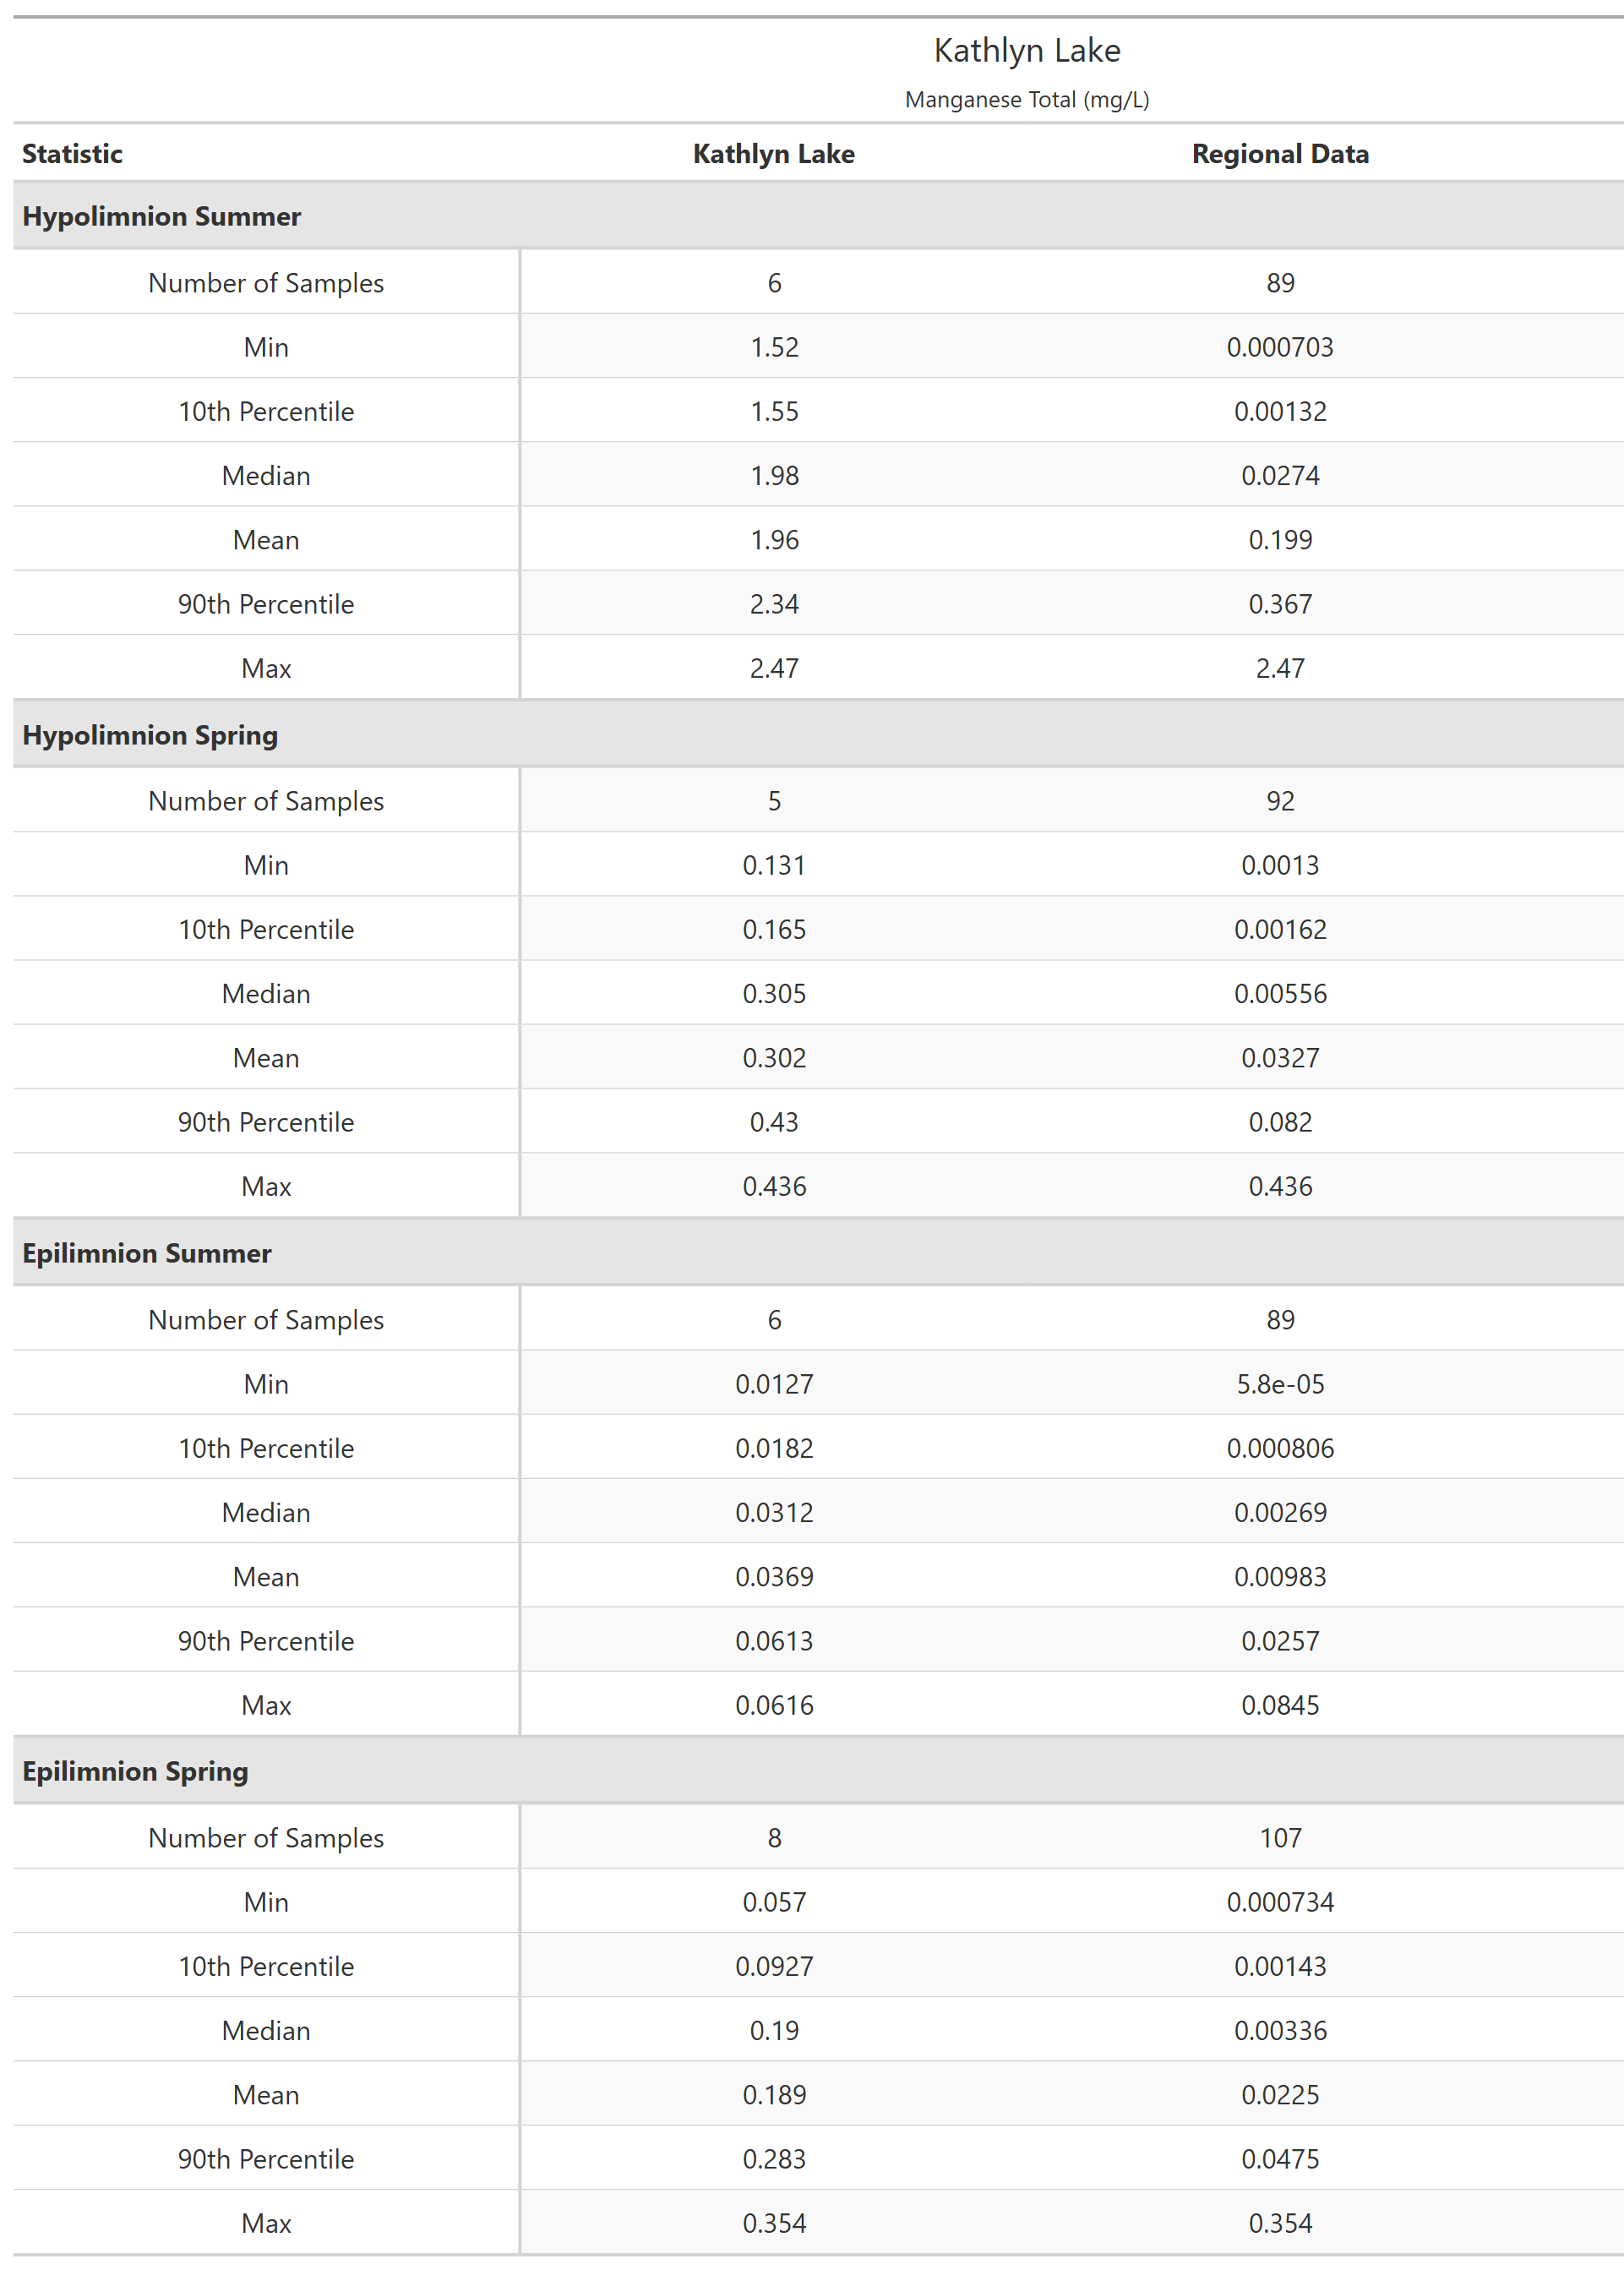
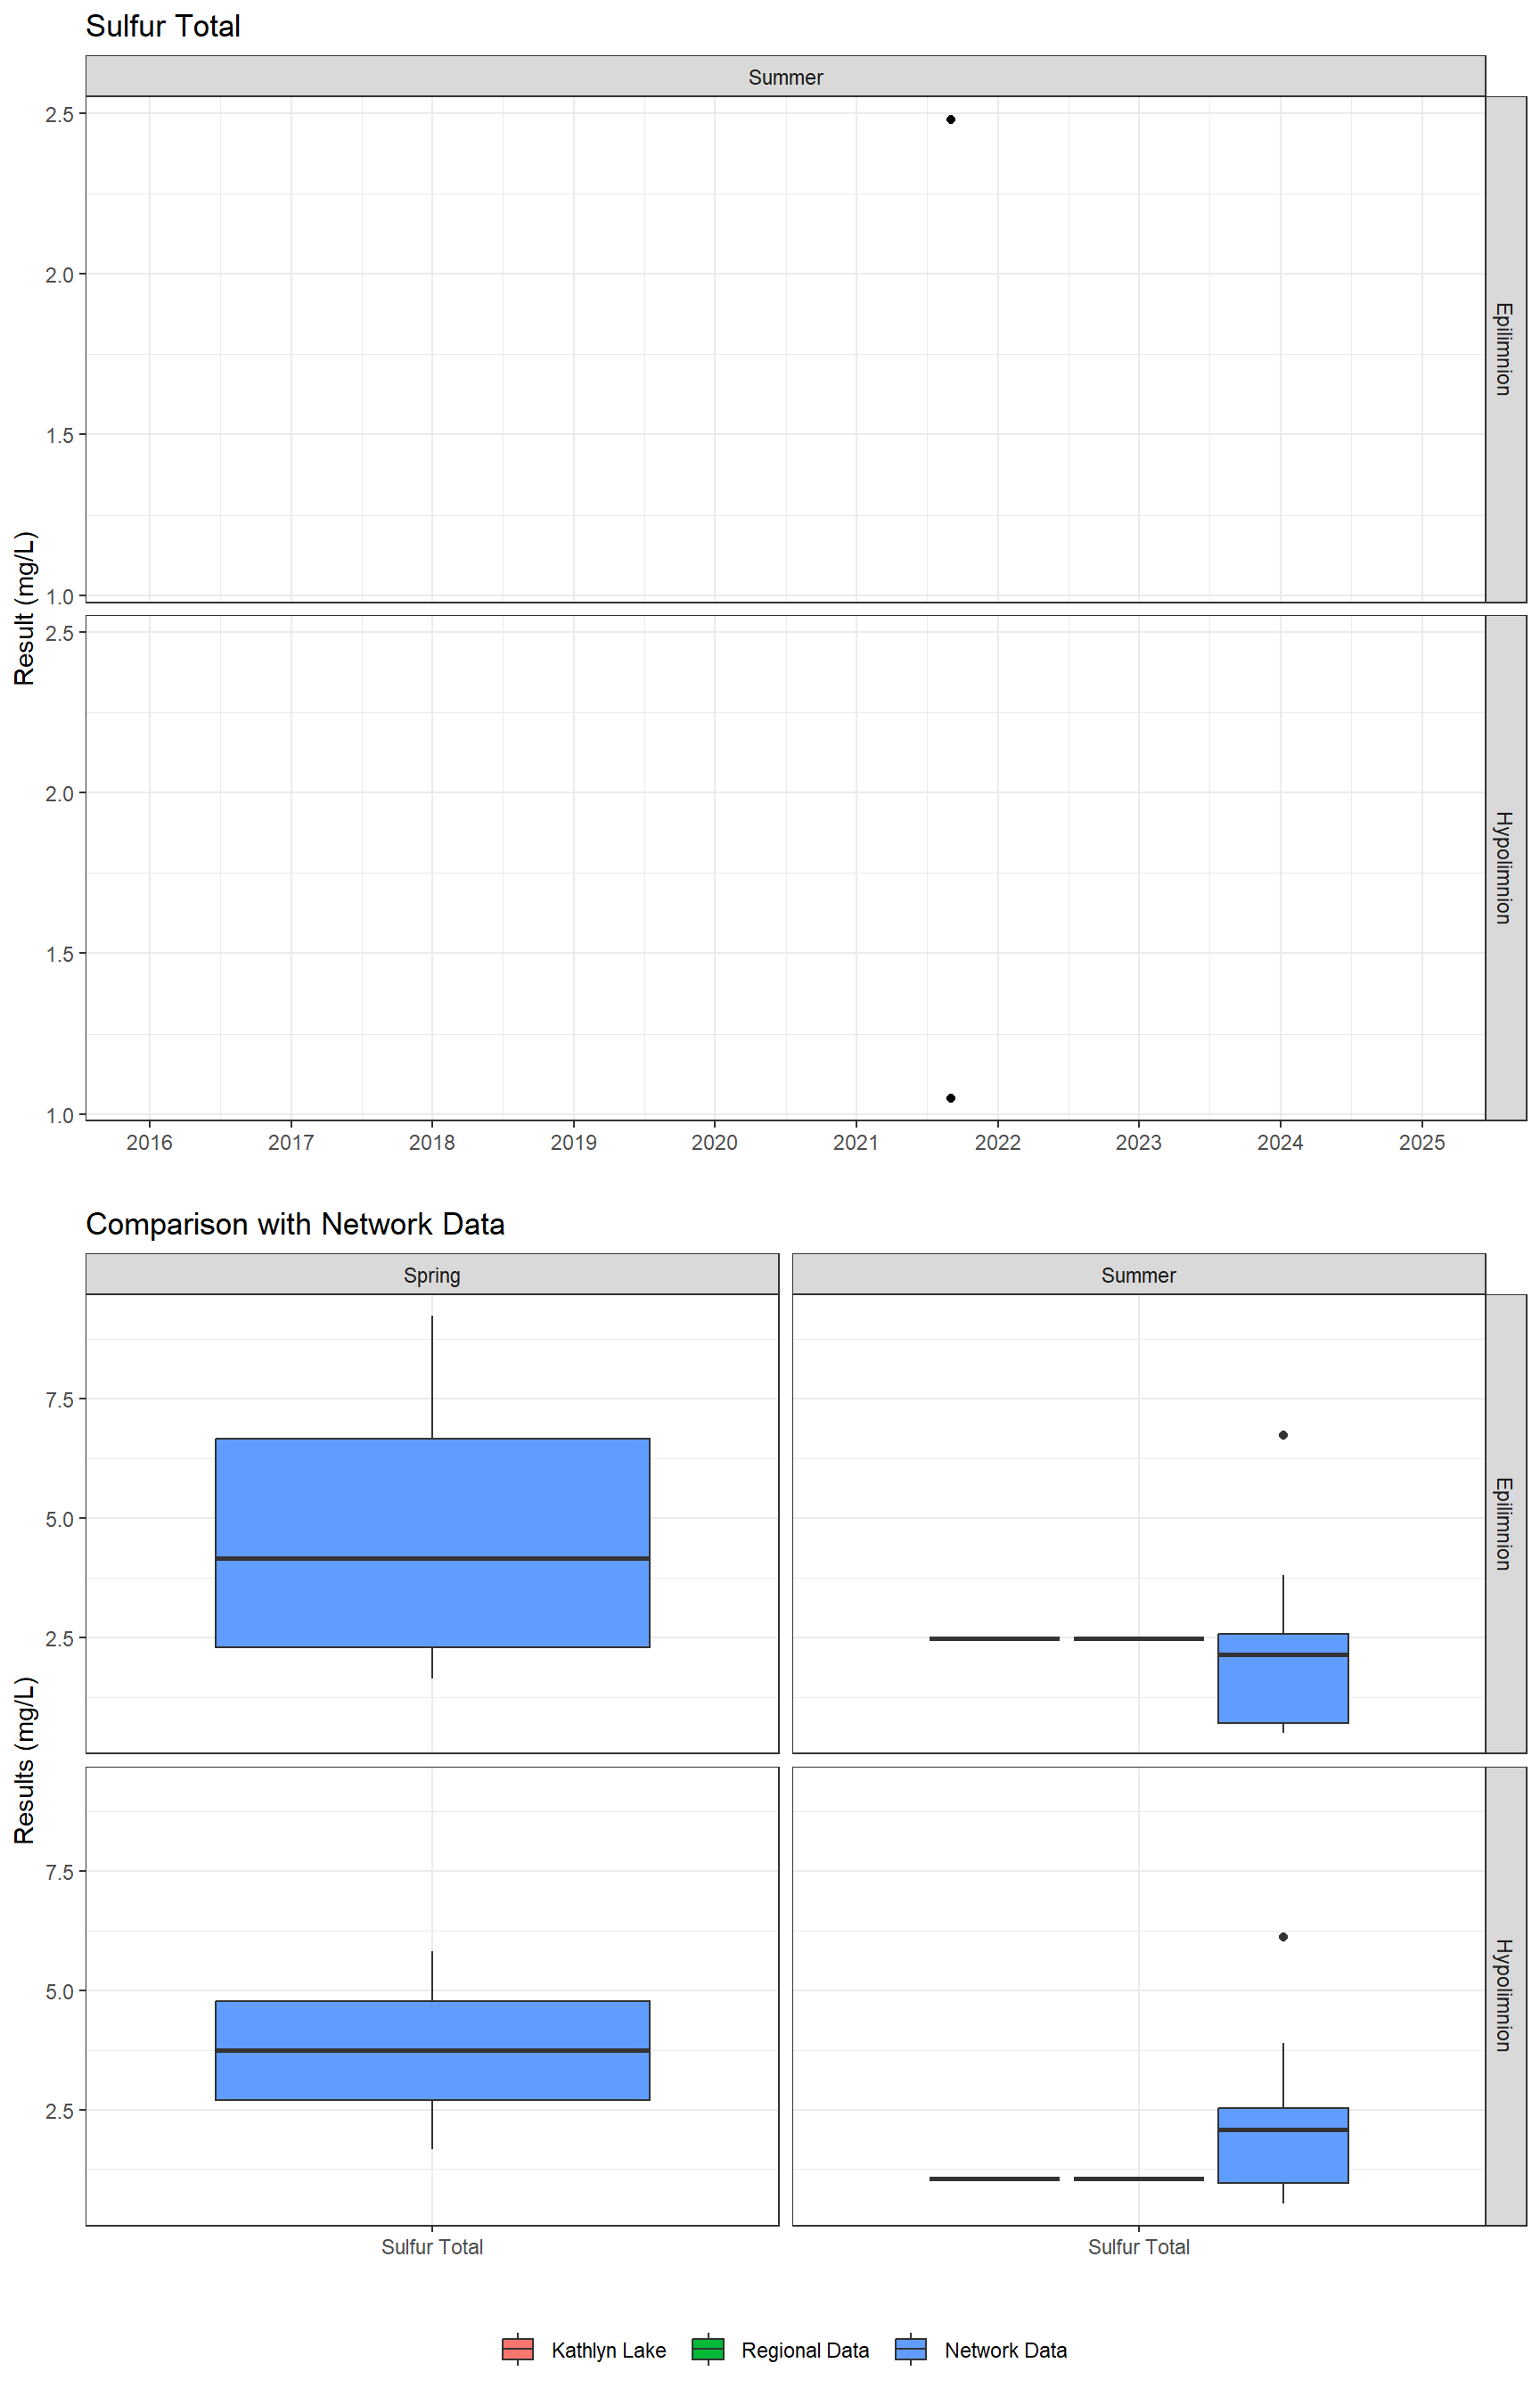
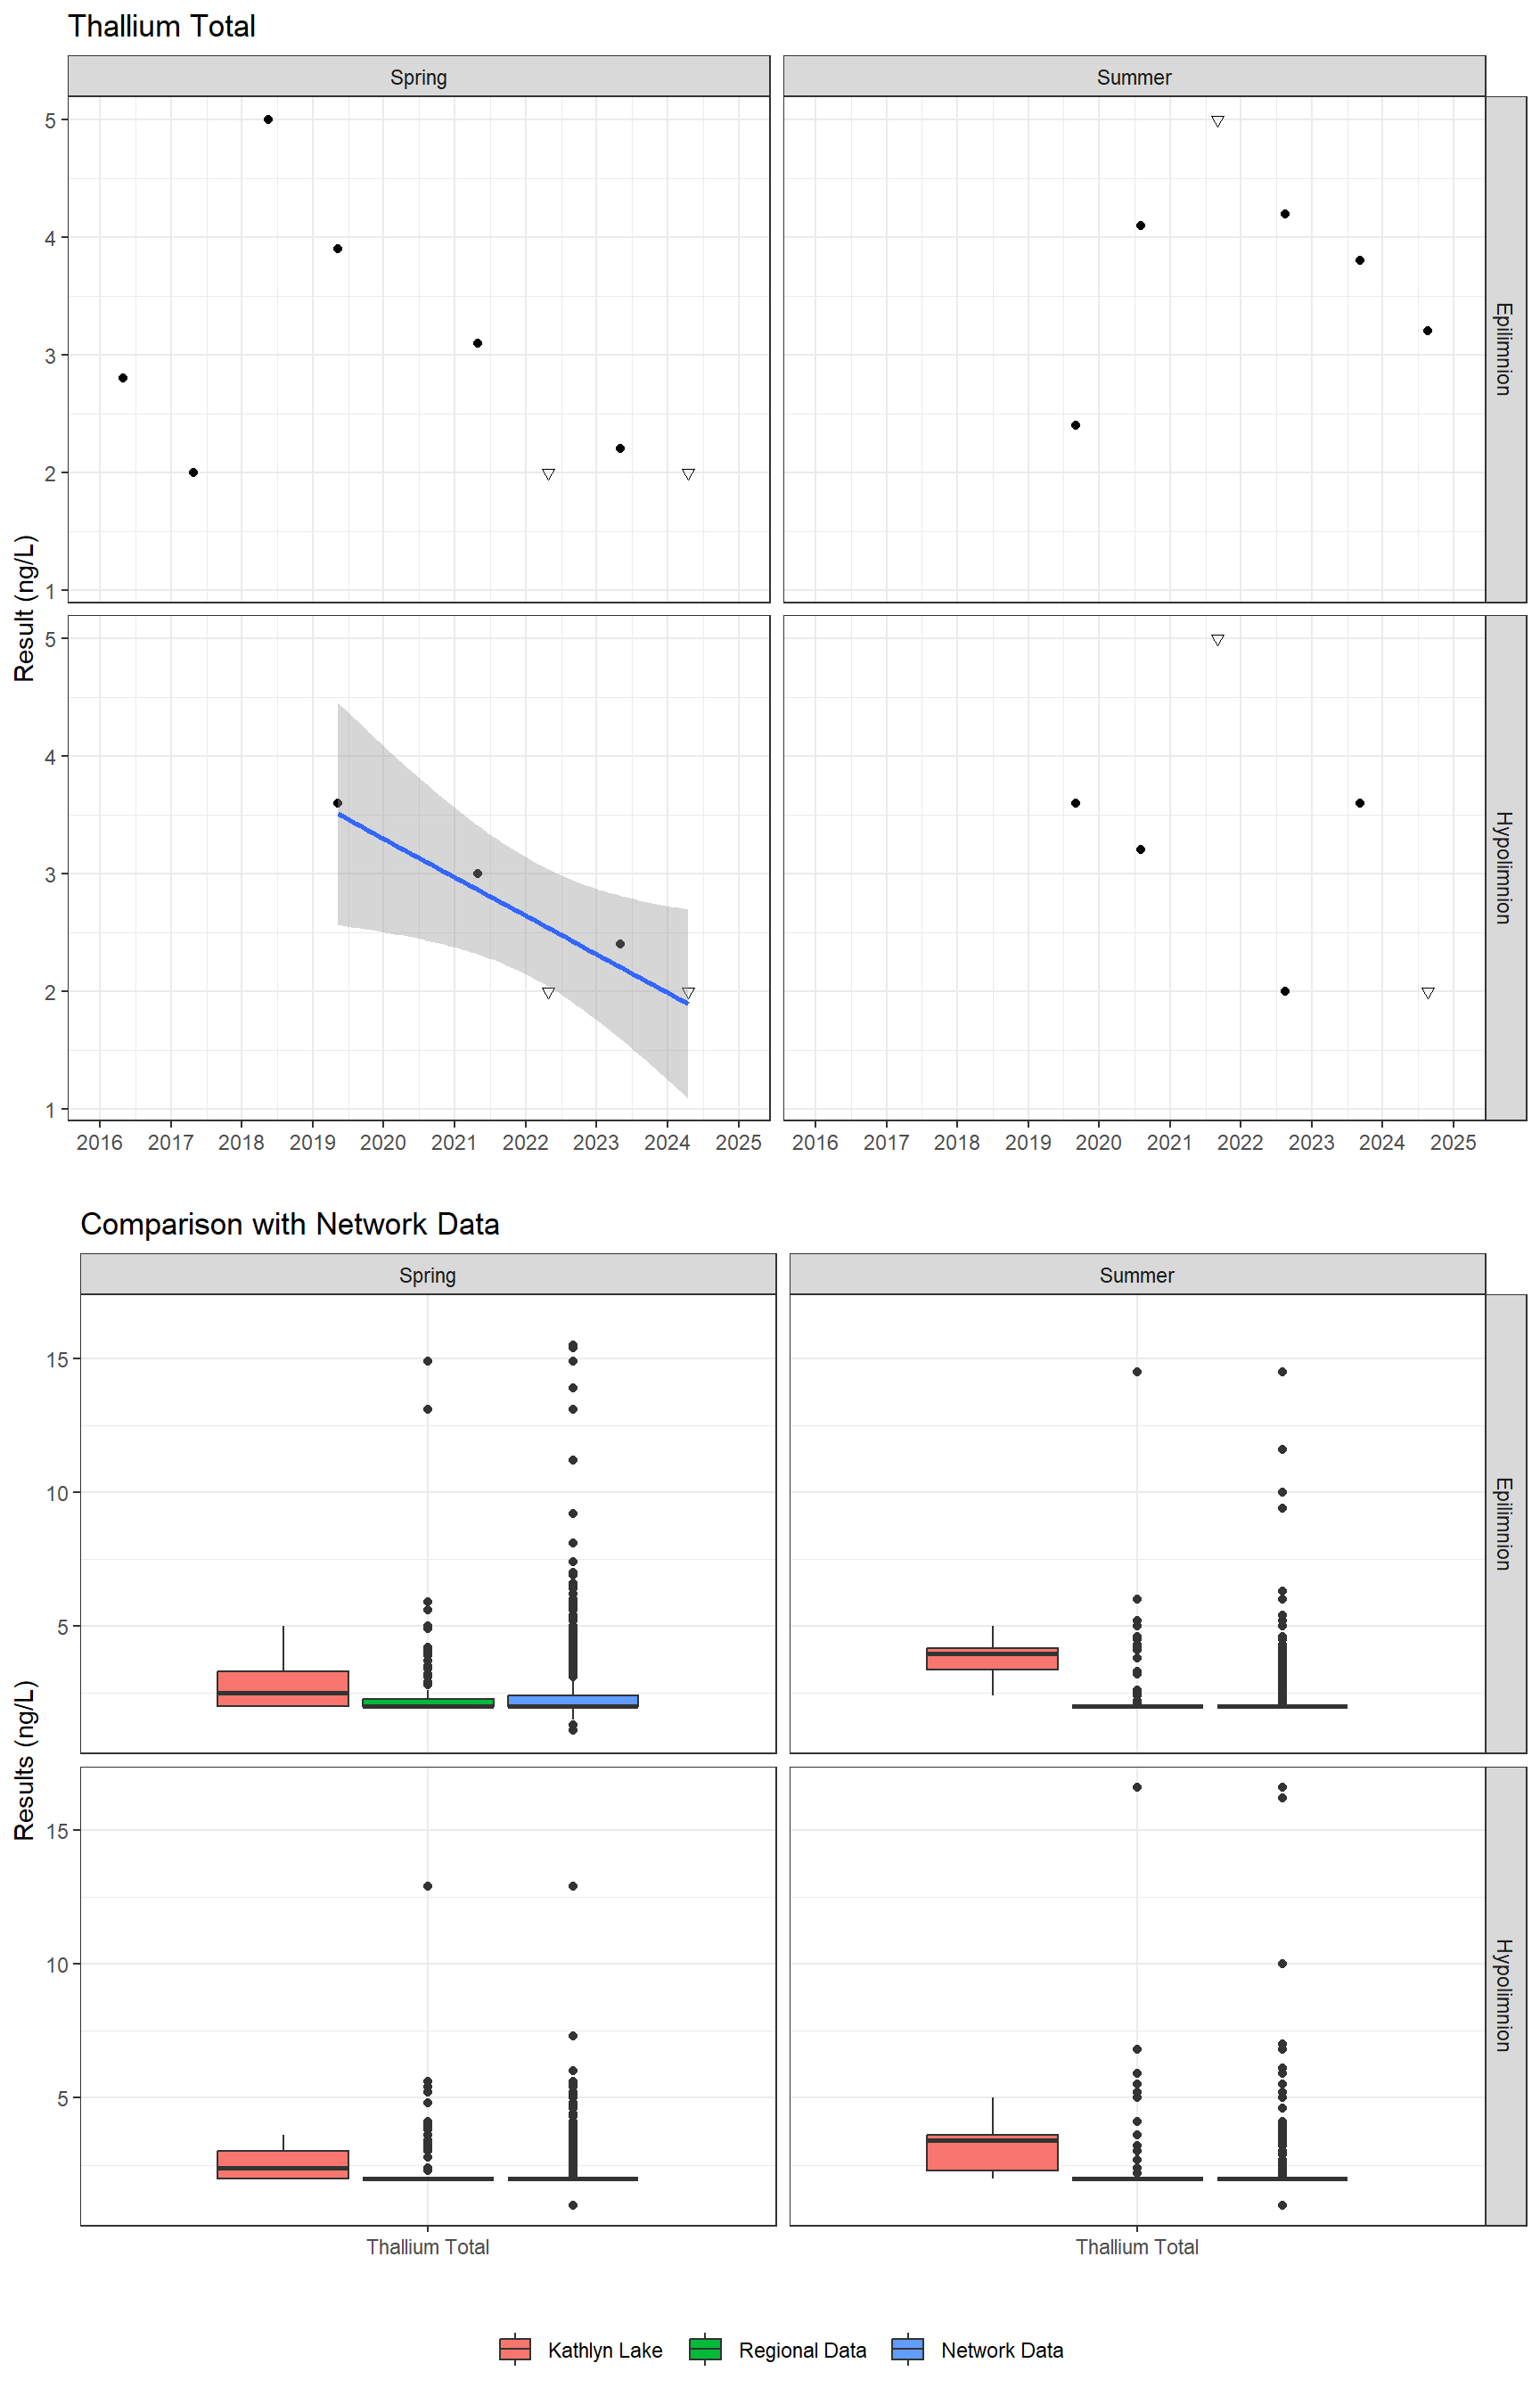
The sample results presented below are grouped into five main categories (Field, General, Major Ions, Nutrients, and Metals – Total), then the data are sorted by season and depth. Click through the tabs below to see results over time for each parameter. Results where the analyte is below the laboratory detection limit (i.e. the amount of analyte in a sample is so small it cannot be measured) are indicated with an open downward facing triangle (▽) drawn at the detection limit, the true value is unknown but is known to be less than the detection limit.
To help interpret the results, if a statistically significant trend (>95% confidence) is detected a linear best fit line is plotted with shaded error bars marking the bounds of confidence. For the purposes of the linear model used to make the trend line, non-detection results are treated as if they are true results at the detection limit. Keep in mind that trends, particularly if there are few data points or many non-detects, should be treated with caution and do not necessarily indicate a true trend.
To understand more about water quality and how it impacts human and natural uses of water the Province has published Approved Water Quality Guidelines. The raw data for this report can be downloaded here or the entire EMS data record can be downloaded from the BC Data Catalogue.
Field

General

_1131007.png)


Major Ions
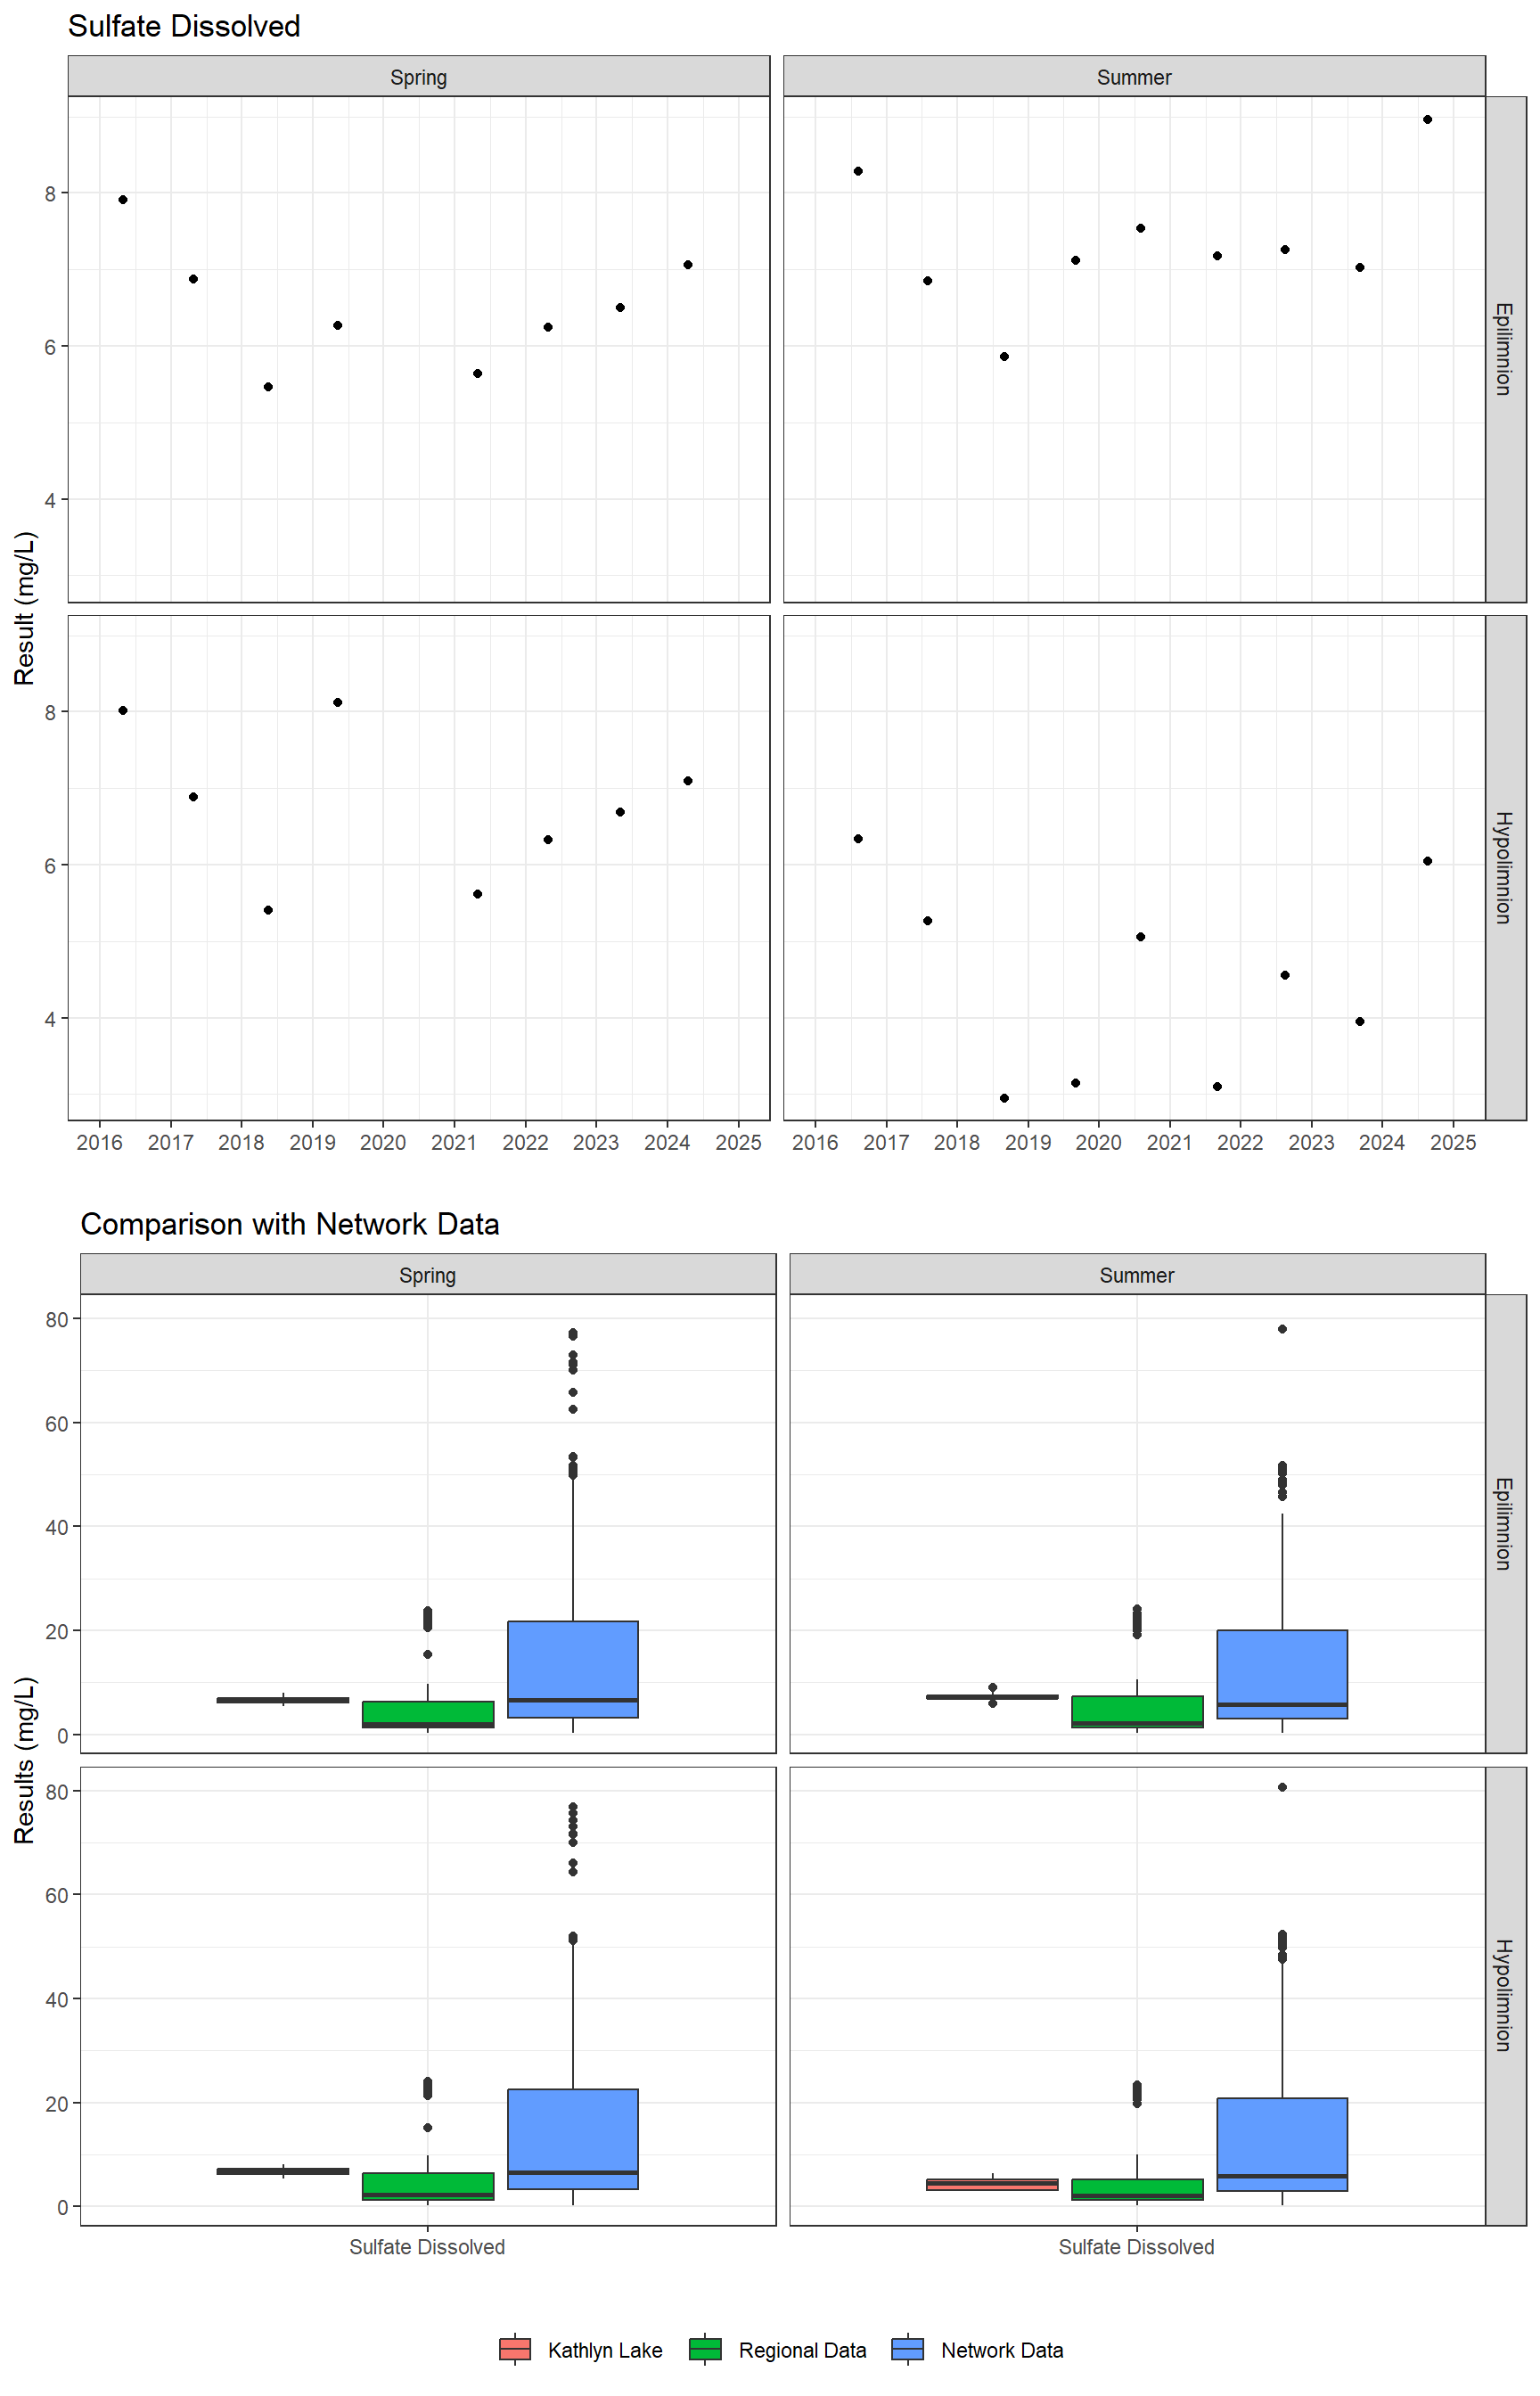
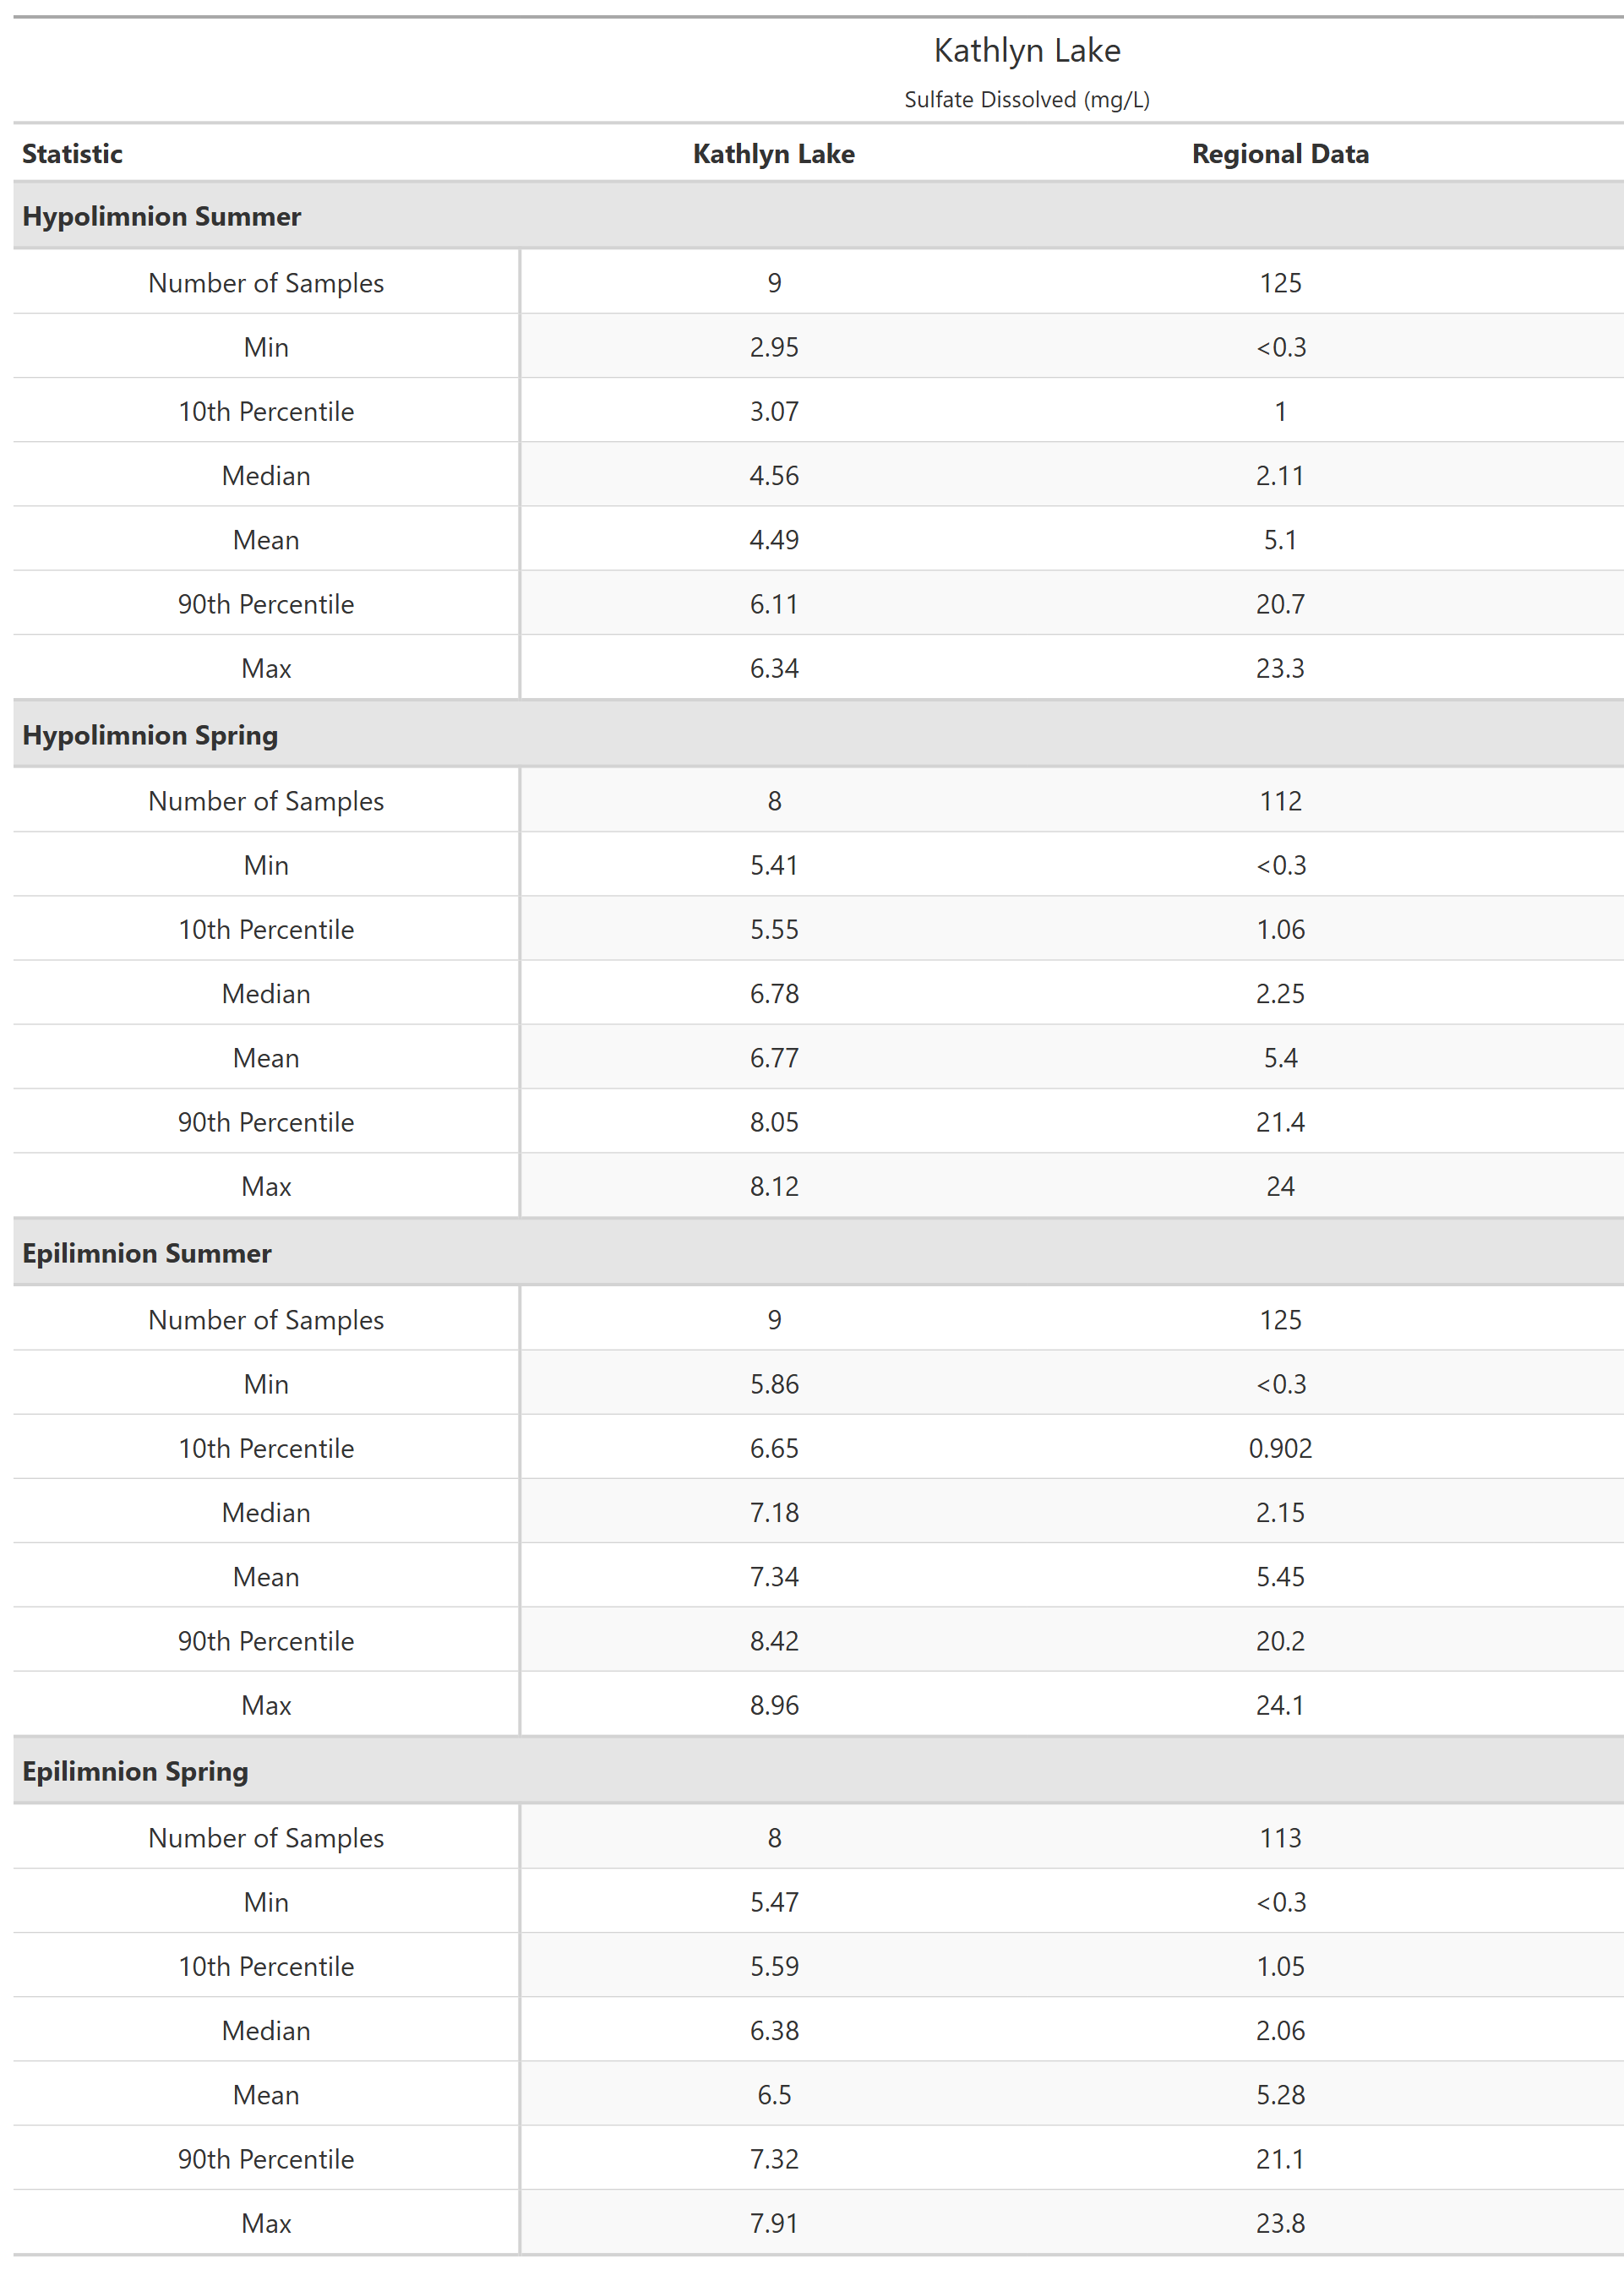
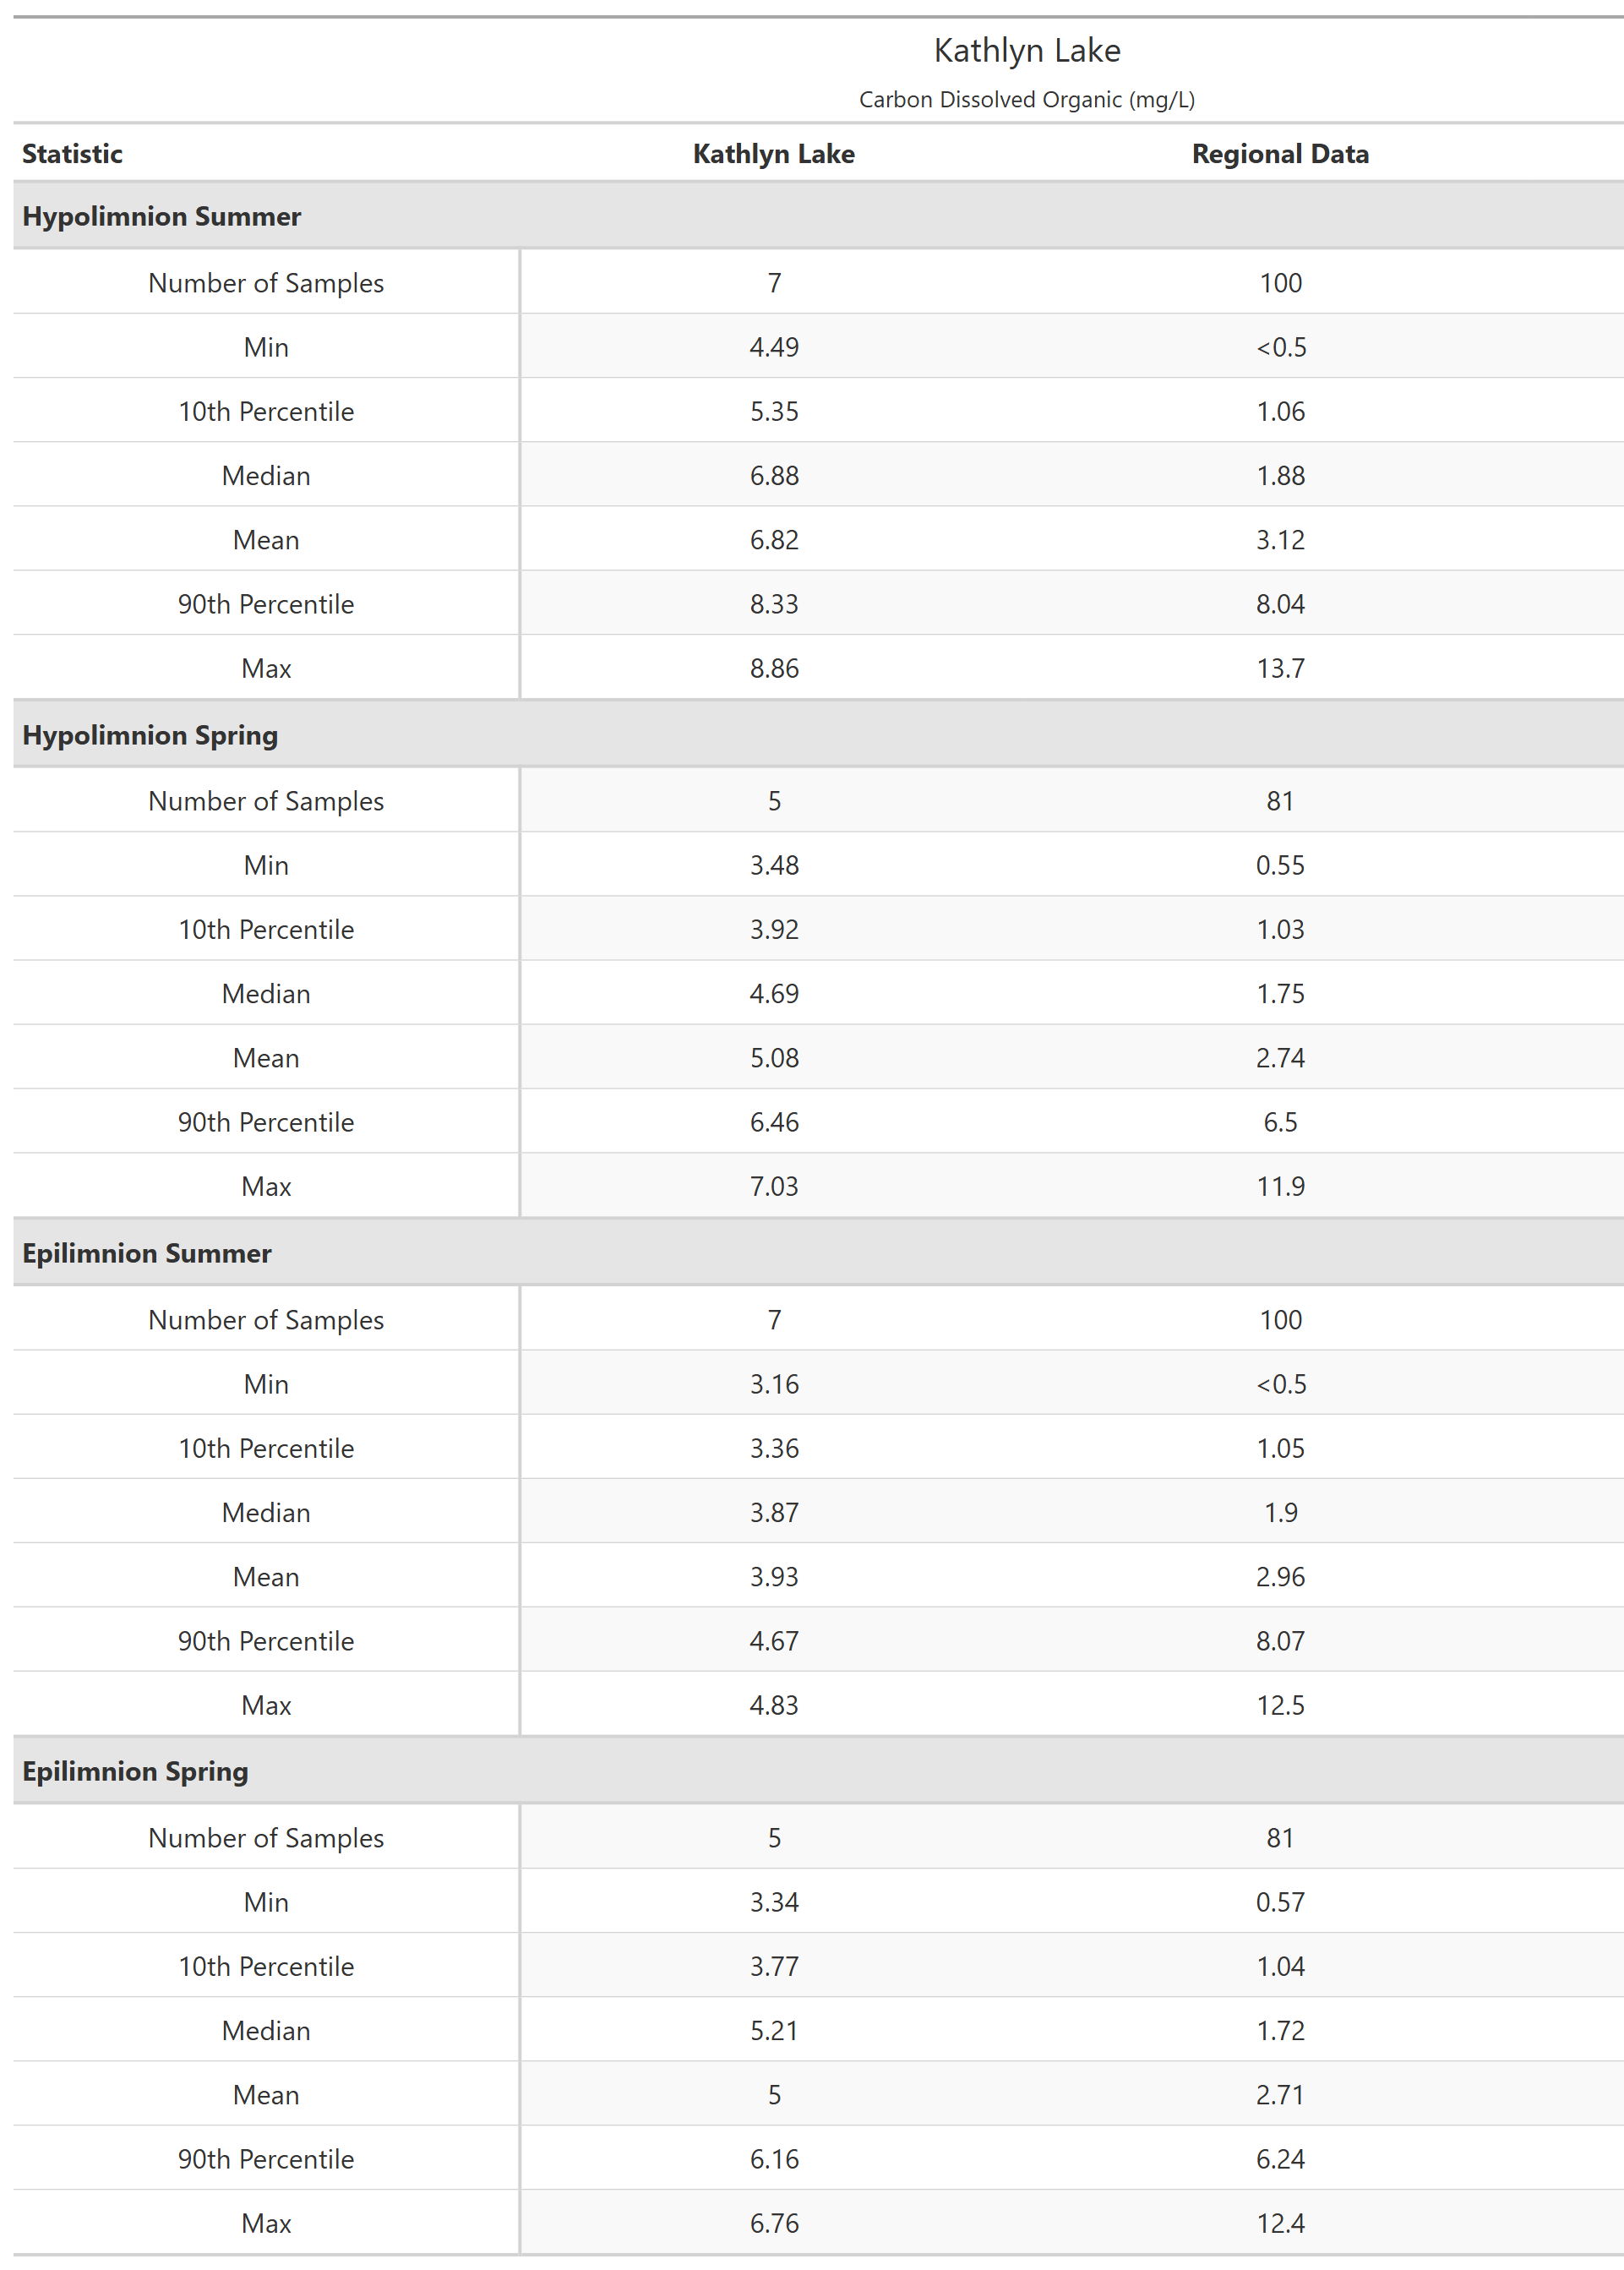
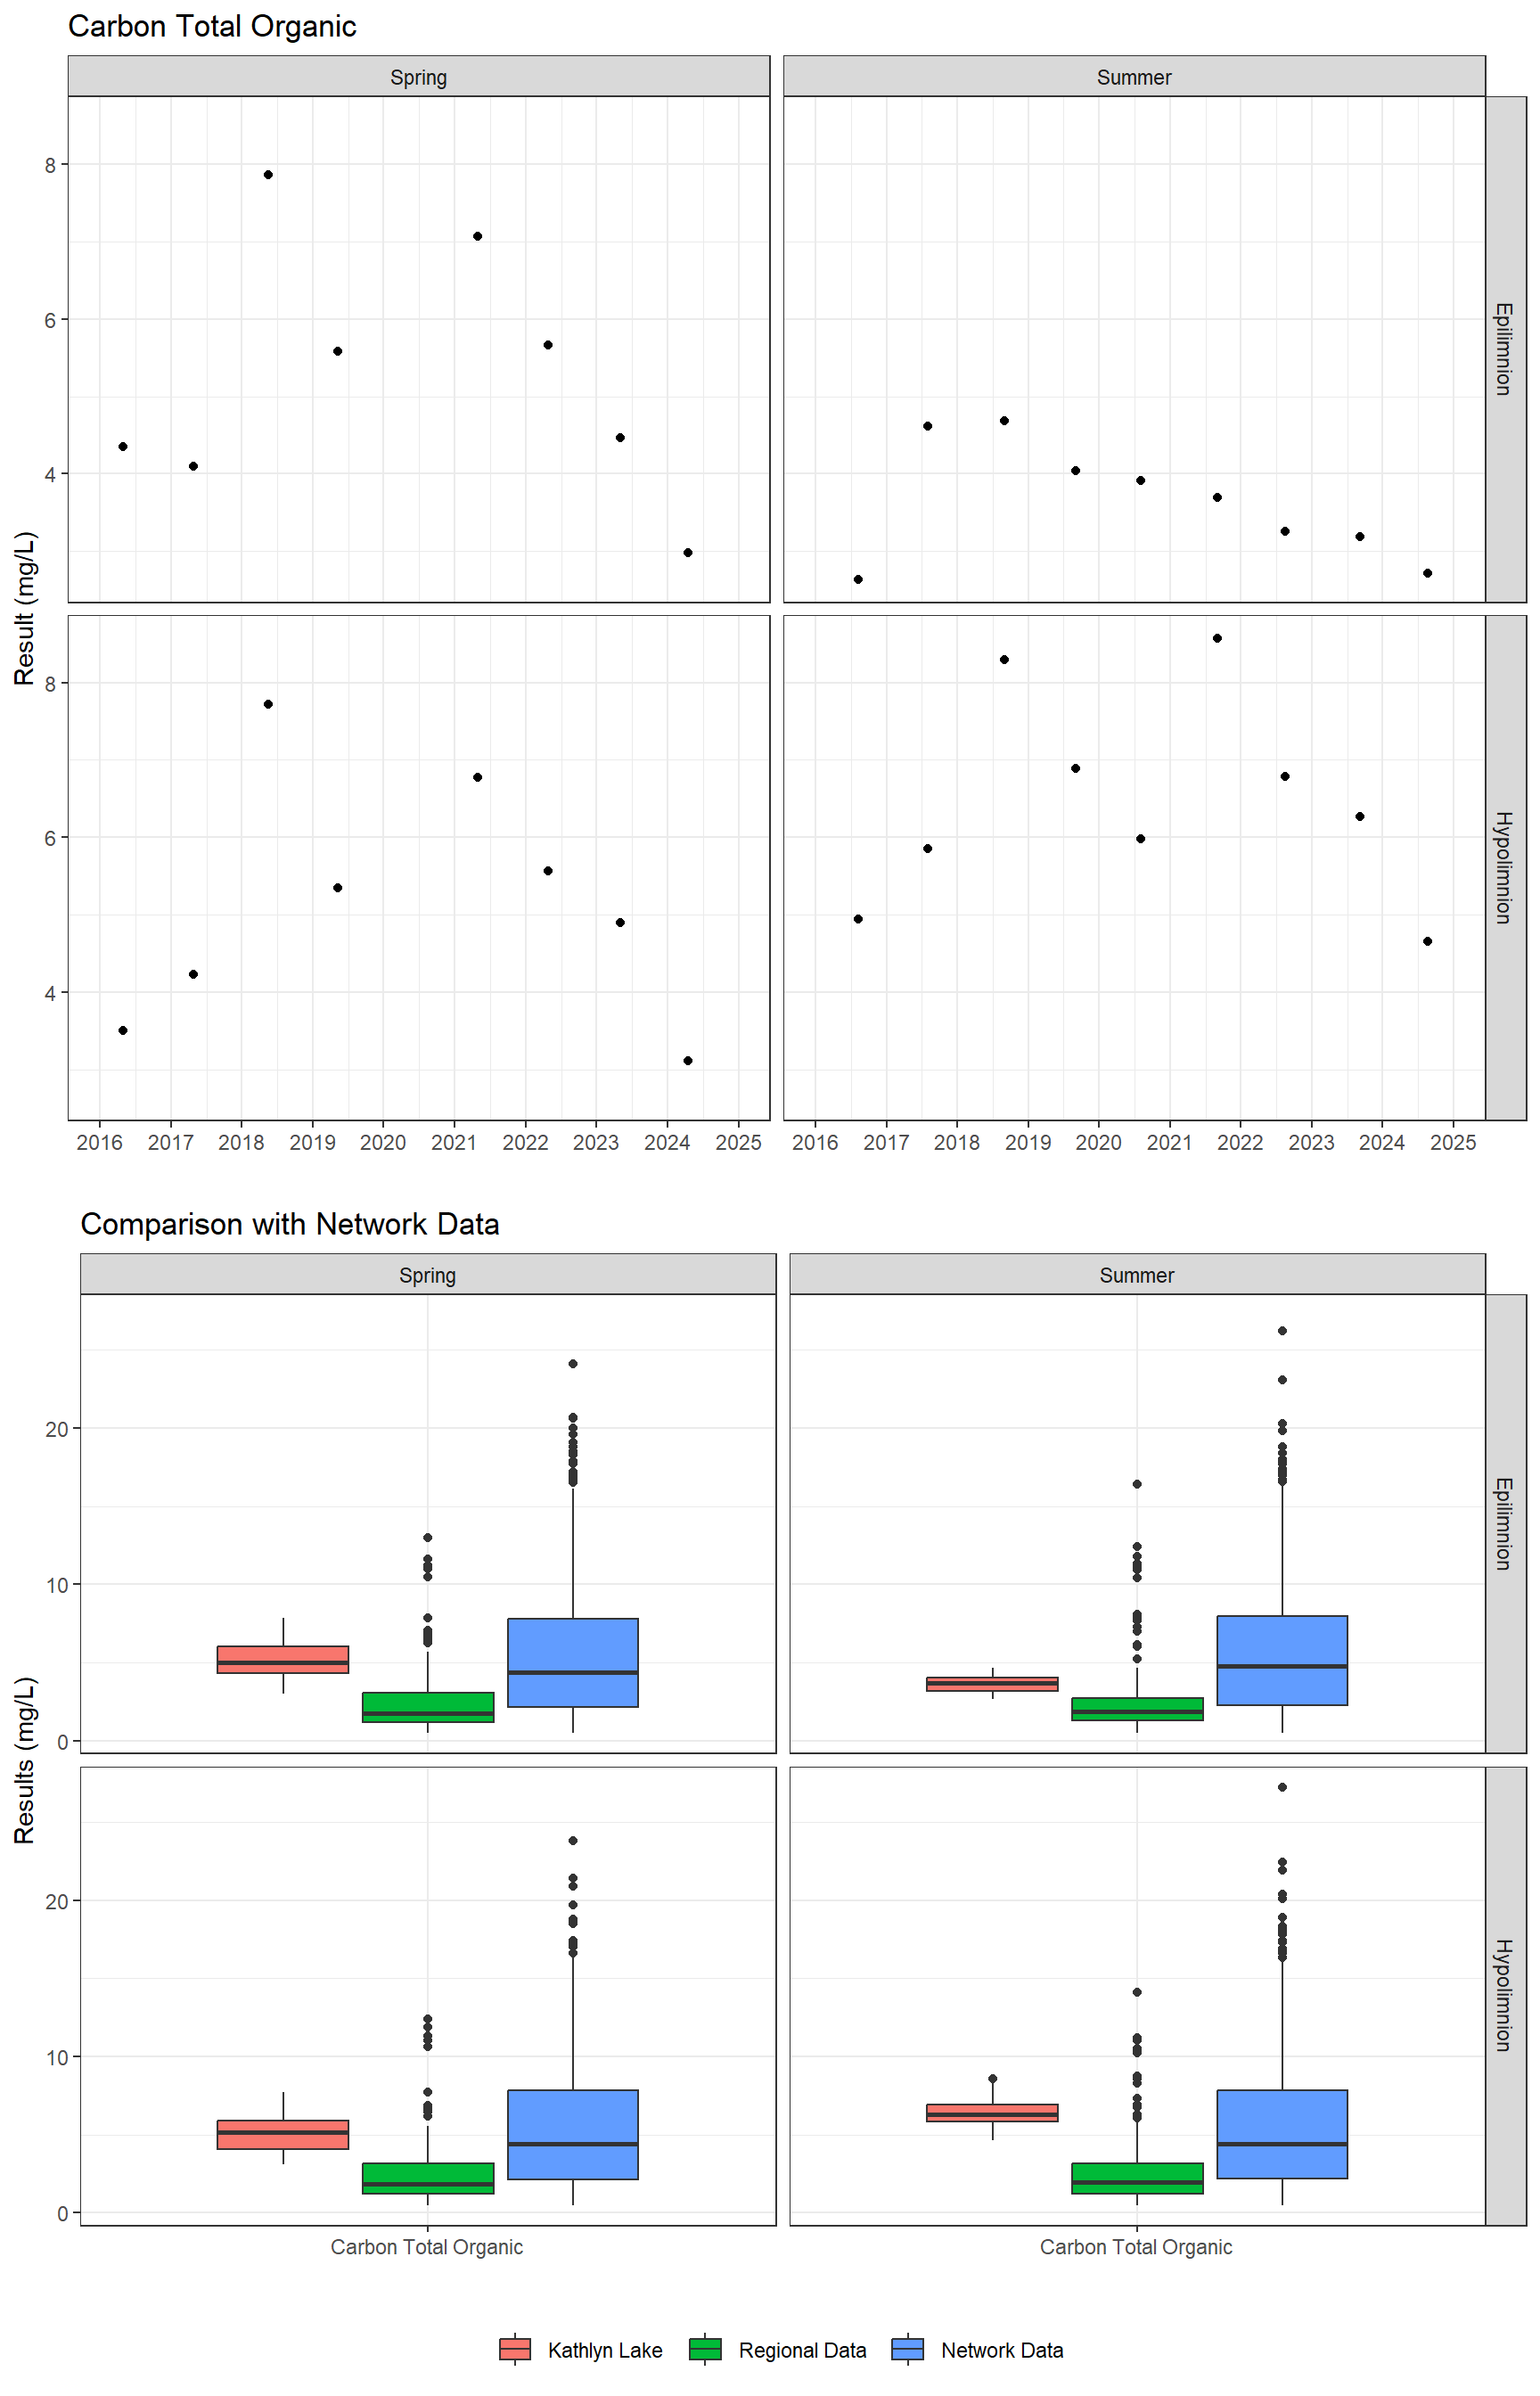
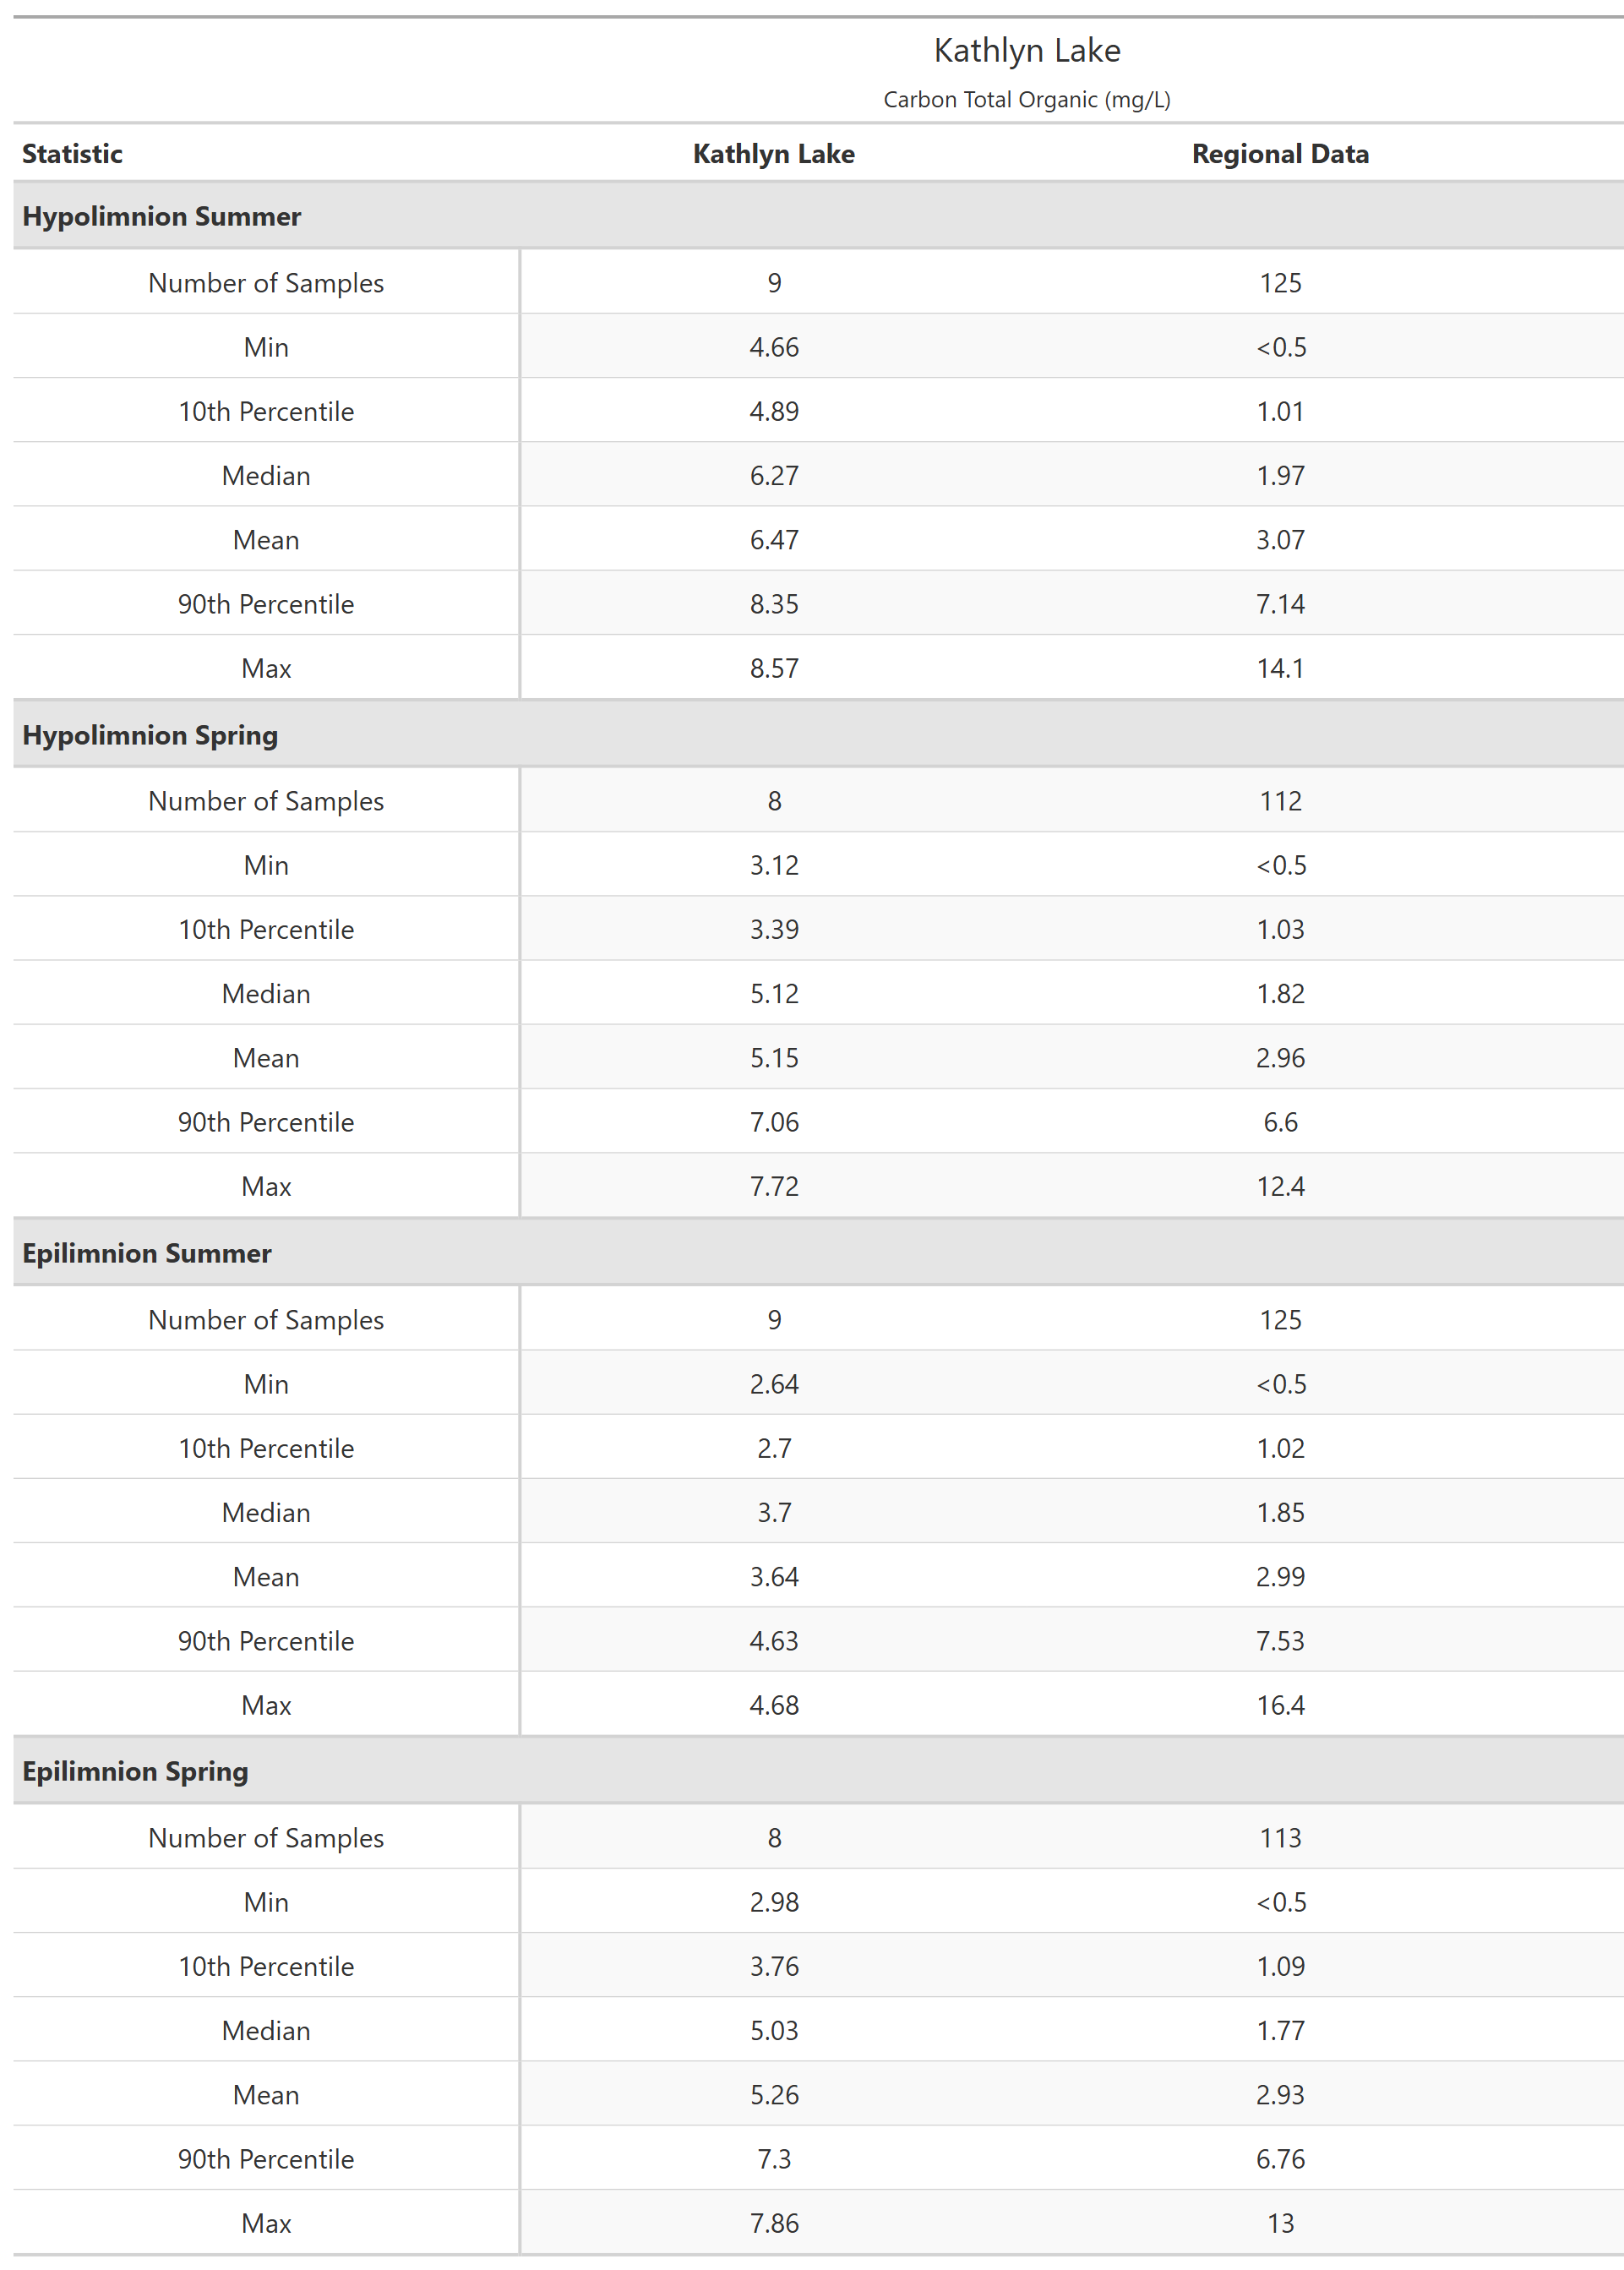
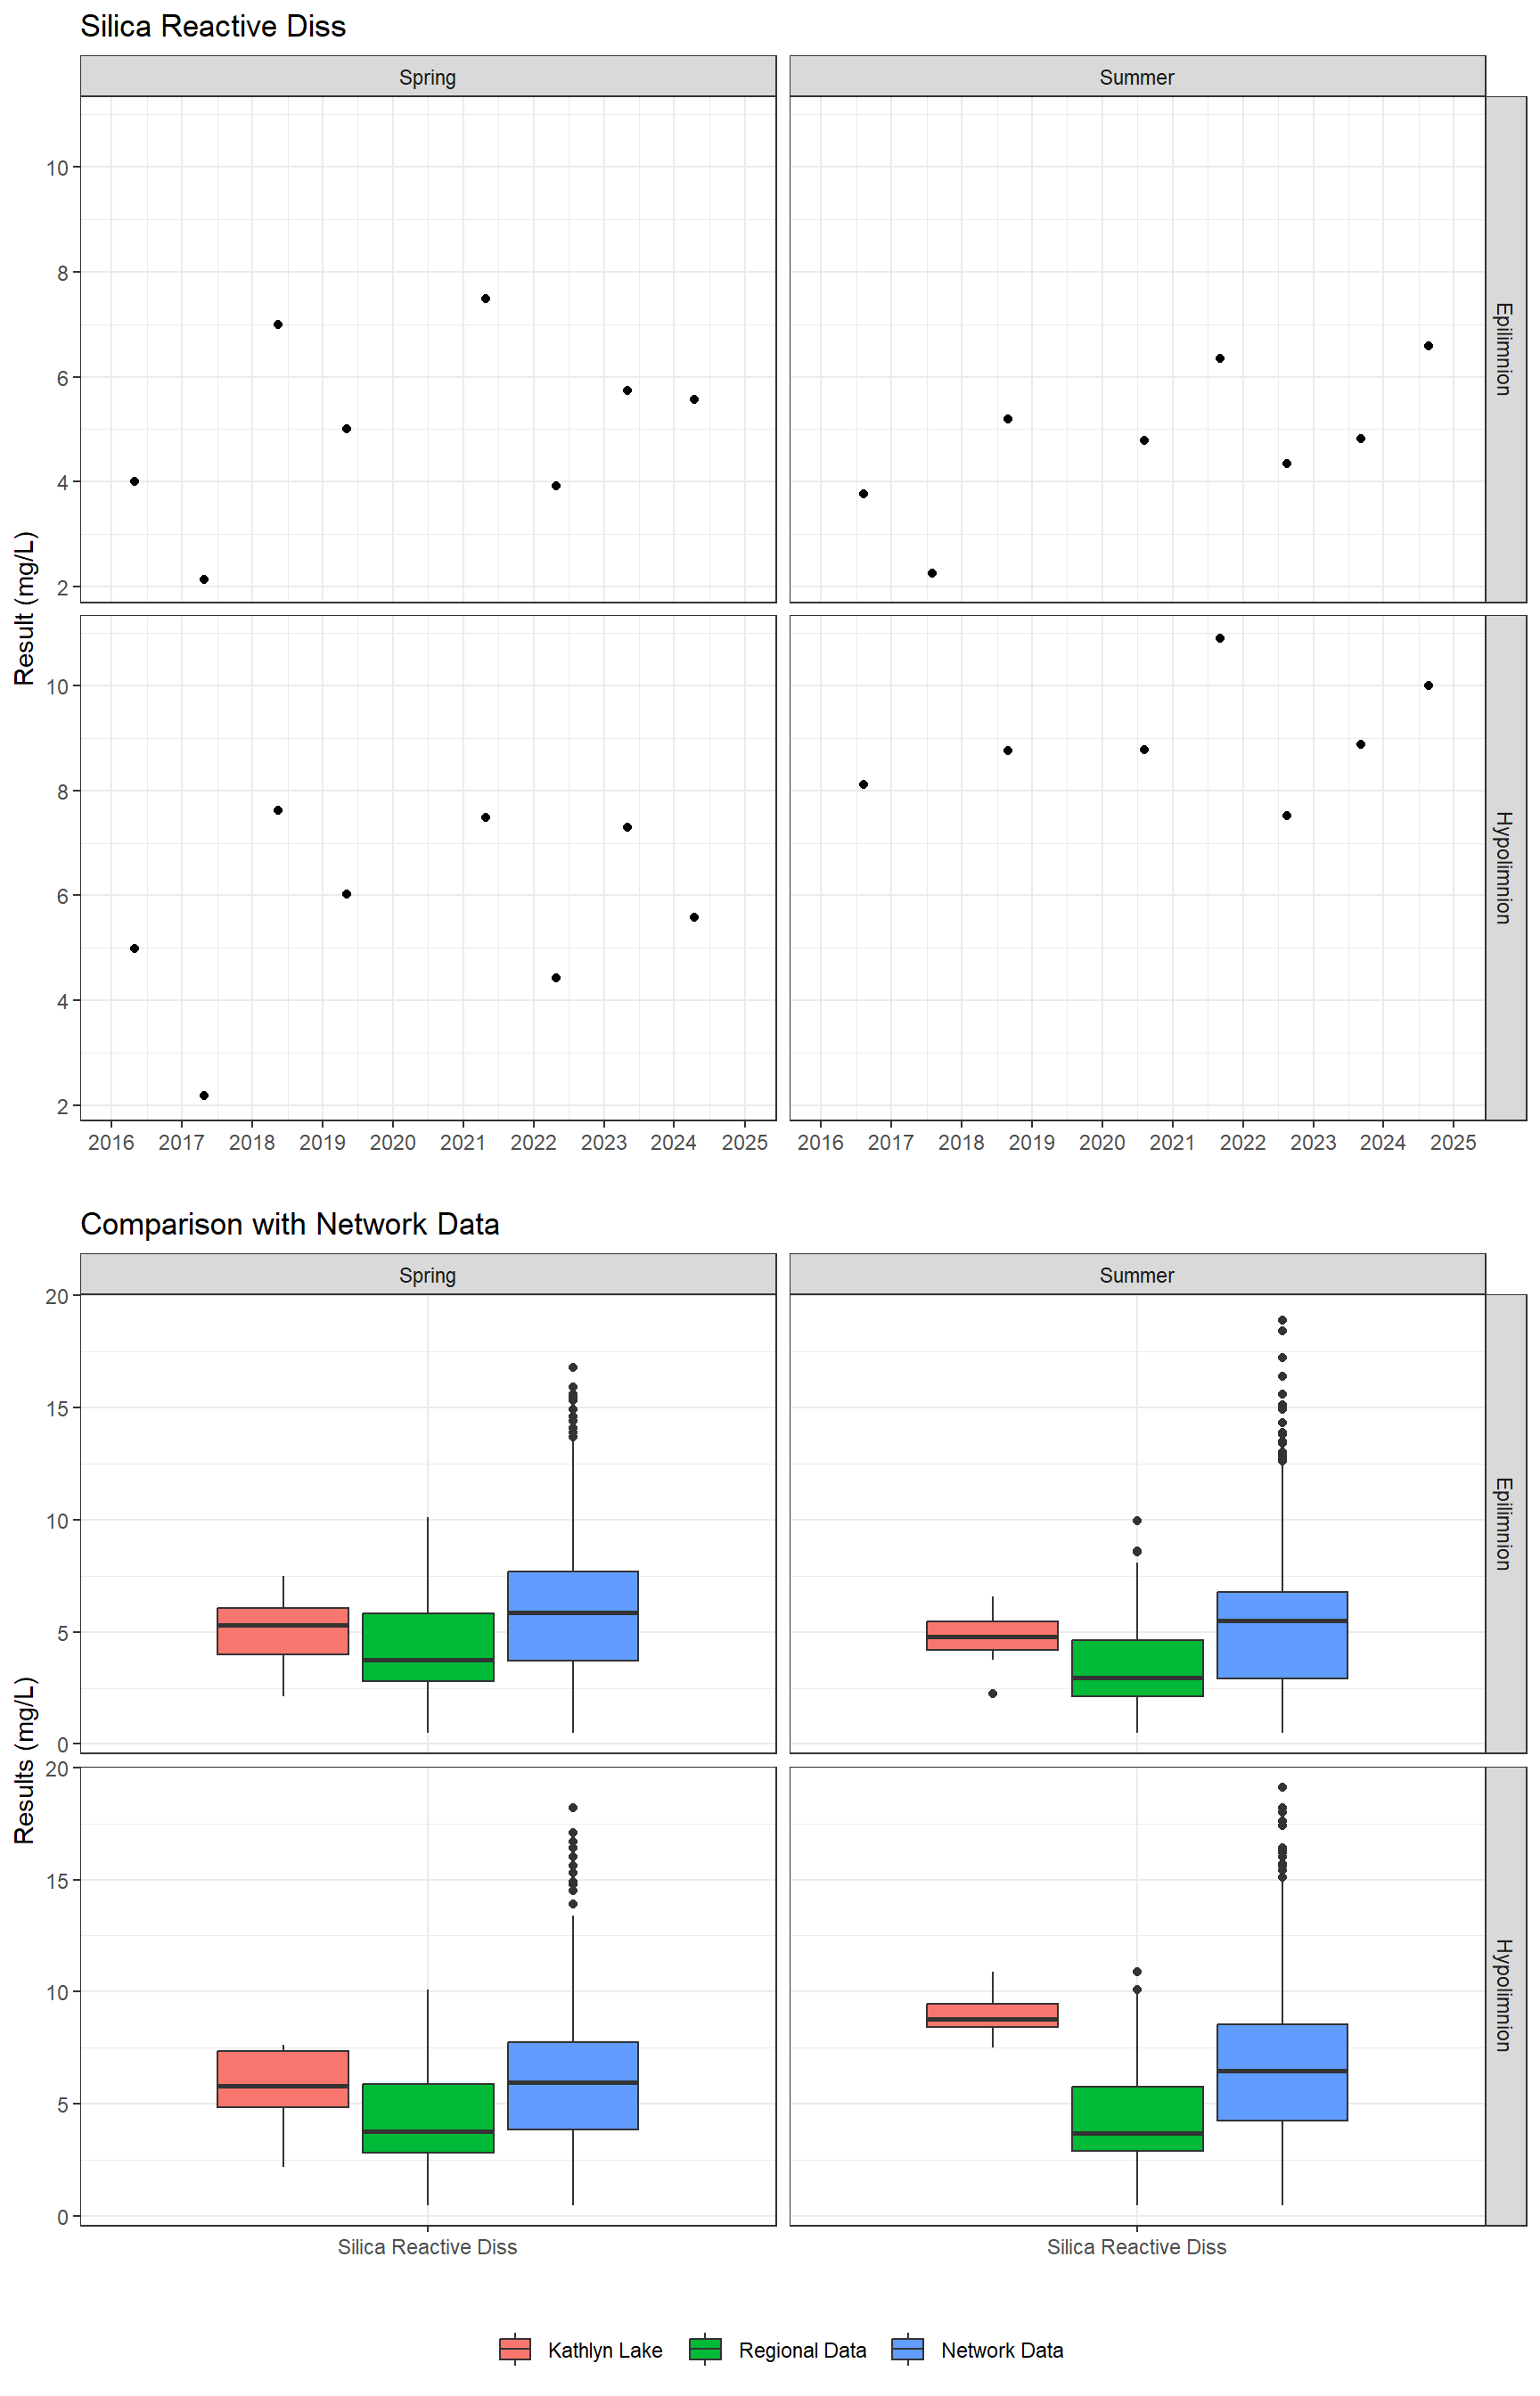
Nutrients
%20Dissolved_1131007.png)
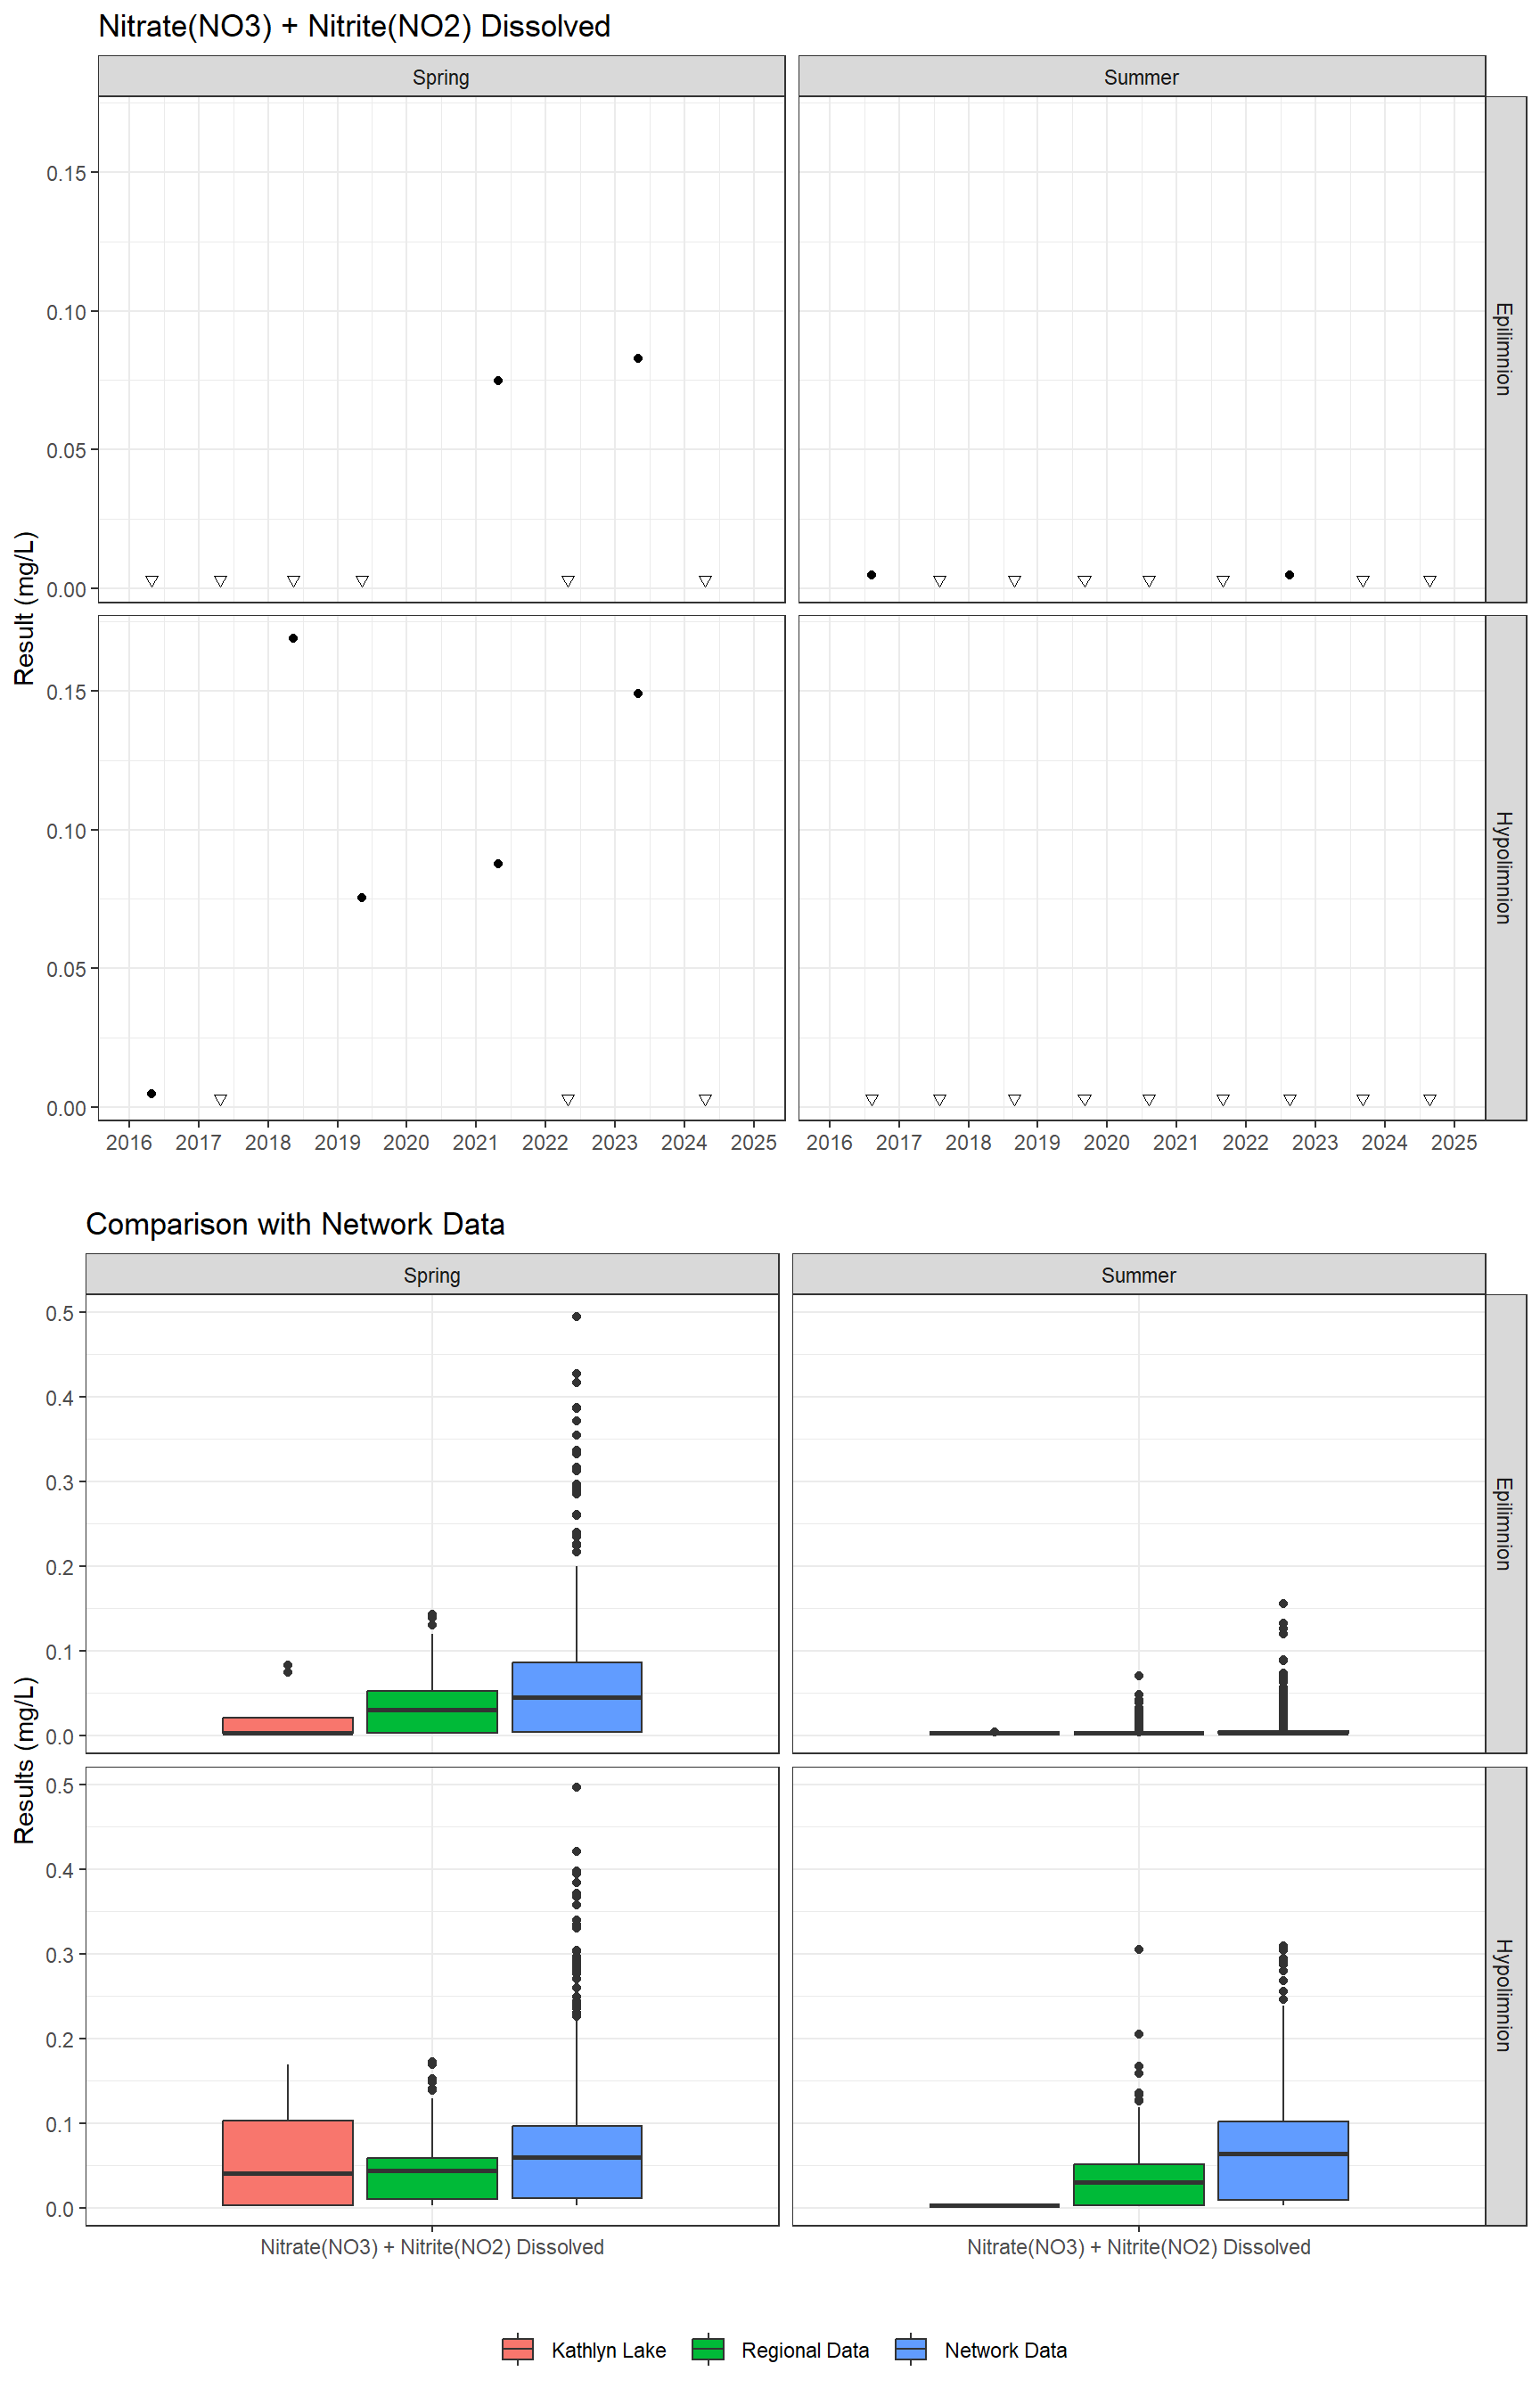
%20+%20Nitrite(NO2)%20Dissolved_1131007.png)
_1131007.png)

_1131007.png)
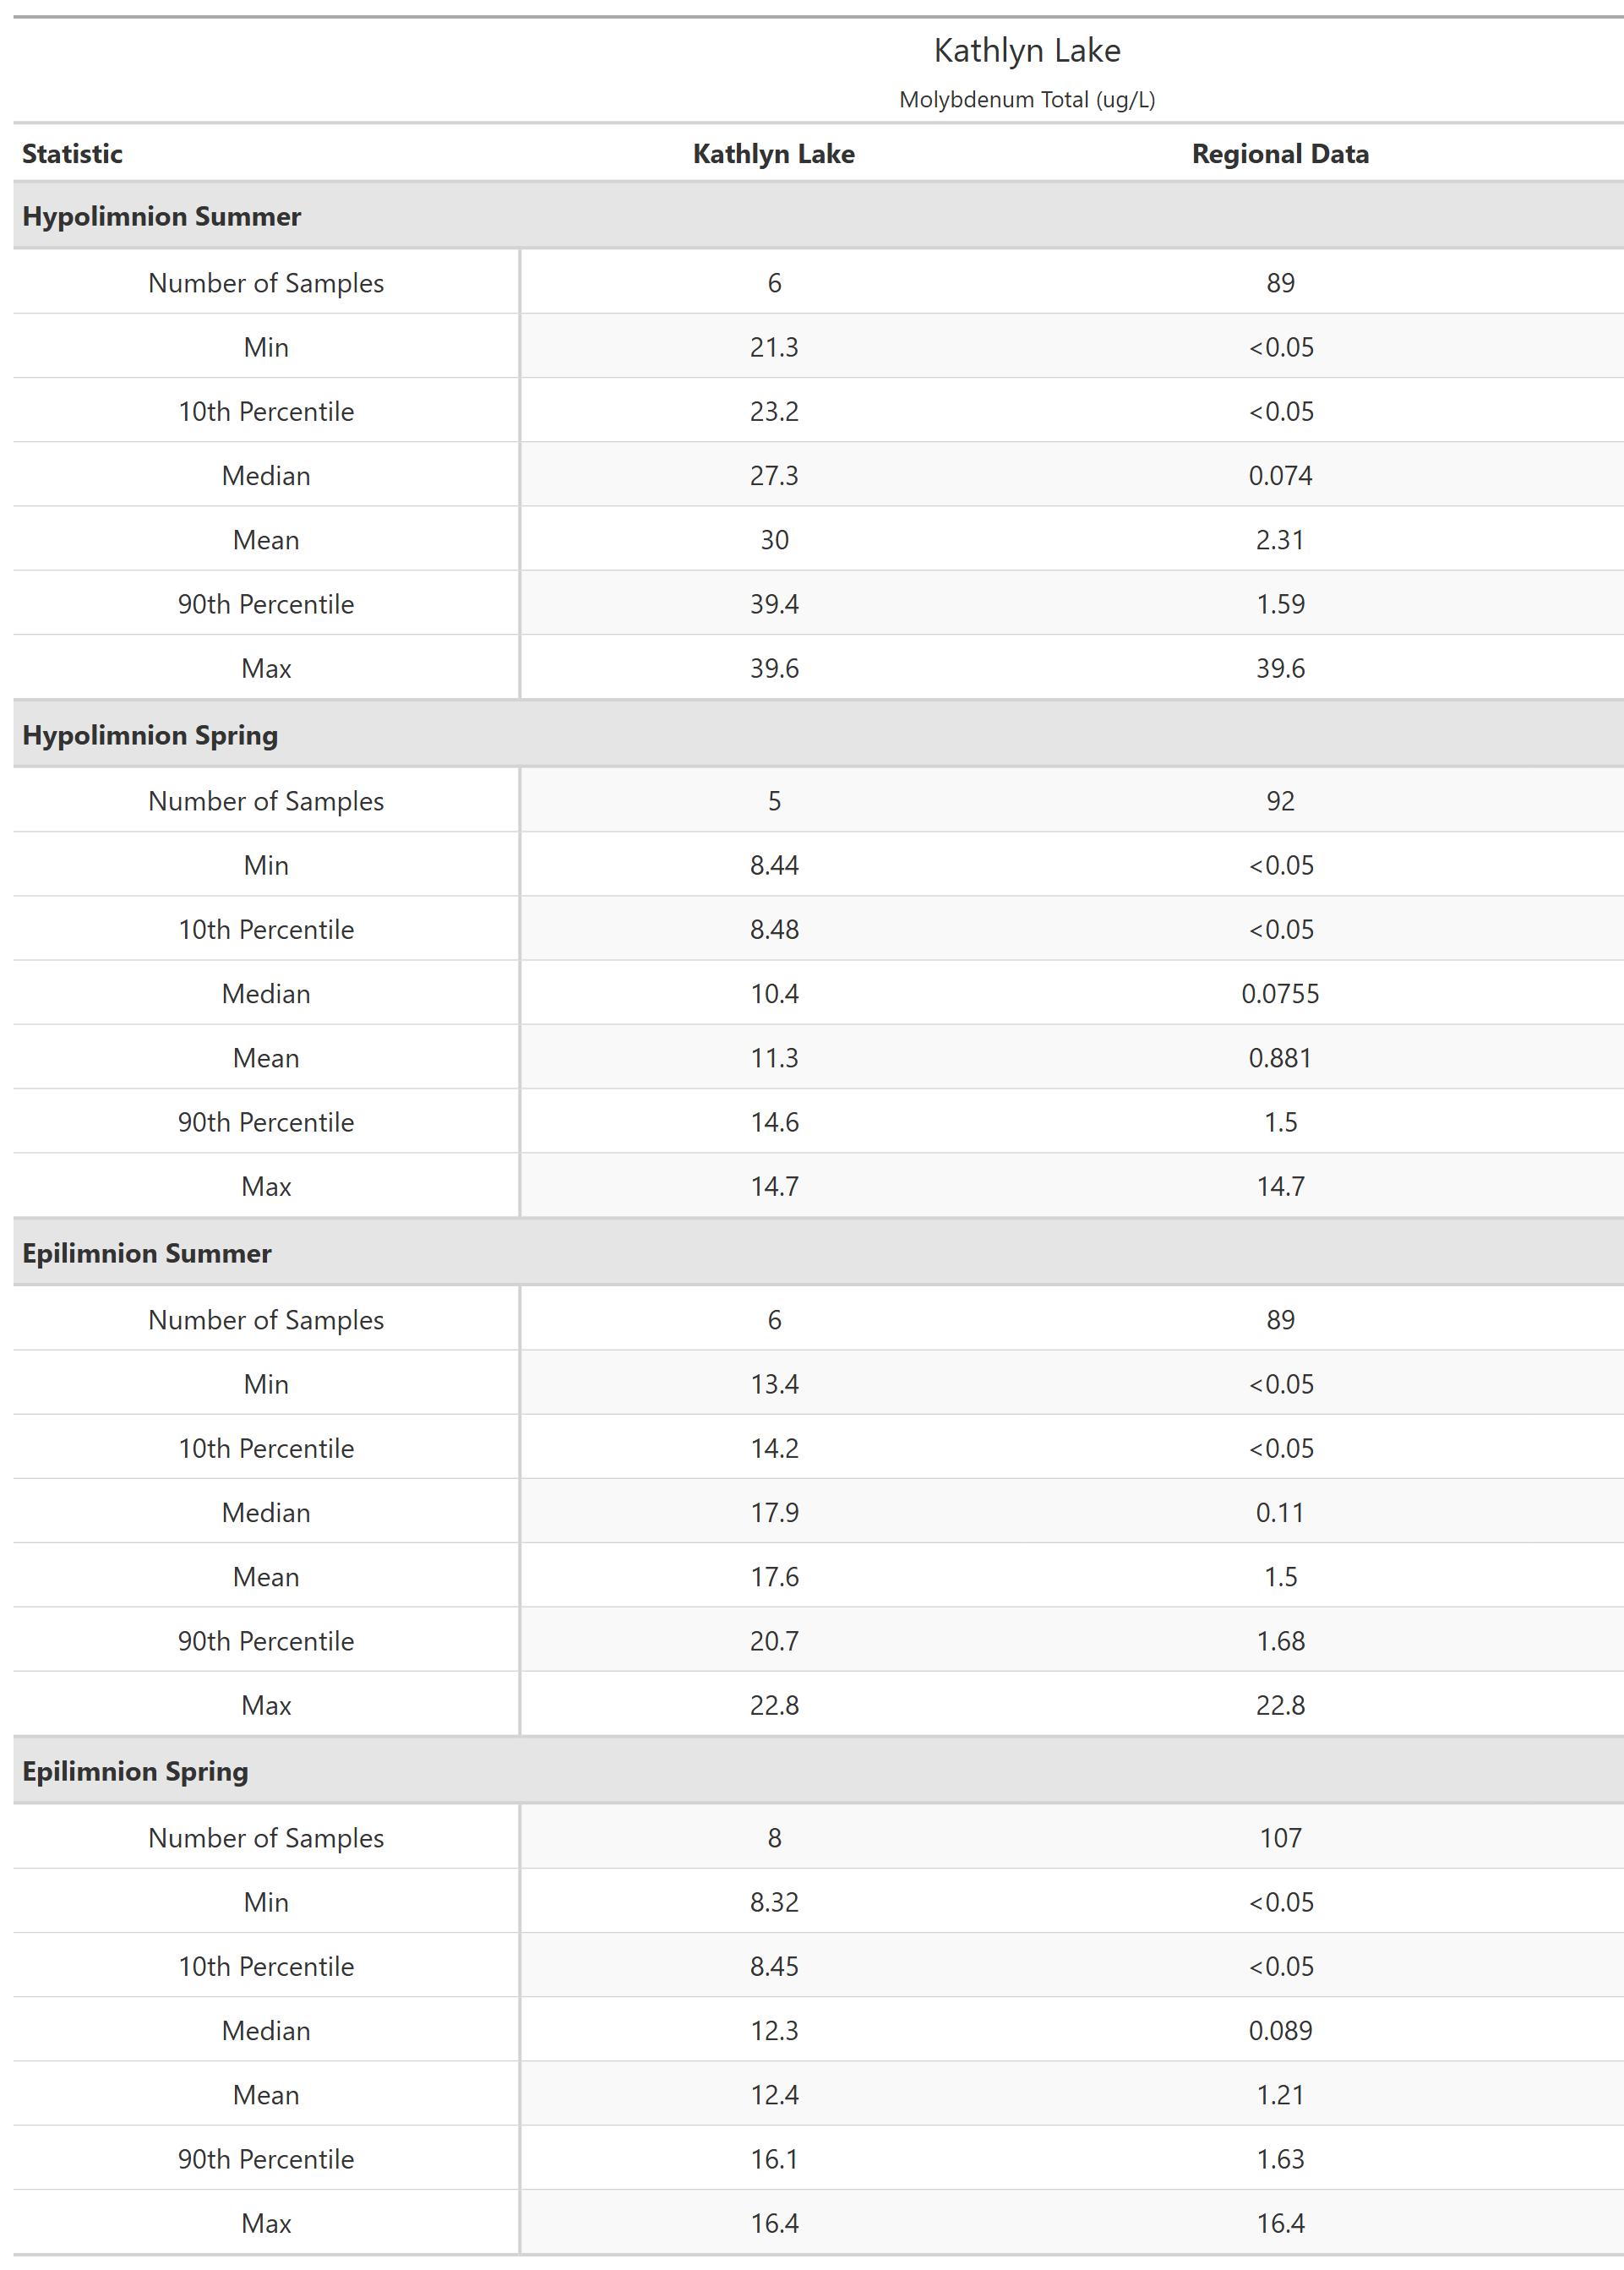
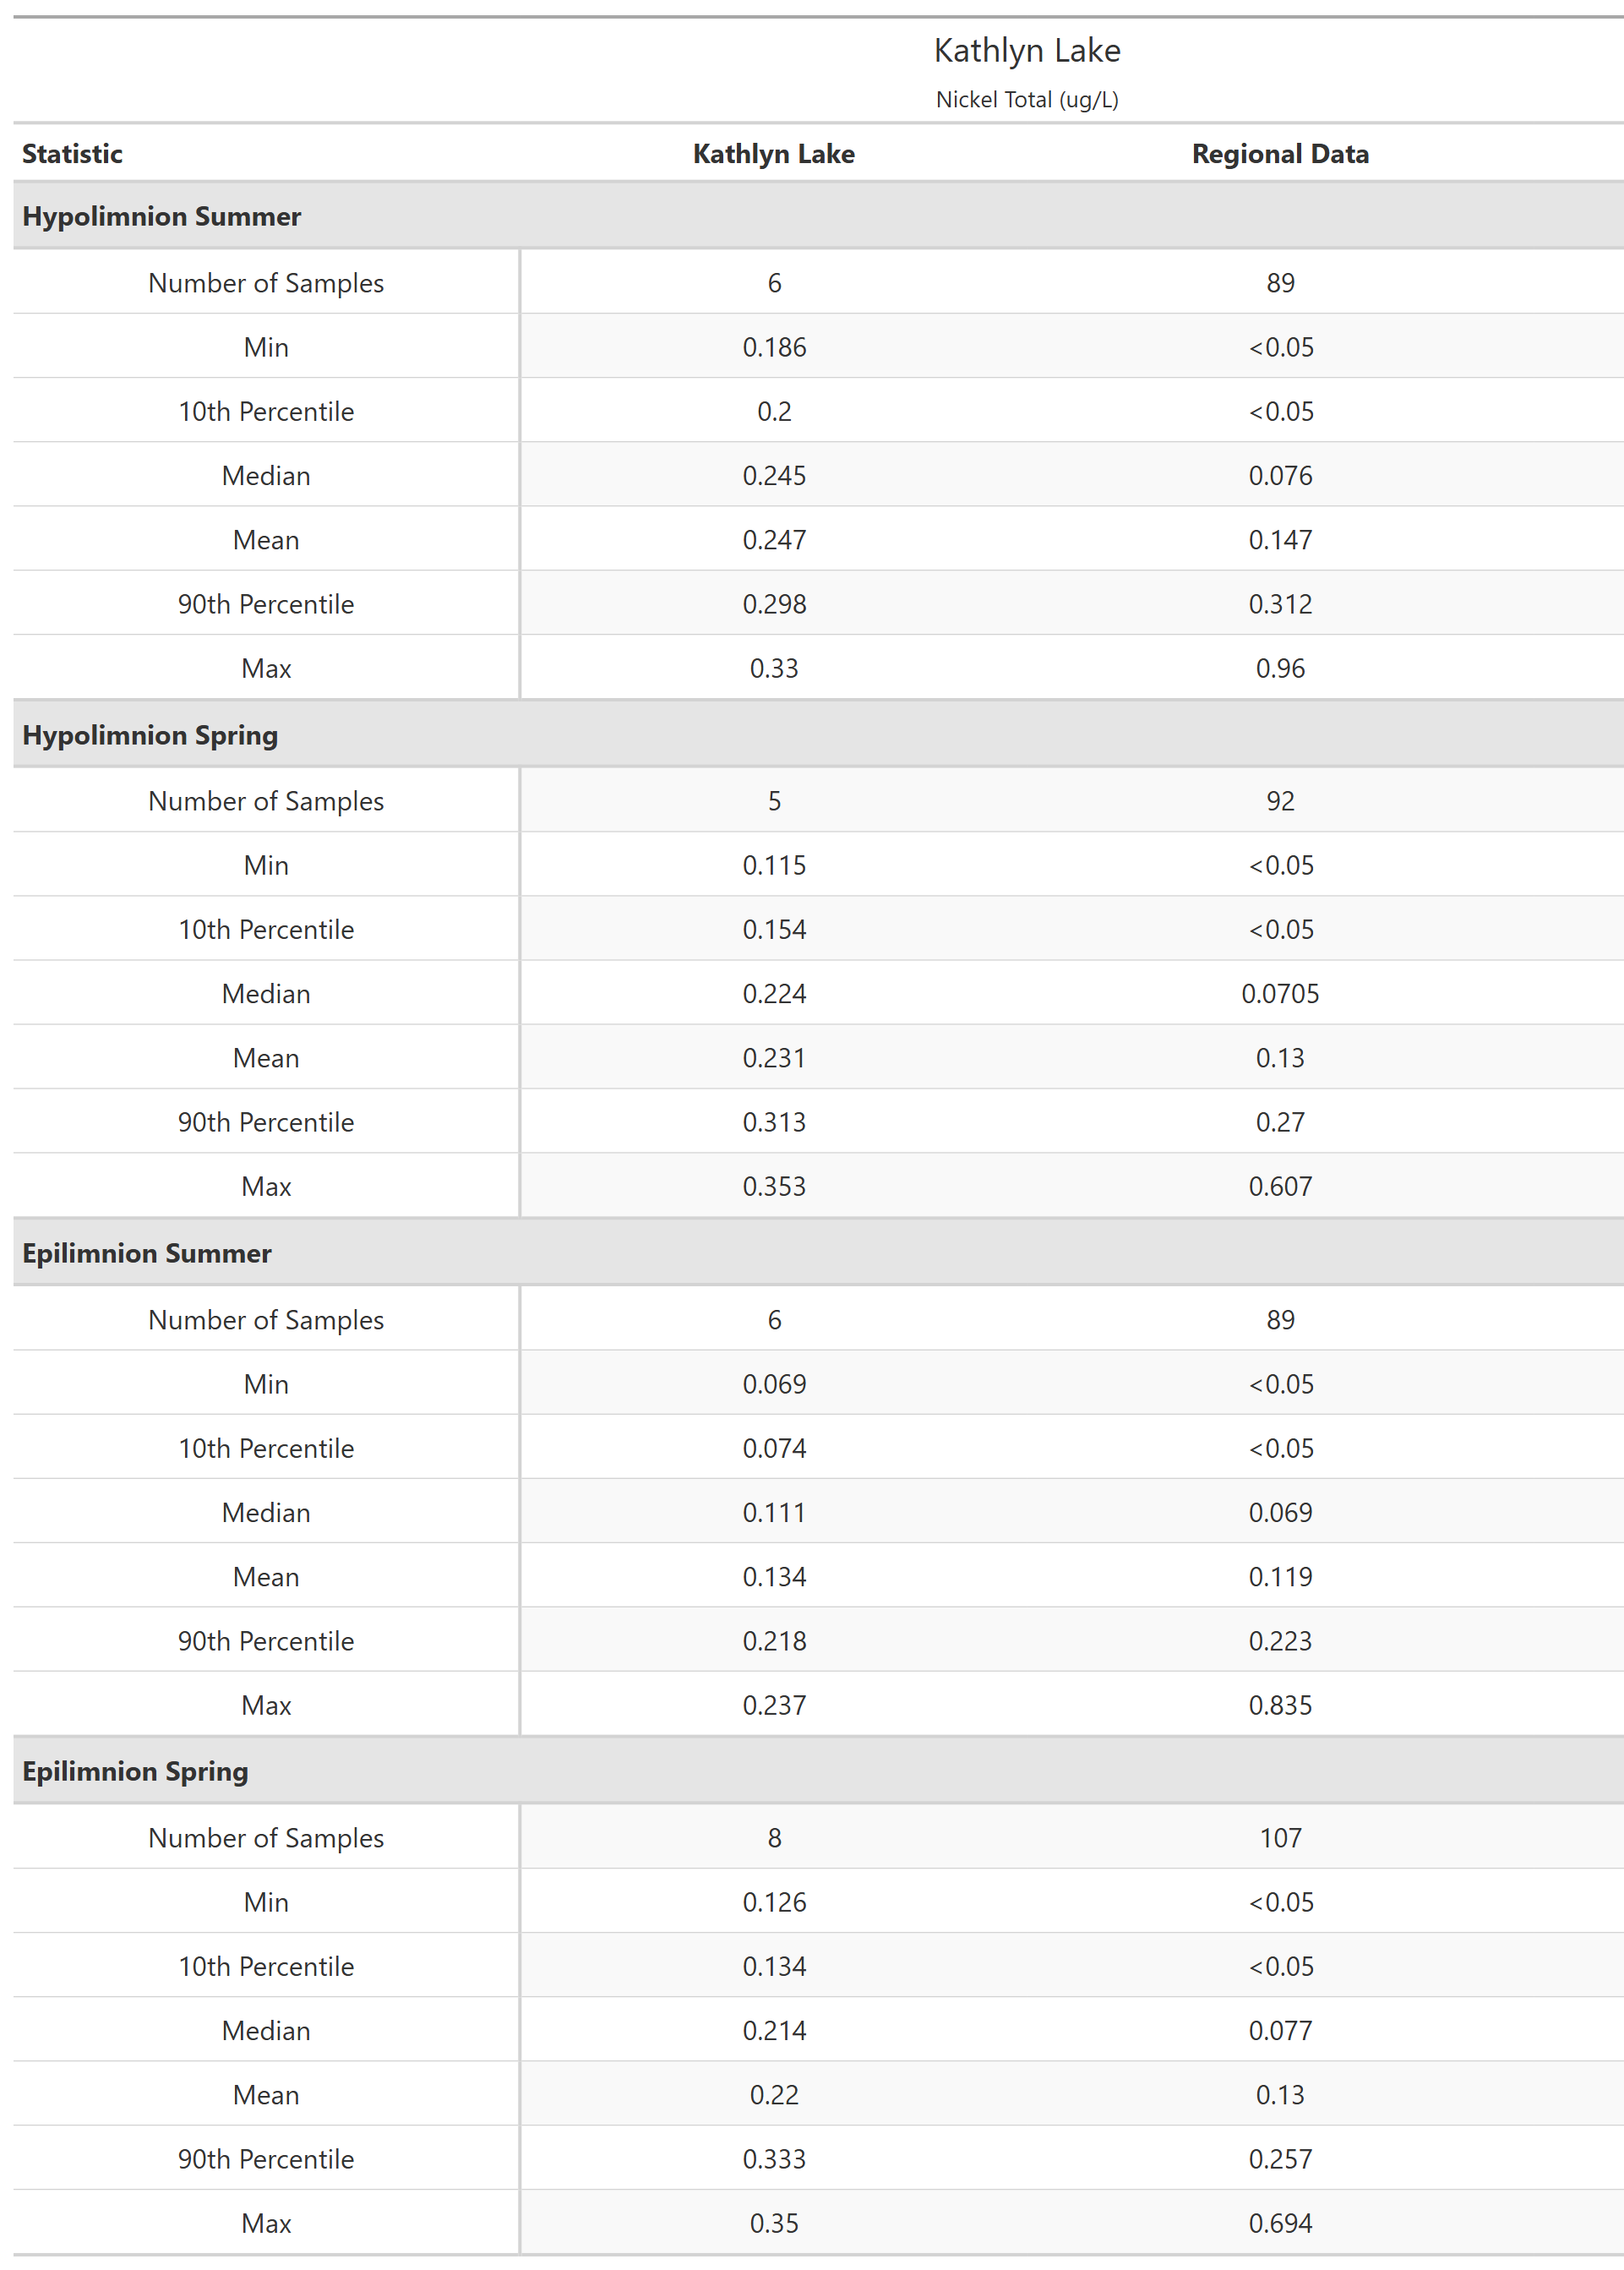
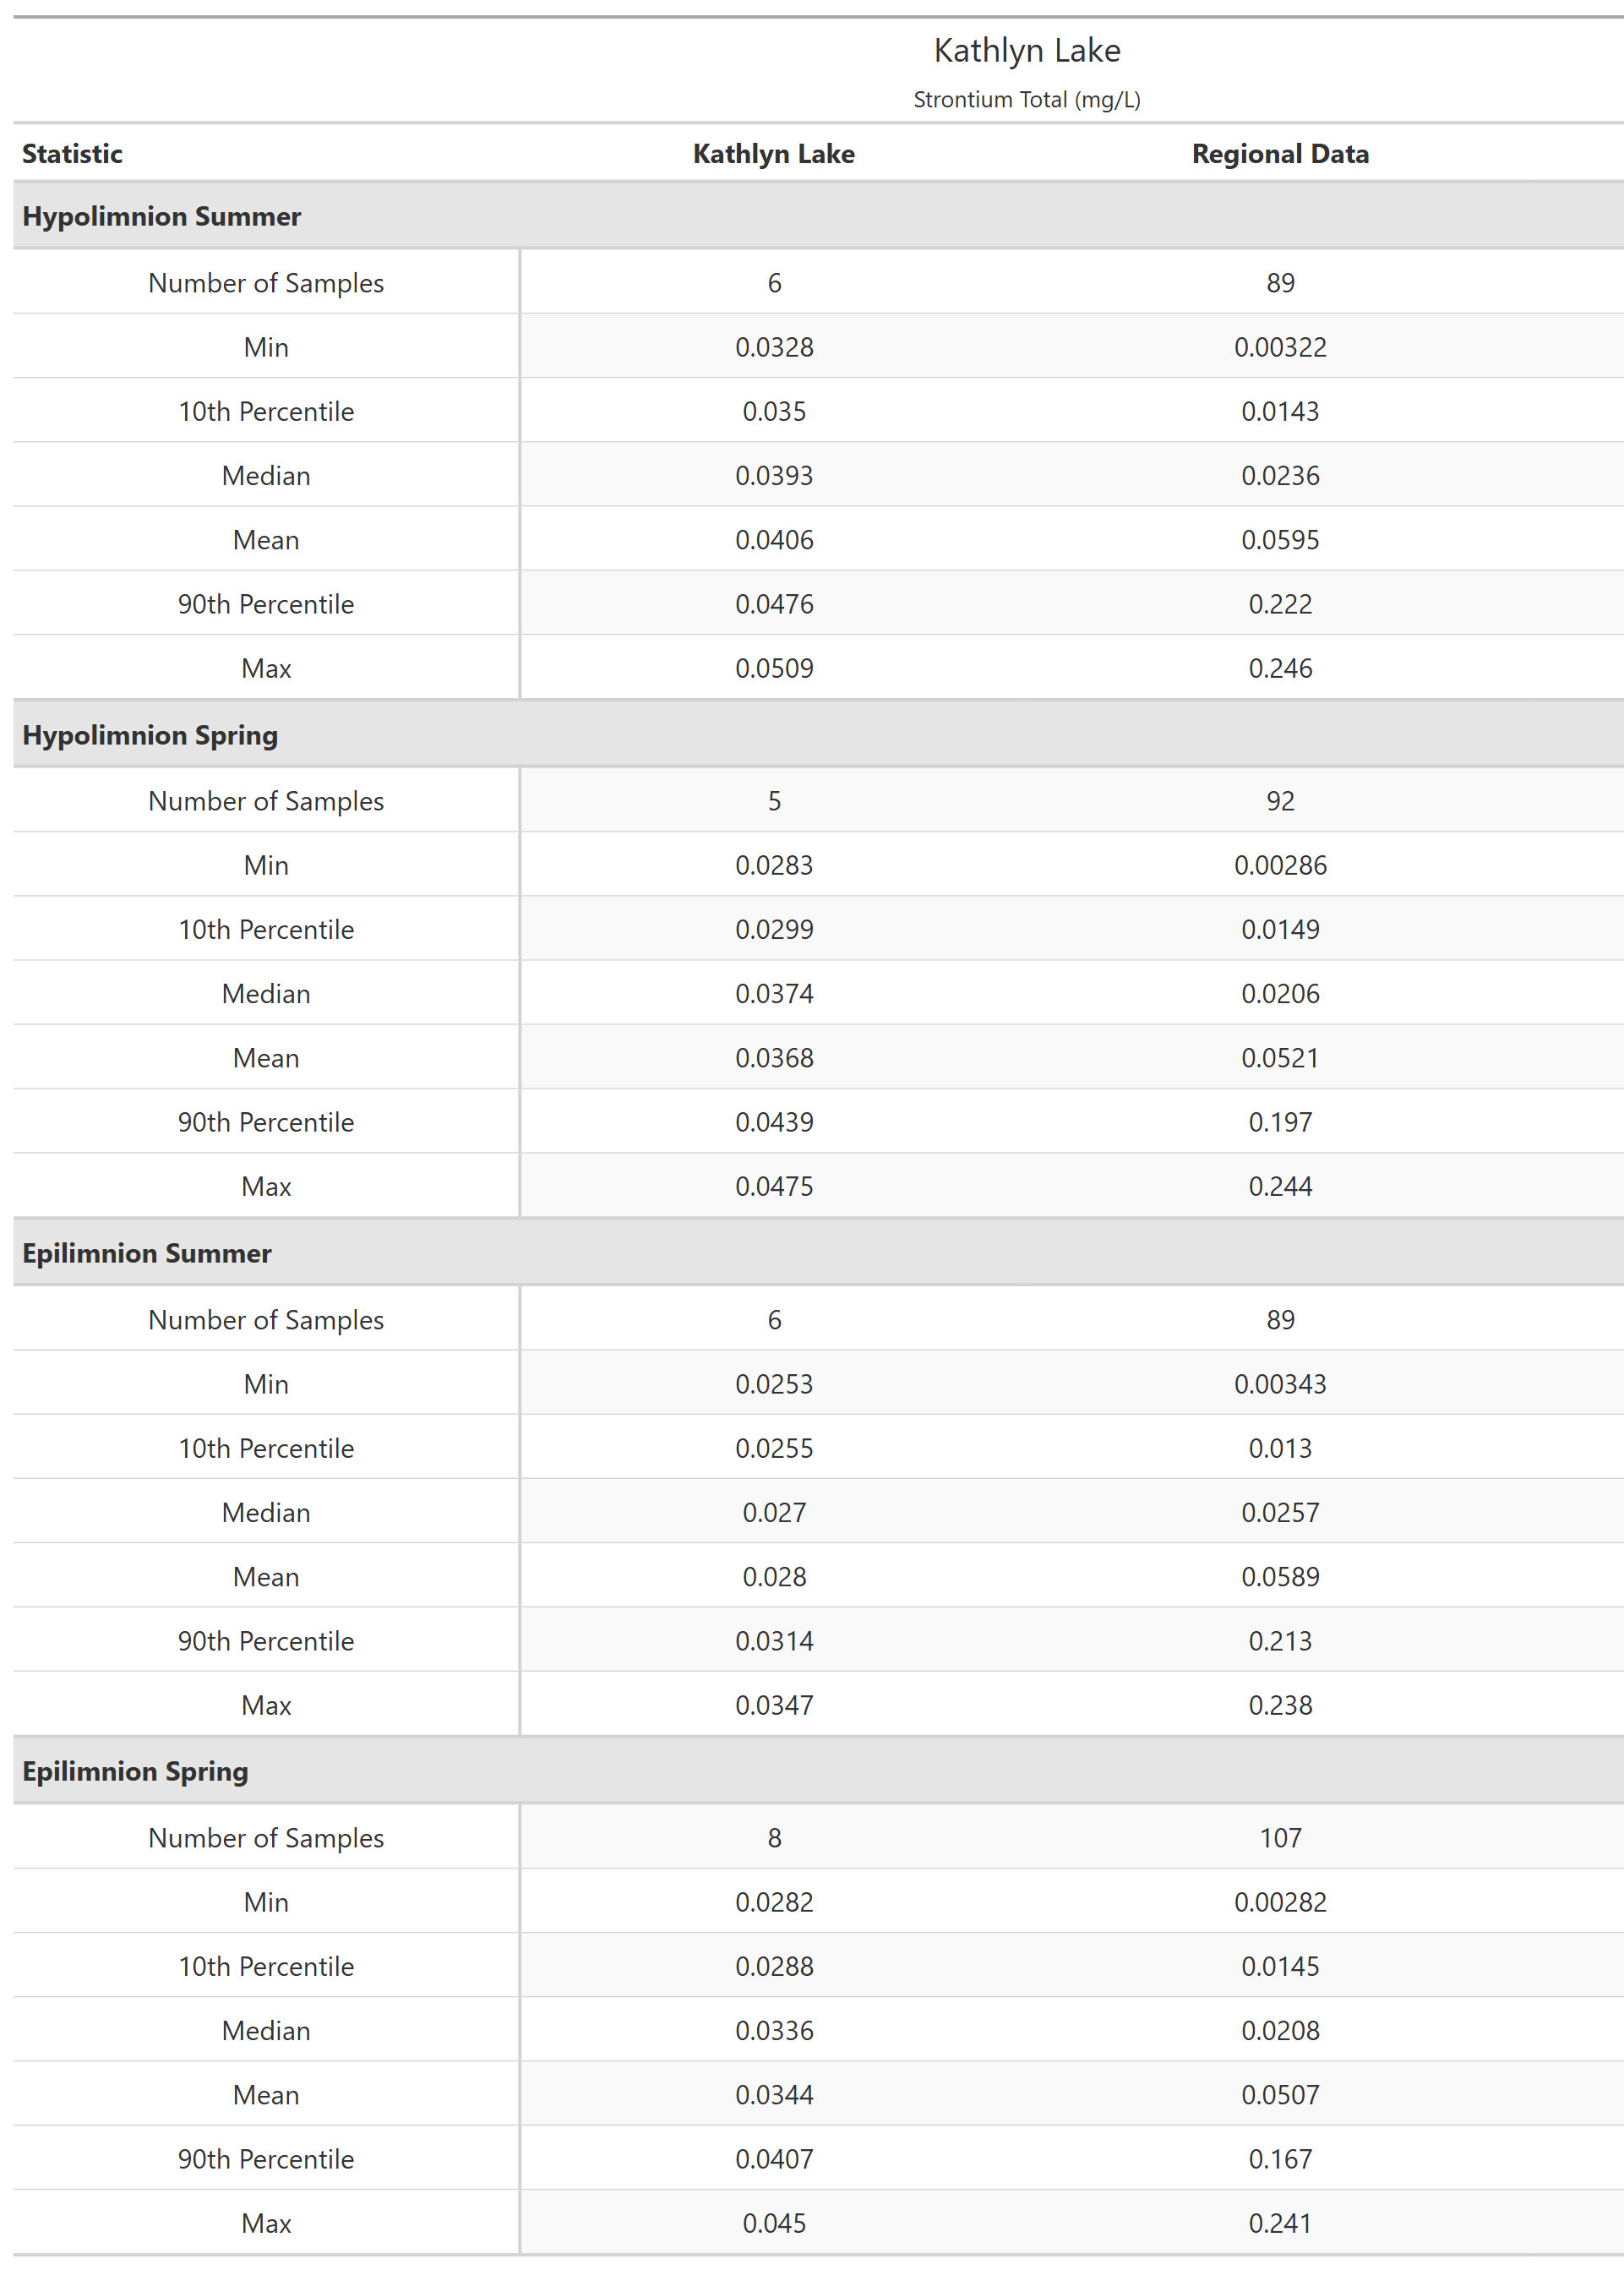
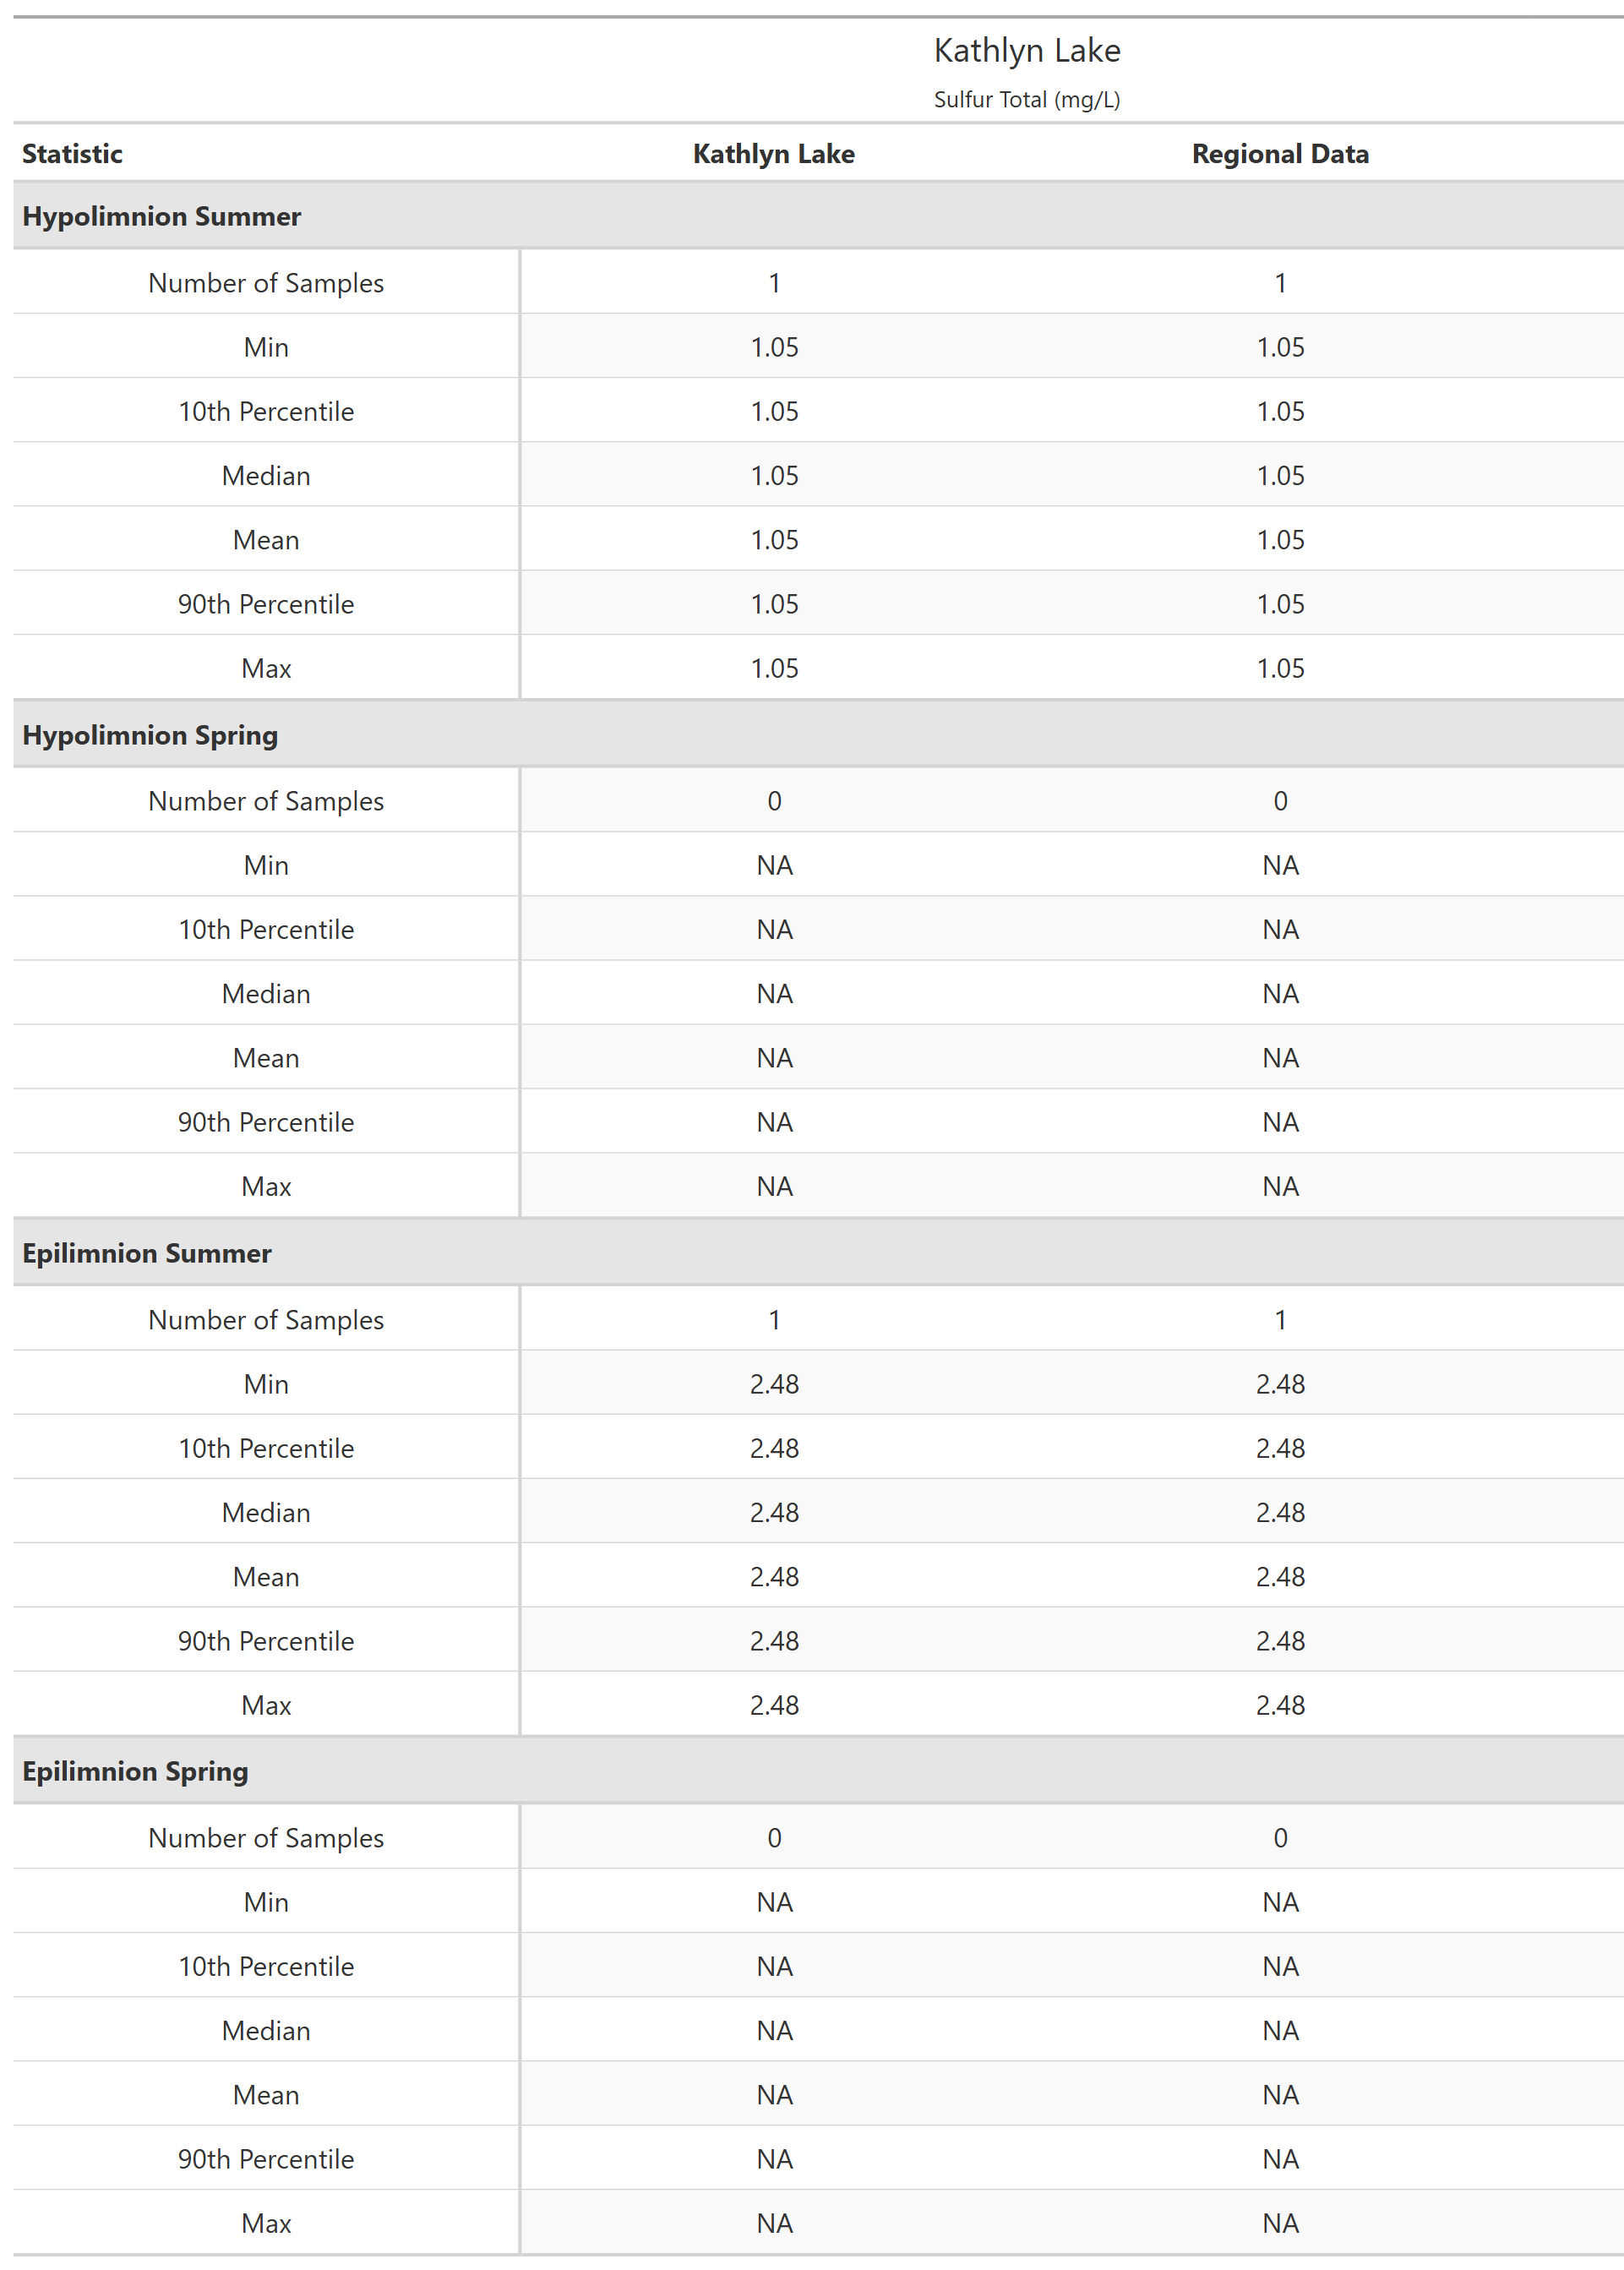
Metals - Total


Map
Bathymetric Maps
Click here to view a bathymetric map of this lake (1 of 1).
Disclaimer
This document was made by an automated system and has not necessarily gone through quality control checks, may be subject to large errors, it is presented “as-is” with no guarantee of accuracy or completeness. Read our full Disclaimer for more information.
Web Browser Support
To view the interactive map, graphs, and reports, you must use an up-to-date version of one of these browsers: Chrome™, Firefox®, Microsoft Edge, or Safari. Reports and graphs may not display for Windows 7, Internet Explorer 11 users
